Archive:European Neighbourhood Policy - South - living conditions statistics
Data extracted in June 2021.
Planned article update: March 2022.
Highlights
In 2016, expenditure on health accounted for more than one tenth of GDP in Palestine, the highest share among European Neighbourhood Policy-South countries and the only one to record a share higher than in the EU (9.9 %).
Among the European Neighbourhood Policy-South countries, Israel had the highest share of the population connected to public water supplies (100 %) and urban wastewater collecting systems (99 %) in 2019.
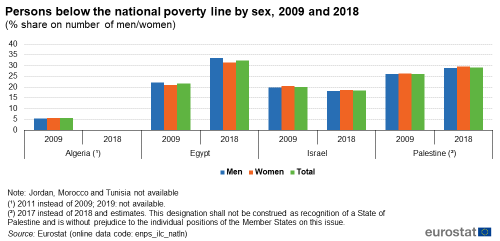
Persons below the national poverty line by sex, 2018
This article is part of an online publication and provides data for a range of statistics covering living conditions for eight of the countries that form the European Neighbourhood Policy-South (ENP-South) region, namely, Algeria, Egypt, Israel, Jordan, Morocco, Palestine [1] and Tunisia; no recent data are available for Lebanon, Libya or Syria.
The article includes information relating to the risk of poverty, health and social protection expenditure and the proportion of the population that is connected to the public water supply and urban wastewater collecting system.
Full article
Monetary poverty
The poverty threshold used for the data in Figures 1 is set at 60 % of the national median equivalised disposable income (after social transfers). The total net income of each household is calculated by adding together the income received by all the members of the household from all sources. For each person, the equivalised total net income is calculated as the household’s total net income divided by the equivalised household size, the latter generally based on the modified OECD scale: a weight of 1.0 for the first adult, 0.5 for other persons aged 14 or over who are living in the household and 0.3 for each child aged less than 14.

(% share on number of men_women)
Source: Eurostat (enps_ilc_natln)
Among the four ENP-South countries, for which data are available, Figure 1 shows that the highest proportion of persons below the national poverty line was found in Egypt. In this country, 32.5 % of the population was below the national poverty line in 2018, with 33.5 % males and 31.5 % females. The gender gap in 2019 was therefore 2.0 percentage points (pp) higher for males, as compared to 1.3 pp in 2009. Additionally, the shares of both males and females increased respectively by 11.3 pp and 10.6 pp since 2009. In Palestine, the second highest poverty share in the ENP-South countries for which data is available, 29.2 % of the population was below the poverty line in 2017 (no 2018 data). Males accounted for 28.8 % in 2017, when they accounted for 26.1 % in 2009, while females accounted for 29.7 % in 2017 and 26.4 % in 2009. Therefore, in a decade, there was a growth in the poverty gender gap in Palestine (from 0.3 pp to 0.9 pp) as well as a higher increase in the proportion of females found below the poverty gap with respects to males. The last ENP-South countries for which data is available was Israel, where 18.3 % of the population was below the poverty line in 2018 as opposed to 20.1 % in 2009. In 2018, males represented 18.1 % and females 18.6 %. A decade earlier, there were 19.8 % of males and 20.4 % of females. Thus, females always accounted for slightly more of the individuals under the national poverty line but Israel was the only country that recorded a decrease in poverty over the studied period. There was no recent data available for Algeria but the latest available data showed that in 2011, only 5.5 % of the population was below the poverty line, with a similar proportion of males (5.4 %) and females (5.5 %).
Health and social protection expenditure
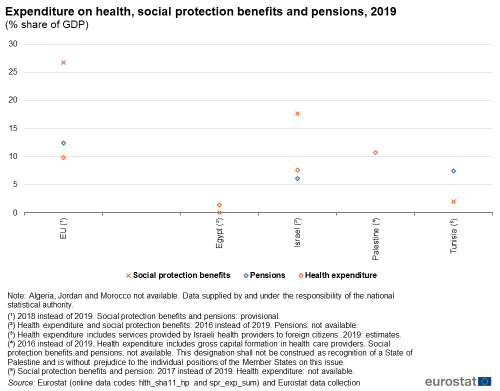
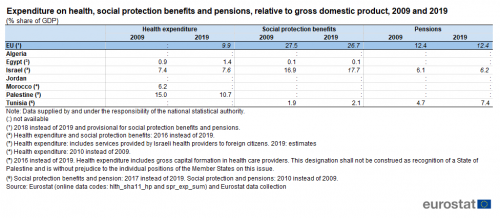
Total expenditure on health concerns total current expenditure on health and investment, regardless of the source of funds. It covers: curative and rehabilitative care (in-patient care, day cases, out-patient and home care); services of long-term nursing care (in-patient, day cases and home care); ancillary services to health care; medical goods dispensed to out-patients; services of prevention and public health; health administration and health insurance. The level of expenditure on health relative to gross domestic product (GDP) ranged greatly between the five ENP-South countries for which recent data are available in Figure 2 and Table 1, from a low of 1.4 % of GDP in Egypt (2016 data) to a high of 10.7 % in Palestine (2016 data). Palestine was the only ENP-South country to report a ratio of health expenditure (relative to GDP) that was higher than in the EU (9.9 %; 2018 data). Israel reported 7.6 % of health expenditure relative to GDP in 2019. No recent data on health expenditure was available for Morocco and Tunisia. Health expenditure in 2009 was found to be even higher for Palestine, with 15.0 % relative to GDP, thus there was a 4.3 pp decline in health expenditure between 2009 and 2016. By contrast, both Israel and Egypt increased their health expenditure during the period, by 0.2 pp and 0.5 pp respectively. Morocco’s total expenditure on health was 6.2 % in 2010 (no 2009 data available).

(% share of GDP)
Source: Eurostat (hlth_sha11_hp) and (spr_exp_sum) and from annual data collection cycle – see Data Sources
Social protection expenditure comprises social protection benefits, administration costs and other expenditure: the data shown in Figure %2 and Table 1 only concern benefits. Social benefits consist of transfers, in cash or in kind, by social protection schemes to households and individuals to relieve them of the burden of a defined set of risks or needs, provided that there is neither a simultaneous reciprocal nor an individual arrangement involved. The list of risks or needs is fixed as: sickness/health care; disability; old-age; survivors; family/children; unemployment; housing; and other social exclusion. Note that not all health expenditure falls within social protection expenditure. In 2019, expenditure on social protection benefits in the ENP-South countries was highest in Israel, with 17.7 %, while in Tunisia and Egypt it accounted for a low 2.1 % (2017 data) and 0.1 % (2016 data) respectively. In the EU, expenditure on social protection was equivalent to more than one quarter (26.7 %) of GDP in 2018 (no 2019 data available). No data was available for Algeria, Jordan Morocco or Palestine. Between 2009 and 2019, the ratio of expenditure on social protection benefits to GDP only very slightly varied in the countries for which data are available. It increased by 0.8 pp in Israel between 2009 and 2019 and by 0.1 pp in Tunisia between 2010 and 2017 (no more recent data available). However, in Egypt, the ratio of expenditure on social protection benefits remained stable over the decade, with 0.1 % relative to GDP in both 2009 and 2018 (no 2019 data available). Total expenditure on health declined in the EU by 0.8 pp between 2009 and 2016 (no more recent data available).

(% share of GDP)
Source: Eurostat (hlth_sha11_hp) and (spr_exp_sum) and from annual data collection cycle – see Data Sources
A large part of expenditure on social protection benefits is payments for pensions, and the relative importance of this depends, among other factors, on the age structure of the population. The two ENP-South countries for which data are available over time recorded an increase in the relative share of pensions. Tunisia reported an increase in this ratio from 4.7 % in 2009 to 7.4 % in 2017 (no 2019 data available), while Israel reported an slight increase between 2009 and 2019, from 6.1 % to 6.2 %. No data are available for pension expenditure in the other ENP-South countries. In the EU, the expenditure on pensions relative to GDP remained at the same level in 2009 and 2018 with 12.4 %, and it accounted for less than half of the total expenditure on social protection benefits in the EU.
The public water supply is water supplied by all economic entities engaged in collecting, purifying and distributing water. This definition includes the desalting of sea water (particularly relevant for some ENP-South countries, for example, Israel), but excludes system operation for agricultural purposes and the treatment of wastewater solely to prevent pollution.
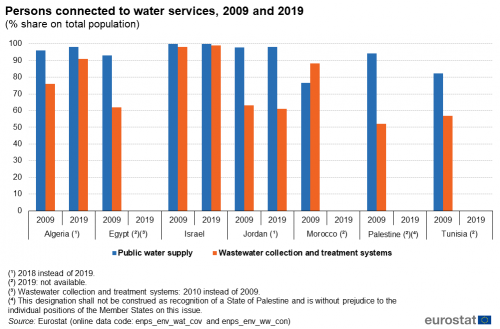
In most of the ENP-South countries for which data are available, a relatively high proportion of the population was connected to the public water supply (see Figure 3). In 2019, this ratio was the highest in Israel with 100.0 %. In Algeria and Jordan, the proportion was also very high with both 98.0 % in 2018 (no 2019 data available). The remaining ENP-South countries that had lower shares of their respective populations connected to the public water supply, did not have any available data for 2019. In Palestine and Egypt, the population connected to public water supply represented 94.1 % in 2009 and 93.0 % in 2010 (no 2009 data) respectively. Tunisia and Morocco had lower shares with 82.3 % and 76.5 % respectively, in 2009. Over the decade, Israel’s entire population was connected to public water supply (100 % in both 2009 and 2019). However, both Jordan and Algeria had lower shares a decade earlier and thus increased their connection to public water. Algeria experienced an increase of 2.0 pp between 2010 and 2018, while Jordan a 0.1 pp increase.

(% share on total population)
Source: Eurostat (enps_env_wat_cov) and (enps_env_ww_con)
Figure 3 also illustrates the proportion of the population connected to the urban wastewater collecting system (with treatment). In most of the ENP-South countries, a lower share of the population was connected to these services when compared with the data for people connected to the public water supply. In 2019, almost the entire population (99 %) of Israel was connected to an urban wastewater collecting system. Algeria (91 %) was the only other ENP-South countries to report at least 9 out of 10 people connected to these services. Morocco did not have available data for 2019, but in 2009, 88.4 % of the population was connected to wastewater collection and treatment systems. At the other end of the range, just over half (52.1 %) of the population in Palestine was connected to the urban wastewater collecting system in 2009. Tunisia, Jordan and Egypt each recorded shares of 56.9 % (2010 data), 61.0 % (2018 data) and 62.1 % (2010 data), respectively.
Source data for tables and graphs
Data sources
Data for the ENP-South countries are collected for a wide range of indicators each year through a questionnaire that is sent by Eurostat to ENP-South countries. A network of contacts has been established for updating these questionnaires, generally within the national statistical offices, but potentially including representatives of other data-producing organisations (for example, central banks or government ministries). The statistics shown in this article are made available free-of-charge on Eurostat’s website, together with other socio-economic indicators collected as part of this initiative.
EU statistics on income and living conditions (EU-SILC) is an instrument that aims to collect timely and comparable data on income, poverty, social inclusion and living conditions, in both monetary and non-monetary terms. The data are generally collected for private households and household members. EU-SILC provides both cross-sectional data and longitudinal data (typically over a four-year period).
The legal basis for this data collection exercise is Regulation (EU) 2019/1700 of the European Parliament and of the Council of 10 October 2019 establishing a common framework for European statistics relating to persons and households, based on data at individual level collected from samples; it is supported by a series of implementing regulations and special data collection modules that relate to the collection of secondary variables on a less regular basis. Beyond the Integrated European Social Statistics (IESS), three legal acts cover elements common to all social surveys:
- Commission Implementing Regulation (EU) 2019/2181 of 16 December 2019 specifying technical characteristics as regards items common to several datasets pursuant to Regulation (EU) 2019/1700 of the European Parliament and of the Council, establishing the technical characteristics of the statistical populations and observation units, descriptions of variables and of the statistical classifications for items common to several datasets across all seven domains;
- Commission Delegated Regulation (EU) 2020/256 of 16 December 2019 supplementing Regulation (EU) 2019/1700 of the European Parliament and of the Council by establishing a multiannual rolling planning, establishing periodicity of the data collection for all domains from 2021 until 2028;
- Commission Implementing Regulation (EU) 2019/2180 of 16 December 2019 specifying the detailed arrangements and content for the quality reports pursuant to Regulation (EU) 2019/1700 of the European Parliament and of the Council, establishing the structure of quality reports related to datasets to be transmitted by EU Member States to Eurostat.
In addition, for EU-SILC the following two regulations are in place:
- Commission Delegated Regulation (EU) 2020/258, specifying the number and the titles of the variables, for income and living conditions domain;
- Commission Implementing Regulation (EU) 2019/2242, specifying the technical items of data sets, the technical formats for the transmission of information and specifications of the detailed arrangements and content of the quality reports for the income and living conditions domain.
The European system of integrated social protection statistics (ESSPROS) is a common framework developed within the European Statistical System (ESS) that has been designed to provide a coherent comparison across European countries (27 EU Member States plus the United Kingdom, Iceland, Norway, Switzerland, Montenegro, North Macedonia, Serbia, Turkey as well as Bosnia and Herzegovina) of social benefits to households and their financing, in terms of precisely defined risks or needs that refer to the ESSPROS functions: disability, sickness/health care, old-age, survivors, family/children, unemployment, housing and social exclusion. The legal basis for the data collection exercise is provided by Regulation (EC) No 458/2007 of the European Parliament and of the Council on the European system of integrated social protection statistics (ESSPROS). ESSPROS is composed of a core system that contains annual data from 1990 onwards on (gross) expenditures and receipts. In addition to the core system, one module on pension beneficiaries and one on net social benefits data are available.
Tables in this article use the following notation:
| Value in italics | data value is forecasted, provisional or estimated and is therefore likely to change; |
| : | not available, confidential or unreliable value; |
| – | not applicable. |
Context
Social protection systems are generally well-developed in the EU: they are designed to protect people (to some degree) against the risks and needs associated with unemployment, parental responsibilities, sickness/health care and invalidity/disability, the loss of a spouse or parent, old-age, housing and other forms of social exclusion.
The main policy framework in this domain concerns the open method of coordination (OMC) for social protection and social inclusion, which aims to promote social cohesion and equality, through adequate, accessible and financially sustainable social protection systems and social inclusion policies. A Communication from the European Commission Working together, working better: a new framework for the open coordination of social protection and inclusion policies in the European Union (COM(2005) 706 final) outlines the objectives, which include:
- making a decisive impact on the eradication of poverty and social exclusion;
- providing adequate and sustainable pensions;
- ensuring accessible, high-quality and sustainable healthcare and long-term care.
The European Neighbourhood Policy (ENP), launched in 2004, supports and fosters stability, security and prosperity in the EU’s neighbourhood. The ENP was revised in 2015. The main principles of the revised policy are a tailored approach to partner countries; flexibility; joint ownership; greater involvement of EU member states and shared responsibility. The ENP aims to deepen engagement with civil society and social partners. It offers partner countries greater access to the EU's market and regulatory framework, standards and internal agencies and programmes.
The Joint Communication by the European External Action Service and the European Commission on Renewed Partnership with the Southern Neighbourhood, accompanied by an EU Economic and Investment Plan for our Southern Neighbours, of 9 February 2021 further strengthens cooperation with the ENP-South countries.
The main objective of Euro-Mediterranean cooperation in statistics is to enable the production and dissemination of reliable and comparable data, in line with European and international norms and standards.
Reliable and comparable data are essential for evidence-based decision-making. They are needed to monitor the implementation of the agreements between the EU and the ENP-South countries, the impact of policy interventions and the reaching of the Sustainable Development Goals (SDGs).
The EU has been supporting statistical capacity building in the region for a number of years through bilateral and regional capacity-building. This takes the form of technical assistance to partner countries’ national statistical authorities through targeted assistance programmes and activities such as training courses, working groups and workshops, exchange of best practice and the transfer of statistical know-how. Additional information on the policy context of the ENP is provided here.
Notes
- ↑ This designation shall not be construed as recognition of a State of Palestine and is without prejudice to the individual positions of the Member States on this issue.
Direct access to
Books
Leaflets
- Basic figures on the European Neighbourhood Policy — South countries — 2019 edition
- Basic figures on the European Neighbourhood Policy — South countries — 2018 edition
- Basic figures on the European Neighbourhood Policy — South countries — 2016 edition
- Basic figures on the European Neighbourhood Policy — South countries — 2015 edition
- Population and social conditions (med_ps)
- People at risk of poverty or social exclusion (Europe 2020 strategy) (ilc_pe)
- Income distribution and monetary poverty (ilc_ip)
- Living conditions (ilc_lv)
- Water (env_wat), see:
- Water statistics on national level (env_nwat)
- Southern European Neighbourhood Policy countries (ENP-South) (med) (ESMS metadata file — med_esms)
- Income and living conditions (ESMS metadata file — ilc)
- Water statistics on national level (ESMS metadata file — env_nwat)
- Directorate-General for Employment, Social Affairs and Inclusion
- Directorate-General for Employment, Social Affairs and Inclusion — Social protection and social inclusion
- European External Action Service — Middle East and North Africa (MENA)
- European External Action Service — European Neighbourhood Policy