Archive:European Neighbourhood Policy - East - transport statistics
Data extracted in April 2021.
Planned article update: March 2022.
Highlights
In 2019, Belarus had the highest motorisation rate among the European Neighbourhood Policy-East countries at 343 passenger cars per 1 000 inhabitants, followed by Georgia (304) and Moldova (183).
Motorisation rate, 2009 and 2019
This article is part of an online publication; it presents information on a range of transport statistics for the European Union (EU) and for the six countries that together form the European Neighbourhood Policy-East (ENP-East) region, namely, Armenia, Azerbaijan, Belarus, Georgia, Moldova and Ukraine. Data shown for Georgia exclude the regions of Abkhazia and South Ossetia over which Georgia does not exercise control, and the data shown for Moldova exclude areas over which the government of the Republic of Moldova does not exercise control. The latest data for Ukraine generally exclude the illegally annexed Autonomous Republic of Crimea and the City of Sevastopol and the territories which are not under control of the Ukrainian government (see specific footnotes for precise coverage). The article presents transport indicators covering road, rail, air and maritime transport.
Full article
Road transport
Transport is fundamental to the economy and to society as a whole. There are considerable variations between the ENP-East countries as regards their level of economic development, their total (land) area and population numbers, as well as their geography. This is reflected in differences in the efficiency, safety and environmental impact of the transport sector, as well as the infrastructure and the stocks of transport equipment. Transport statistics need to evolve to respond to policy needs, informing development towards clean, safe and efficient transport.
Among the ENP-East countries, car ownership is usually less commonplace than in the EU, and passenger cars tend to account for a lower share of the total number of road vehicles. Subject to data availability, Table 1 shows that Ukraine had the highest total number of passenger cars, at 6.9 million in 2011 (no fresher data are available for Ukraine), while the next highest counts (for 2019) were recorded in Belarus (3.2 million), Azerbaijan (1.2 million) and Georgia (1.1 million).
In 2019, the share of passenger cars in the total number of road motor vehicles was estimated to be 86 % in the EU. This was slightly lower than the ratio recorded for Azerbaijan (87 %), but higher than the ratio in Georgia (84 %). The relative importance of passenger cars within the stock of road motor vehicles was lower in the other ENP-East countries (latest data for Ukraine relates to 2011; no data available for Armenia).
Among the ENP-East countries, Ukraine (510 thousand; 2011 data) had the highest number of lorries, followed by Belarus (412 thousand; 2019 data).
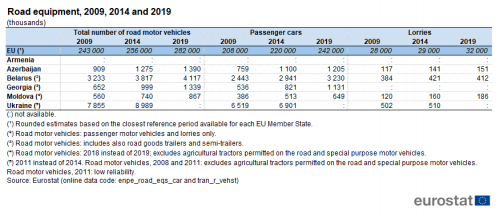
(thousands)
Source: Eurostat (enpe_road_eqs_car) and (tran_r_vehst)
The motorisation rate (see Figure 1) shows the number of passenger cars relative to the size of the population. Belarus had the highest motorisation rate among the ENP-East countries for which data are available, at 343 passenger cars per 1 000 inhabitants in 2019, followed by Georgia (304 per 1 000 inhabitants) and Moldova (183 per 1 000 inhabitants). These rates were considerably lower than the rate of 540 passenger cars per 1 000 inhabitants estimated for the EU.
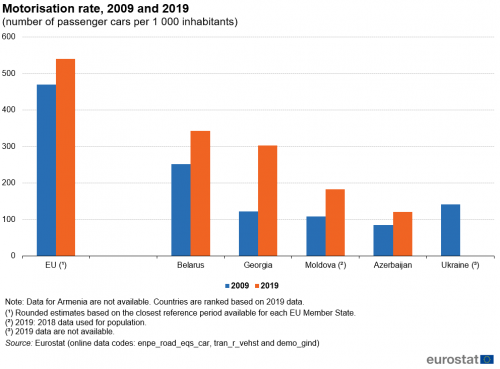
(number of passenger cars per 1 000 inhabitants)
Source: Eurostat (enpe_road_eqs_car), (tran_r_vehst) and (demo_gind)
Figure 2 presents information on the number of persons killed in road accidents relative to the population. This provides a basis for comparing the frequency of road accidents between countries of different sizes. In the EU there was a marked reduction in the total number of road deaths per 100 000 inhabitants over the past decade, from 7.5 persons killed per 100 000 inhabitants in 2009 to 5.2 in 2018 (2019 data not yet available).
Over the decade, there was a notable decrease in the relative number of road deaths in all ENP-East countries, except Armenia. Georgia continued recording the highest rate of persons killed in road accidents among these countries, despite the rate falling by -3.0 from 19.9 road deaths per 100 000 inhabitants in 2009 to 13.9 in 2017 (the most recent data available). In contrast, the in Belarus fell from 13.7 in 2009, the second highest among the ENP-East countries, to 5.4 in 2019, the lowest rate. This improved road safety corresponded to a fall in the yearly number of road deaths of -8.3 per 100 000 inhabitants over this period. Marked improvements in the rate of road deaths were registered also in Moldova (by -5.8), Ukraine (-3.5; 2009-2017) and Azerbaijan (-2.2).
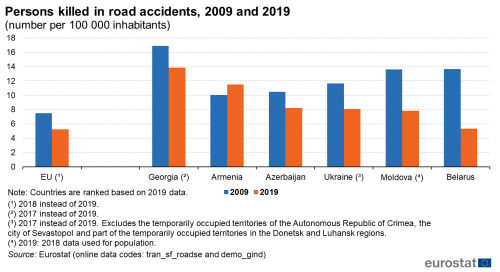
(number per 100 000 inhabitants)
Source: Eurostat (tran_sf_roadse) and (demo_gind)
Rail transport
Rail services provide an alternative to road transport and are generally considered as more environmentally friendly. Table 2 presents indicators for analysing developments in the transport of passengers and freight by rail. Passenger-kilometres (pkm) and tonne-kilometres (tkm or tonne-km) are the main measurements used for analysing transport volumes of passengers and freight, respectively. Measured on this basis, there was confirmation that rail passenger transport fell from 2009 to 2019 in several of the ENP-East countries. One exception was Armenia, where the rail passenger transport performance doubled, albeit at a low level, from 35 million pkm in 2009 to 70 million pkm in 2019. Another was Georgia (data refer to the transport on the national territory and abroad), where the rail passenger performance increased by a bit less than +4 %, from 626 to 649 million pkm, with a dip recorded during the period. Particular high falls in rail passenger transport over the period 2009-2019 were recorded in Moldova (-88 %), where there was a steep fall (-84 %) between 2014 and 2019, and Azerbaijan (-49 %). In contrast, rail passenger transport in the EU increased by one fifth (+20 %) in the period from 2007 to 2019, reaching 415 744 million pkm in 2019.
The quantity of rail freight transport in the EU — measured in tonne-km — was also higher in 2019 than in 2009 (an overall increase of +16 %) and in half of the ENP-East countries. The highest increases were recorded in Moldova (+33 %), despite a fall compared to 2014, Armenia (+20 %) and Belarus (+13 %). In Georgia, the transport of freight by rail almost halved (-46 ,%) from 2009 to 2019.
Among the ENP-East countries, Ukraine and Belarus had the highest rail freight transport by far in 2019. Ukraine recorded 62.1 billion tkm of rail freight transport in 2019, only -11 % less than in 2009, despite the smaller geographical coverage (see footnote in Table 2). The second highest volume in 2019 was recorded in Belarus with 48.2 billion tkm, far ahead of Georgia in third place (2.9 billion tkm). In comparison, the EU recorded 399.1 billion tkn of rail freight transport in 2019 (not including Belgium).
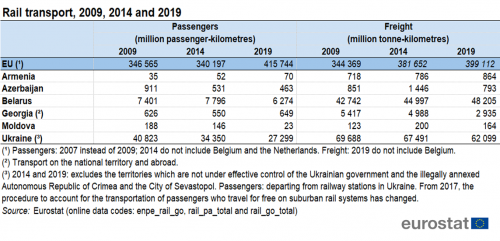
Source: Eurostat (enpe_rail_go), (rail_pa_total) and (rail_go_typeall)
Air transport
There has been considerable expansion in air services in recent decades, both in terms of passenger numbers and freight carried. Although there has been rapid growth, it is worthwhile noting that the weight of goods carried by air is relatively low, given the high cost of this mode of transport (for example, when compared with maritime freight) especially for bulky items.
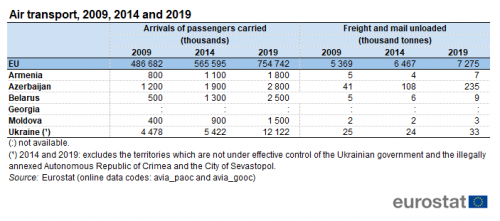
Table 3 presents two main indicators for air transport, namely the number of passenger arrivals and the quantity of air freight and mail arrivals. In 2019, there were 755 million air passenger arrivals in the EU. The combined number of arrivals in the ENP-East countries (excluding Georgia) was 20.7 million, which was equivalent to 2.7 % of the EU total. The highest number of air passenger arrivals among the ENP-East countries was registered in Ukraine (12.1 million), followed by Azerbaijan (2.8 million) and Belarus (2.5 million).
The number of EU air passenger arrivals increased overall by 55 % between 2009 and 2019. All of the ENP-East countries for which data are available (no data for Georgia) recorded much higher growth rates for air passenger arrivals between 2009 and 2019, although from relatively low initial levels. The most rapid expansion was recorded for Belarus, where air passenger arrivals were 5 times as high in 2019 as they had been 10 years earlier, while in Moldova they were almost 4 times as high.
The highest quantity of air freight and mail arrivals among the ENP-East countries was recorded in Azerbaijan, reaching 235 thousand tonnes in 2019 (no data for Georgia). This marked a considerable expansion when compared with just five years earlier (108 thousand tonnes in 2014). In contrast, 7.3 million tonnes of air freight and mail arrived in the EU in 2019. The quantity of air freight and mail arrivals remained at a much lower level in the other ENP-East countries, although some growth could be seen over the most recent 5-year period.
Maritime transport
Armenia, Belarus and Moldova are all landlocked countries, without sea ports. Thus, no data collection on maritime transport are applicable for these countries.
The final table in this article, Table 4, presents some main indicators for maritime passenger and freight transport. In 2019, there were 202 million passengers carried by maritime services in the EU; this marked a rise of just under 2 % when compared with the situation in 2009, but a rise by 13 % when compared to 2014. Data on maritime transport are only available for two of the three ENP-East countries with access to the sea, Azerbaijan and Ukraine, but not for Georgia. Azerbaijan has a relatively low level of maritime passenger activity, but higher levels of maritime freight, with Baku on the Caspian Sea playing an important role on Europe-Asia transit routes. However, there has been sharp contraction in the quantity of freight unloaded in Azerbaijan over the last 5-year period, falling by close to two thirds (-65 %) from 10.2 million tonnes in 2014 to 3.6 million tonnes in 2019.
During the last decade, there was a dramatic reduction in both the number of maritime passengers carried and the quantity of maritime freight carried into Ukraine. These developments may be linked to the political tension between Ukraine and Russia, which may have impacted on the lower passenger numbers arriving in Black Sea ports, while trade sanctions/embargos between Ukraine and Russia from 2014 onwards may explain (some of) the subsequent reduction in maritime trade. Note also that the data for 2018 exclude the illegally annexed Autonomous Republic of Crimea and the City of Sevastopol, with especially Crimea influencing the maritime transport of Ukraine. unloaded on Crimea and in the sorruonding area .
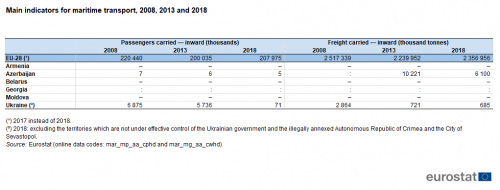
Source: Eurostat (mar_mp_aa_cphd) and (mar_mg_aa_cwhd)
Source data for tables and graphs
Data sources
The data for ENP-East countries are supplied by and under the responsibility of the national statistical authorities of each country on a voluntary basis. The data that are presented in this article result from an annual data collection cycle that has been established by Eurostat. These statistics are available free-of-charge on Eurostat’s website, together with a range of different indicators covering most socio-economic areas.
For the EU, transport statistics are available with an annual frequency and generally begin in the early 1990s. Eurostat’s statistics describe the most important features of transport, not only in terms of the quantities of freight and numbers of passengers that are moved each year, or the number of vehicles and infrastructure that are used, but also the contribution of transport services to the economy as a whole. Data collection is supported by several legal acts obliging the EU Member States to report statistical data (framework legislation and implementing legislation, organised according to the mode of transport under consideration), as well as voluntary agreements to supply additional data.
Passenger transport statistics
The majority of passenger transport statistics are based on vehicle movements in each of the reporting countries, regardless of the nationality of the vehicle or vessel involved (the ‘territoriality principle’). For this reason, the measure of passenger-kilometres (pkm, which represents one passenger travelling a distance of one kilometre) is generally considered as a more reliable measure, as a count of passengers entails a higher risk of double-counting, particularly for international transport.
Freight transport statistics
As with passenger transport statistics, freight transport statistics are generally based on movements in each reporting country, regardless of the nationality of the vehicle or vessel involved (the ‘territoriality principle’). For this reason, the measure of tonne-kilometres (tkm or tonne-km, in other words, one tonne of goods travelling a distance of one kilometre) is generally considered a more reliable measure when analysing freight transport statistics, as the simple use of tonnes entails a higher risk of double-counting, particularly for international transport.
Transport safety
Eurostat publishes transport safety data for road, rail, inland waterways, maritime and air transport. CARE is the European centralised database on road accidents which result in death or injury across the EU, developed on the basis of Council Decision 93/704/EC; it is managed by the Directorate-General for Mobility and Transport.
Tables in this article use the following notation:
| Value in italics | data value is forecasted, provisional or estimated and is therefore likely to change; |
| : | not available, confidential or unreliable value; |
| – | not applicable. |
Context
An efficient and well-functioning passenger and freight transport system is vital for enterprises and inhabitants. The ability to move goods safely, quickly and cost-efficiently to markets is important for international trade, national distributive trades, and economic development.
The European Commission’s Directorate-General for Mobility and Transport is responsible for developing transport policy within the EU. It aims to develop policy to foster clean, safe and efficient travel throughout Europe, underpinning the internal market for goods (transferring them between their place of production and consumption) and the right of citizens to travel freely throughout the EU (for both work and pleasure).
On 18 November 2015, the High Representative for Foreign Affairs and Security Policy and the European Commission jointly presented a review of the European Neighbourhood Policy (SWD(2015) 500 final) which set out a revised approach for the EU in relation to its eastern and southern neighbours, based on stabilising the region in political, economic, and security-related terms.
In cooperation with its ENP partners, Eurostat has the responsibility ‘to promote and implement the use of European and internationally recognised standards and methodology for the production of statistics, necessary for developing and monitoring policy achievements in all policy areas’. Eurostat undertakes the task of coordinating EU efforts to increase the statistical capacity of the ENP countries. Additional information on the policy context of the ENP is provided here.
Direct access to
- All articles on non-EU countries
- All articles on transport, in particular Transport statistics introduced and Transport introduced
- European Neighbourhood Policy countries — statistical overview — online publication
- Statistical cooperation — online publication
Books
- Statistics on European Neighbourhood Policy countries: East — 2018 edition
- Energy, transport and environment statistics — 2019 edition
Leaflets
- Basic figures on the European Neighbourhood Policy — East countries — 2019 edition
- Basic figures on the European Neighbourhood Policy — East countries — 2018 edition
- Basic figures on the European Neighbourhood Policy — East countries — 2016 edition
- Basic figures on the European Neighbourhood Policy — East countries — 2015 edition
- Basic figures on the European Neighbourhood Policy — East countries — 2014 edition
- International trade for the European Neighbourhood Policy — East countries — 2016 edition
- European Neighbourhood Policy-East countries — Statistics on living conditions — 2015 edition
- European Neighbourhood Policy — East countries — Key economic statistics — 2014 edition
- European Neighbourhood Policy — East countries — Labour market statistics — 2014 edition
- European Neighbourhood Policy — East countries — Youth statistics — 2014 edition
- Transport (enpe_tra)
- Rail transport (enpe_rail)
- Road transport (enpe_road)
- Maritime transport (enpe_mar)
- Transport (enpe_tra)
- Transport, see:
- Railway transport (rail)
- Road transport (road)
- Maritime transport (mar)
- Air transport (avia)
- Glossary for transport statistics — 5th edition — 2019
- Eastern European Neighbourhood Policy countries (ENP-East) (ESMS metadata file — enpe_esms)
