Archive:Household consumption expenditure - national accounts
The final consumption expenditure of households is the biggest component of the expenditure approach of GDP. Its evolution allows an assessment of purchases made by households, reflecting changes in wages and other incomes, but also in employment and in the behaviour towards savings. Therefore, the growth of household consumption can be somewhat different from the growth of wages and incomes.
Main statistical findings
The consumption habits of households vary substantially among the 27 EU Member States. Factors such as culture, income, weather, household composition, economic structure and degree of urbanisation can influence habits in each country.
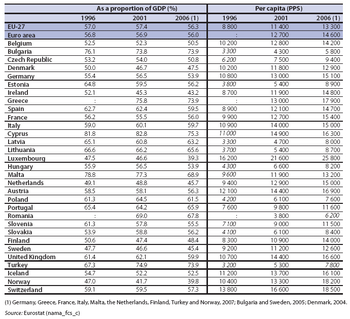
According to national accounts, the final consumption expenditure of households was the equivalent of at least one half of GDP in the majority of Member States; the share was highest in Cyprus (75.3 %), Bulgaria and Greece (both 73.9 %) in 2006 and only less than 50 % in Finland, Denmark, the Netherlands, Sweden, Ireland and Luxembourg. Average household consumption expenditure per capita was by far the highest in Luxembourg (PPS 25 800), followed by Greece (PPS 17 900) and Austria (PPS 16 900). Average household expenditure tended to be lowest in those countries that joined the EU since 2004, the principal exceptions being Cyprus and Malta.
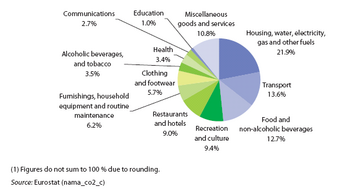
National accounts data also reveals that a little over one fifth (21.9 %) of total household consumption expenditure in the EU-27 in 2006 was devoted to housing, water, electricity, gas and other housing fuels. Transport expenditure (13.6 %) and expenditure on food and non-alcoholic beverages (12.7 %), together accounted for a little more than a quarter of total households consumption expenditure, making these the next two most important categories in the EU-27.
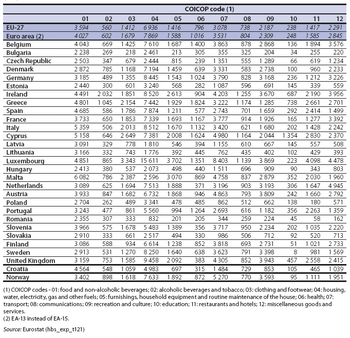
Both the Household budget survey (HBS) and national accounts provide a far more detailed breakdown of these aggregated consumption expenditure statistics. Switching to HBS data, the proportion of household expenditure devoted to each of the consumption categories varied greatly between the Member States in 2005. The highest proportion of the mean consumption expenditure of households (in PPS) spent on housing, water, electricity, gas and other fuels in 2005 was recorded in Sweden (32.2 %), which was about three times as high as in Malta (9.1 %). The proportion of household consumption spent on food and non-alcoholic beverages tended to be highest in those Member States where household incomes were lowest; in Romania such items accounted for 44.2 % of the mean consumption expenditure of households, which could be compared with an average of 9.3 % in Luxembourg.
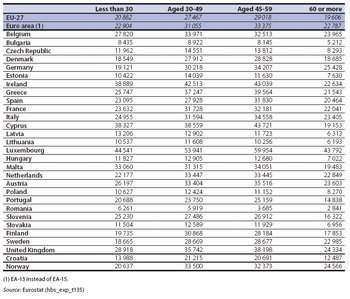
Household consumption expenditure was also reflected in certain broad socio-demographic patterns. The mean consumption expenditure of households whose head was aged 30 to 59 years old tended to be much higher than the equivalent expenditure of households whose head was either aged under 30 or over 60. In a number of the Member States that joined the EU since 2004, average household consumption expenditure of those households headed by a person aged under 30 was generally much closer to the expenditure of households headed by someone of an older working age (30 to 59), and in Latvia and Romania was higher.
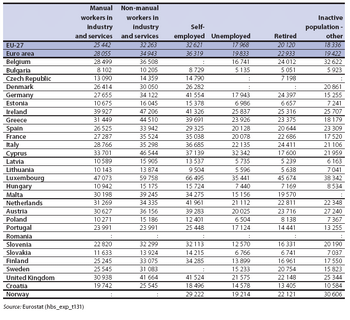
Households headed by the self-employed or non-manual workers in industry and services in the EU-27 had, on average, the highest mean consumption expenditure of about PPS 32 500 in 2005, with that of households headed by manual workers about 25 % lower.
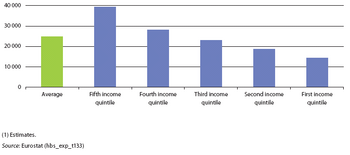
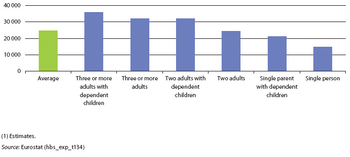
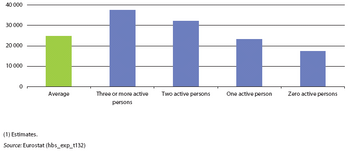
As may be expected, there was a strong link between household income and expenditure across the EU-27; the 20 % of households with the highest incomes spent an average of about two and three quarters times as much as the poorest 20 % of households in 2005. There was also a strong correlation between average household consumption expenditure, the size of households and the number of active persons in the household. Household consumption expenditure was highest in households with three or more adults with dependent children and lowest within single person households, while households with three or more active persons spent more than households with no active persons. Nevertheless, in both cases the relationship was not linear: economies of scale (for example, sharing a flat or a car, heating a room, etc.) may, at least to some degree, explain why the expenditure of a single person is generally considerably more than half the expenditure of a couple.
Data sources and availability
Final consumption expenditure of households refers to expenditure incurred on the domestic territory (by residents and non-residents) on goods and services used for the direct satisfaction of individual needs. It covers the purchase of goods and services, the consumption of own production (such as garden produce) and the imputed rent of owner-occupied dwellings. The Council regulation (EC) 2223/96 for the European system of accounts 1995 provides the underlying basis for the collection of data on household consumption expenditure with respect to data provided by Eurostat’s national accounts statistics. Note that the data from national accounts should include institutional households.
Context
The Household budget survey (HBS) describes the level and the structure of household expenditure. HBS are national surveys that focus on consumption expenditure, and nationally are used to calculate weights for consumer price indices; they may also be used in the compilation of national accounts. HBS are sample surveys conducted in all of the Member States, as well as Croatia, the former Yugoslav Republic of Macedonia, Turkey, Norway and Switzerland, on a periodic basis (about every five to six years).
HBS provide a picture of the total consumption expenditure of private households, analysed by a variety of socio-economic household characteristics such as the employment status of the main reference person, their income, their age, the number of active persons living in the household, the type of household, the location of the household (rural or urban), or the main source of income. Information is available at a detailed level using the Classification of individual consumption by purpose (COICOP), with over 230 headings for different goods and services (including aggregates).
HBS data are confined to the population residing in private households. In other words, the survey excludes collective or institutional households (such as hospitals, old persons’ homes, prisons, or military barracks), as well as persons without a fixed place of residence – in contrast to the data collected for national accounts. The basic unit for the collection of information is the household (defined as a social unit which shares household expenses or daily needs, in addition to having a common residence) – in other words, the household is seen as a housekeeping unit. Nevertheless, it is also important to identify the head of the household, as their personal characteristics are often used as the basis to classify information on socio-economic characteristics. The head of the household is defined, for the purpose of the HBS, as the person who contributes the most to the income of the household (the main earner). To take economies of scale into account, household expenditures can be expressed per adult equivalent (see previous subchapter for more details).
For the HBS, household consumption expenditure is defined as the value of goods and services used for directly meeting human needs. Household consumption covers expenditure on purchases of goods and services, own consumption, and the imputed rent of owner-occupied dwellings (the rent that the household would pay if it were a tenant). The expenditure effected by households to acquire goods and services is recorded at the price actually paid, which includes indirect taxes (VAT and excise duties) borne by the purchaser. Eurostat guidelines encourage non-monetary components of consumption to be included within the survey results, with internal production valued at retail prices, as if the product had been bought in a shop. Examples of internal production include own production of food (either by a farming household or by a family that has a different professional activity but grows their own food in a kitchen/vegetable garden or allotment), or withdrawals from stocks for own-use in the case of tradesmen or retailers. HBS data should also reflect benefits in kind provided by employers in exchange for work done. Notional rents are imputed to owner-occupiers and households accommodated free of charge.
Further Eurostat information
Publications
Main tables
- National accounts, see:
- National accounts
- Annual national accounts
- National Accounts detailed breakdowns (by industry, by product, by consumption purpose)
- Final consumption expenditure of households by consumption purpose
- National Accounts detailed breakdowns (by industry, by product, by consumption purpose)
- Annual national accounts
Database
- National accounts, see:
- National accounts
- Annual national accounts
- National Accounts detailed breakdowns (by industry, by product, by consumption purpose)
- Final consumption expenditure of households by consumption purpose
- National Accounts detailed breakdowns (by industry, by product, by consumption purpose)
- Annual national accounts
Dedicated section
Other information
<Regulations and other legal texts, communications from the Commission, administrative notes, Policy documents, …>
For other documents such as Commission Proposals or Reports, see EUR-Lex search by natural number
External links
See also
Further Eurostat information
Publications
Tables, graphs and maps
- Economy and finance
- National accounts (including GDP) see:
- Annual national accounts
- National Accounts detailed breakdowns (by industry, by product, by consumption purpose)
- Final consumption expenditure of households by consumption purpose
- National Accounts detailed breakdowns (by industry, by product, by consumption purpose)
- Annual national accounts
Database
- Economy and finance
- National accounts (including GDP) see:
- Annual national accounts
- National Accounts detailed breakdowns (by industry, by product, by consumption purpose)
- Final consumption aggregates
- Final consumption expenditure of households by consumption purpose
- Final consumption aggregates
- National Accounts detailed breakdowns (by industry, by product, by consumption purpose)
- Annual national accounts
Other information
- COICOP-HBS 1997 (Classification of Individual Consumption by Purpose)
