Archive:European Neighbourhood Policy - South - international trade in goods statistics
Data extracted in December 2019.
Planned article update: March 2021.
Highlights
All of the European Neighbourhood Policy-South countries recorded deficits for trade in goods with the EU in 2018, except Algeria which recorded a surplus.
In 2018, the EU was a key partner for trade in goods for most European Neighbourhood Policy-South countries, particularly Tunisia, Morocco and Algeria.
This article is part of an online publication and provides data on international trade in goods for 9 of the 10 countries that form the European Neighbourhood Policy-South (ENP-South) region — Algeria, Egypt, Israel, Jordan, Lebanon, Libya, Morocco, Palestine [1] and Tunisia; no recent data available for Syria. The article highlights some of the key indicators for tracing developments in international trade, with information on exports, imports and the trade balance. It also presents an analysis of international trade by selected product groups (based on the standard international trade classification (SITC)) and an analysis of the ENP-South countries’ trade positions with the European Union (EU).
Full article
Trade balance
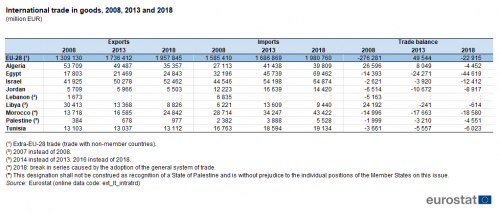
<newarticle>The EU-28 ran a trade deficit for goods with non-member countries in 2018, valued at EUR 22.9 billion. Equally, all of the ENP-South countries for which data are available recorded deficits for trade in goods in 2018 (2016 data for Libya; no recent data for Lebanon). Imports of goods exceeded exports by as much as EUR 44.6 billion in Egypt, while Morocco recorded a trade deficit of EUR 18.6 billion<newarticle> (see Table 1).

(million EUR)
Source: Eurostat (ext_lt_intratrd)
The EU-28’s exports of goods increased by 50 % in current price terms over the period 2008-2018, while imports increased by 25 %, the difference in these growth rates resulting in a much narrower trade deficit in 2018 than in 2008; note that in some of the intervening years the EU-28 recorded a surplus for trade in goods, for example in 2013 as shown in Table 1. There was also an expansion in the level of goods both imported and exported across nearly all of the ENP-South countries (for which data are available) during this period, despite sometimes large reductions in international trade during the financial and economic crisis; the exceptions were falls of 3.6 %, 34 % and 71 % in Jordanian, Algerian and Libyan (2008-2016) exported goods; Algerian and Libyan exports of goods are dominated by mineral fuels (petroleum and gas), lubricants and related materials and can vary greatly due to relatively volatile prices. Particularly strong export growth between 2008 and 2018 was recorded in Palestine where the value of goods exported more than doubled, increasing by 155 %.
The value of imported goods into Palestine and Egypt was more than twice as high in 2018 as it had been in 2008, while imported goods increased by more than 50 % in Libya (2008-2016) and Morocco. The smallest increases in the level of goods imported —under 20 % — were recorded in Jordan and Tunisia, both of which therefore recorded imports expanding at a slower pace than in the EU-28 (up 25 %) during the 10-year period shown in Table 1.
The result of these developments for exports and imports was that Algeria’s and Libya’s trade surpluses for goods in 2008 turned into deficits by 2018 (2016 for Libya). All of the remaining ENP-South countries for which data are available reported larger trade deficits for goods in 2018 than in 2008, most notably (in relative terms) Egypt and Israel.
Trade in goods analysed by broad group of product
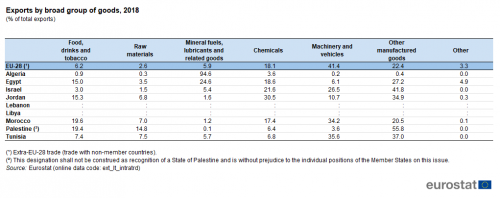
There were considerable differences in the structure of the goods exported from ENP-South countries and those from the EU-28. The principal export categories for the EU-28 in 2018 included machinery and vehicles (41.4 % of all goods exported), other manufactured goods (22.4 %) and chemicals (18.1 %); together these three groups accounted for just over four fifths (82.0 %) of the total value of EU-28 exports in 2018 (see Table 2). By contrast, mineral fuels, lubricants and related goods accounted for almost all (94.6 %) of the total value of goods exported from Algeria in 2018 and around one quarter (24.6 %) of those exported from Egypt. The percentage of exports accounted for by food, drinks and tobacco was highest in Morocco (19.6 %), Palestine (19.4 %), Jordan (15.3 %) and Egypt (15.0 %) where this category represented approximately two to three times the share recorded in the EU-28 (6.2 % of the total value of goods exported). Other manufactured goods accounted for more than half (55.8 %) of the goods exported from Palestine and for more than two fifths (41.8 %) of the goods exported from Israel. Exports of machinery and vehicles accounted for at least one third of the total value of goods exported from Tunisia (35.6 %) and Morocco (34.2 %). Exports of chemicals accounted for just over three tenths (30.5 %) of the total value of goods exported from Jordan in 2018.

(% of total exports)
Source: Eurostat (ext_lt_intratrd)
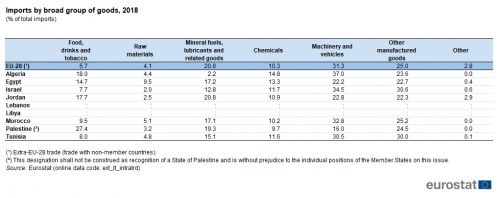
Table 3 shows that the structure of imported goods was broadly comparable across most of the ENP-South countries and in relation to the EU-28. The three largest categories of imports (in value terms) were generally mineral fuels, lubricants and related goods; machinery and vehicles; other manufactured goods. Together these three groups accounted for just over three quarters (77.1 %) of the EU-28’s imported goods in 2018. A similar pattern was observed for many of the ENP-South countries, although there were exceptions. In Algeria imports of mineral fuels, lubricants and related goods were particularly low, as were imports of machinery and vehicles in Palestine, such that food, drink and tobacco appeared amongst the top three groups of goods that were imported into both of these countries. The relatively low share of mineral fuels, lubricants and related goods among imports in several ENP-South countries may, among other factors, be attributed to national supplies/endowments of energy sources, less demand for energy to heat homes, and/or lower motorisation rates: more data are available in the articles on energy and transport.

(% of total imports)
Source: Eurostat (ext_lt_intratrd)
Trade between the EU-28 and ENP-South countries
Looking at the value of the trade flows, apart from Algeria, all of the ENP-South countries (for which recent data are available) recorded trade deficits for their trade in goods with the EU-28 in 2018.
There are generally close links between the EU-28 and many of the ENP-South countries in relation to the international trade of goods. This was particularly true for some of the Maghreb countries: in 2018, the EU-28 accounted for a majority of the total trade (imports plus exports combined) in goods for Tunisia, Morocco and Algeria. By contrast, the EU-28 was relatively less important as a partner for Palestinian international trade and the share of Jordanian exports destined for the EU-28 was also relatively low.
Source data for tables and graphs
Data sources
The data for ENP-South countries are supplied by and under the responsibility of the national statistical authorities of each country on a voluntary basis. The majority of the data presented in this article result from an annual data collection cycle that has been established by Eurostat. No recent data are available from Syria. These statistics are available free-of-charge on Eurostat’s website, together with a range of different indicators covering most socio-economic areas. More data are available from the United Nations’ Comtrade database.
Tables in this article use the following notation:
| Value in italics | data value is forecasted, provisional or estimated and is therefore likely to change; |
| : | not available, confidential or unreliable value; |
| – | not applicable. |
Context
The EU seeks to promote the development of free-trade as an instrument for stimulating economic growth and enhancing competitiveness. International trade statistics are of prime importance for both public sector (international, EU and national decision makers) and private users (in particular, businesses who wish to analyse export market opportunities), as they provide valuable information on developments regarding the exchange of goods between specific geographic areas. These statistics enable the EU to monitor the growth of trade ties with its ENP partners, while they are also used by the European Commission to prepare multilateral and bilateral negotiations for common trade policies.
On 18 November 2015, the High Representative for Foreign Affairs and Security Policy and the European Commission jointly presented a review of the European Neighbourhood Policy (SWD(2015) 500 final) which underlined a new approach for the EU in relation to its eastern and southern neighbours, based on stabilising the region in political, economic, and security-related terms.
In cooperation with its ENP partners, Eurostat has the responsibility ‘to promote and implement the use of European and internationally recognised standards and methodology for the production of statistics necessary for developing and monitoring policy achievements in all policy areas’. Eurostat undertakes the task of coordinating EU efforts to increase the statistical capacity of the ENP countries. Additional information on the policy context of the ENP is provided in the background article Statistical cooperation - European Neighbourhood Policy.
Notes
- ↑ This designation shall not be construed as recognition of a State of Palestine and is without prejudice to the individual positions of the Member States on this issue.
Direct access to
Books
Leaflets
- Basic figures on the European Neighbourhood Policy — South countries — 2019 edition
- Basic figures on the European Neighbourhood Policy — South countries — 2018 edition
- Basic figures on the European Neighbourhood Policy — South countries — 2016 edition
- Basic figures on the European Neighbourhood Policy — South countries — 2015 edition
- International trade in goods for the European neighbourhood policy-South countries — 2018 edition
- Economy and finance (med_ec)
- International trade as a share of gdp (med_ec4)
- International trade by SITC - 1 000 EUR (med_ecet)
- International trade in goods - aggregated data (ext_go_agg)
- International trade in goods - long-term indicators (ext_go_lti)
- Southern European Neighbourhood Policy countries (ENP-South) (med) (ESMS metadata file — med_esms)
