Archive:European Neighbourhood Policy - East - labour market statistics
Data extracted in December 2019.
Planned article update: April 2021.
Highlights
In 2018, the gender gap for employment rates was lower in four of the European Neighbourhood Policy-East countries than in the EU-28; it was higher in Armenia and Georgia.
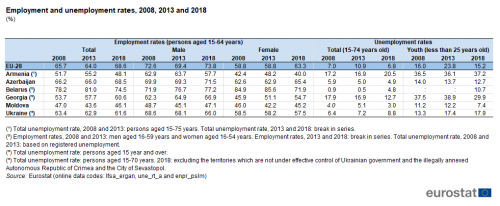
Youth unemployment rates were between 1.8 and 2.6 times as high as the overall unemployment rate in the European Neighbourhood Policy-East countries in 2018.
This article is part of an online publication; it presents information on a range of labour force statistics for the European Union (EU) and the six countries that together form the European Neighbourhood Policy-East (ENP-East) region, namely, Armenia, Azerbaijan, Belarus, Georgia, Moldova and Ukraine. Data shown for Georgia exclude the regions of Abkhazia and South Ossetia over which Georgia does not exercise control and the data shown for Moldova exclude areas over which the government of the Republic of Moldova does not exercise control. The latest data for Ukraine generally exclude the illegally annexed Autonomous Republic of Crimea and the City of Sevastopol and the territories which are not under control of the Ukrainian government (see specific footnotes for precise coverage).
The article presents a range of labour market indicators such as activity rates, employment rates, an analysis of employment by economic activity and professional status, and statistics on unemployment.
Full article
Activity rates
The proportion of the male population aged 15-64 across the EU-28 that was economically active (in other words, in work or actively seeking work and available to start work) stood at 79.2 % in 2018, while the corresponding rate for women was 68.3 %.
With the exception of Moldova (48.9 %), more than 70 % of the male population in each of the ENP-East countries was economically active in 2018. Belarus (82.1 %) recorded an activity rate for men that was above the EU-28 average (see Figure 1).
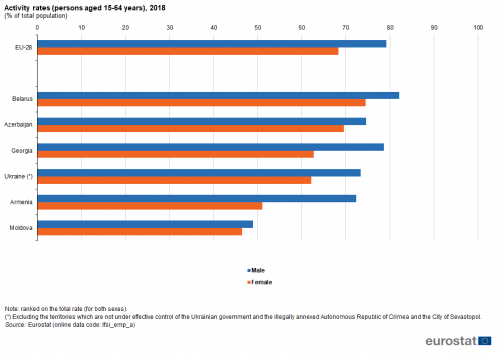
(persons aged 15-64 years), 2018
(% of total population)
Source: Eurostat (lfsi_emp_a)
Activity rates for men were systematically higher than those recorded for women, both for the EU-28 and across all of the ENP-East countries. The gender gap in activity rates ranged from 2.5 percentage points in Moldova to 21.3 percentage points in Armenia; the corresponding gap was 10.9 percentage points in the EU-28.
Activity rates for women for four of the six ENP-East countries were lower than the EU-28 average (67.9 %) in 2018; the two exceptions were Belarus (74.5 %) and Azerbaijan (69.5 %). Moldova recorded the lowest female activity rate among the ENP-East countries (46.4 %) — repeating the pattern observed for men — and was the only ENP-East country where less than half of all men and women aged 15-64 were economically active.
Employment rates
The gender gap for EU-28 employment rates — among people aged 15-64 — decreased during the period 2008-2018. However, the EU-28 male employment rate (73.8 %) remained considerably higher than the corresponding rate for women (63.3 %) in 2018, despite the gap having fallen from 13.8 percentage points in 2008 to 10.5 points by 2018 (see Figure 2).
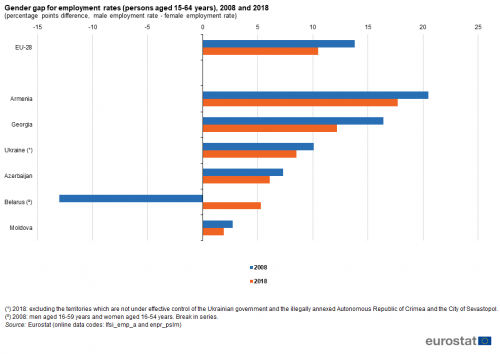
(persons aged 15-64 years), 2008 and 2018
(percentage points difference, male employment rate - female employment rate)
Source: Eurostat (lfsi_emp_a) and (enpr_pslm)
Among the ENP-East countries, the gender gap (between male and female employment rates) in 2018 was lowest in Moldova (1.9 percentage points), while Belarus, Azerbaijan and Ukraine also recorded gaps that were narrower than the EU-28 average. By 2018, the employment gender gap had narrowed to 17.7 percentage points in Armenia and 12.2 percentage points in Georgia but these remained, nevertheless, above the EU-28 average.
The narrowing gender gap in Armenia reflected the employment rate for men falling faster than that for women: the rate for men fell from 62.9 % in 2008 to 57.7 % in 2018 while for women it fell from 42.4 % in 2008 to 40.0 % in 2008. By contrast, in Georgia employment rates for both of the sexes increased between 2008 and 2018, more strongly for women than for men: for women this rate was up from 45.9 % to 54.7 % compared with an increase from 62.3 % to 66.9 % for men. The gender gap also narrowed in all of the other ENP-East countries; it should be noted that the large change in Belarus reflects, at least in part, a major methodological change.
Analysis of employment by economic activity
Table 1 shows an analysis of the structure of employment for 2008 and 2018. Within the EU-28, services accounted for 72.1 % of persons employed (aged 15 or more) in 2018. The share of services within EU-28 employment rose over the most recent 10-year period for which data are available, gaining 4.6 percentage points.
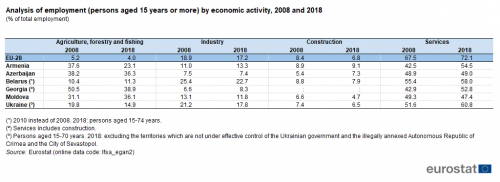
(persons aged 15 years or more) by economic activity, 2008 and 2018
(% of total employment)
Source: Eurostat (lfsa_egan2)
In most of the ENP-East countries, services also accounted for the largest proportion of the workforce, albeit with considerably lower shares than in the EU-28. Indeed, services employed the highest share of total employment among all ENP-East countries. In 2018, services accounted for more than half of all people employed in the economies of Ukraine, Belarus (persons aged 15-74 years), Armenia and Georgia (the share of services includes construction), while the shares in Azerbaijan and Moldova were only slightly less than half.
A relatively high share of the total workforce was employed in agriculture, forestry and fishing in Georgia, Azerbaijan, Moldova and Armenia; this sector was the second largest employer in each of these countries. As such, Belarus and Ukraine were the only ENP-East countries to record a distribution of employment across economic activities that broadly resembled the structure of the workforce in the EU-28 insofar as the largest shares of their respective workforces were employed in services and industry. However, in these two countries the share of the workforce in construction was smaller than that in agriculture, forestry and fishing, whereas the reverse situation was observed for the EU-28.
A comparison of the employment structure in 2008 (2010 for Belarus) with that in 2018 shows a fall in the share in agriculture, forestry and fishing in four of the ENP-East countries with increases recorded in Belarus and Moldova. By contrast, services accounted for an increase in their share of the workforce in most ENP-East countries although this was not the case in Moldova where their share fell between 2008 and 2018 while in Azerbaijan the share was almost unchanged between these two years. There was a rapid restructuring of the labour markets in Armenia, Georgia and Ukraine between 2008 and 2018 (in Ukraine this may in part reflect a change in geographical coverage). For example, in Armenia the proportion of people working in agriculture, forestry and fishing activities fell strongly, while the shares of the Armenian workforce employed in the other activities increased, most strongly in services and to a lesser extent in industry.
Analysis of employment by professional status
Self-employed and family workers occupied more than one out of every seven jobs in the EU-28 in 2018; employees accounted for the majority (84.7 %) of the workforce (see Table 2). The relative share of the self-employed and family workers in total employment in the EU-28 fell 1.3 percentage points between 2008 and 2018, with small increases in 2009 and 2010 more than offset by falls since 2012.
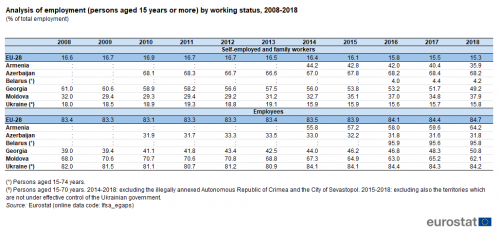
(persons aged 15 years or more) by working status, 2008-2018
(% of total employment)
Source: Eurostat (lfsa_egaps)
The structure of employment by working status was quite different in most of the ENP-East countries. The relative importance of self-employed and family workers was at a high of 68.2 % of the total workforce in Azerbaijan, was close to half (49.2 %) in Georgia and was also over one third in Moldova (37.9 %) and Armenia (35.9 %). These high figures reflect, to some degree, the relative weight of agricultural activities in each of these countries, with work spread across numerous small-scale, family-run farms and cooperatives. By contrast, the structure of employment in Ukraine (the largest of the ENP-East countries) closely resembled that observed in the EU-28, while self-employed and family workers only represented 4.2 % of the workforce in Belarus.
Unemployment rates
In the EU, male, youth and long-term unemployment appear to be more susceptible to cyclical economic changes than overall unemployment. Indeed, social policymakers often face the challenge of remedying these situations by designing ways to increase employment opportunities for various groups of society, those working in particular economic activities, or those living in specific regions.
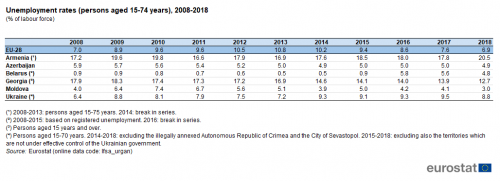
When there is an economic downturn, it usually takes time before the unemployment rate begins to rise. Once the economy starts to pick up again, employers usually remain cautious about hiring new workers and there may again be a lag before unemployment rates start to fall. While the largest contractions in economic activity were recorded in 2009 (as a result of the global financial and economic crisis), it was not uncommon for unemployment rates to increase not just in 2009 but also in 2010. In fact, the EU-28’s unemployment rate rose from a low of 7.0 % in 2008 to peak at 10.8 % in 2013, before falling in each of the next five years to 6.9 % in 2018 (see Table 3).
(persons aged 15-74 years), 2008-2018
(% of labour force)
Source: Eurostat (lfsa_urgan)
Azerbaijan recorded a relatively low unemployment rate and an uninterrupted decline in its unemployment rate over the period 2008-2014, followed by a stable unemployment rate through until 2018. The labour markets of the remaining ENP-East countries for which comparable data are available (data for Belarus from 2008-2015 are not considered comparable as they are based upon registered unemployment, whereas data since 2016 are based on a survey) were more affected by the global financial and economic crisis as their unemployment rates peaked in 2009 or 2010, after which there were signs that the labour market was moving to a more balanced position. After peaking in 2009, the unemployment rate in Georgia fell each year through to 2018, but it remained relatively high. Apart from Azerbaijan and Georgia, the other ENP-East countries experienced a reversal of their falling unemployment rates in 2014 or 2015: Armenia recorded increases in 2014 and again in 2015 and 2018; Ukraine recorded an increase in 2014 and again in 2016 and 2017; Belarus and Moldova recorded increases in 2015 followed by decreases through to 2018 (apart from a break in series in Belarus).
The latest data available are for 2018 and these show that there were considerable differences in annual unemployment rates across the ENP-East countries: rates in Armenia, Georgia and Ukraine were at a higher level than in the EU-28, while elsewhere they were lower, most notably in Moldova where the unemployment rate was less than half that in the EU-28.
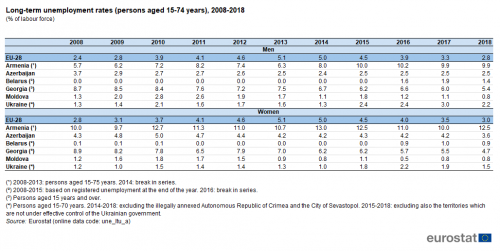
Long-term unemployment is often viewed as a key indicator by policymakers because it provides information in relation to structural weaknesses that may affect social cohesion and, ultimately, economic growth. In 2018, the long-term unemployed in the EU-28 made up 2.8 % of the male labour force and 3.0 % of the female labour force — see Table 4.
(persons aged 15-74 years), 2008-2018
(% of labour force)
Source: Eurostat (une_ltu_a)
In 2018, the long-term unemployment rate was lower than the EU-28 average in several of the ENP-East countries. Particularly low rates — of less than 2.0 % — were recorded in Belarus and Moldova for both men and women and in Ukraine for women (aged 15-70). In all three of these ENP-East countries, the level of long-term unemployment was below the EU-28 average for both men and women, while it was lower for men (but not for women) in Azerbaijan. By contrast, long-term unemployment rates for both men and women were above the EU-28 average in Georgia and Armenia; the share of the labour force that had been unemployed for more than 12 months was particularly high in Armenia where it stood at 9.9 % for men and 12.5 % for women.
Table 5 provides a summary of developments in labour markets with data for 2008, 2013 and 2018. Aside from long-term unemployment rates, another indicator that has received a great deal of attention in recent years is the youth unemployment rate. Just under one quarter (23.8 %) of the EU-28’s labour force aged 15-24 years was without work in 2013, but this had fallen to less than one sixth (15.2 %) by 2018; nevertheless, this remained more than double the average rate (6.8 %) recorded for the whole labour force (among people aged 15-74 years).
(%)
Source: Eurostat (lfsa_ergan), (une_rt_a) and (enpr_pslm)
Across the ENP-East countries, youth unemployment rates were also consistently higher than overall unemployment rates. In relative terms, the difference was least marked in Armenia, where the youth unemployment rate was 37.2 % in 2018, 1.8 times as high as the 20.5 % rate for the whole labour force. In the five other ENP-East countries, the youth unemployment rate was between 2.0 and 2.6 times as high as the overall unemployment rate. The highest youth unemployment rates in the ENP-East countries in 2018 were in Armenia, Georgia and Ukraine, all above the rate in the EU-28 (15.2 %), while the lowest rate was in Moldova (the only rate in single-digits).
Source data for tables and graphs
Data sources
The data for ENP-East countries are supplied by and under the responsibility of the national statistical authorities of each country on a voluntary basis. The data that are presented in this article result from an annual data collection cycle that has been established by Eurostat. These statistics are available free-of-charge on Eurostat’s website, together with a range of different indicators covering most socio-economic areas.
The main source for European labour force statistics is the European Union labour force survey (EU LFS). This household survey is carried out in all EU Member States in accordance with European legislation; it provides figures at least each quarter.
The economically active population (labour force) comprises employed and unemployed persons. The EU LFS defines persons in employment as those aged 15 and over, who, during the reference week, performed some work, even for just one hour per week, for pay, profit or family gain. The labour force also includes people who were not at work but had a job or business from which they were temporarily absent, for example, because of illness, holidays, industrial disputes, education or training.
Employment statistics are frequently reported as employment rates to discount the changing size of countries’ populations over time and to facilitate comparisons between countries of different sizes. These rates are typically published for the working age population, which is generally considered to be those aged 15-64 years, as well as for those aged 20-64 years (to take account of the increasing proportion of young people who remain in education).
Eurostat publishes unemployment statistics based on a definition of unemployment provided by the International Labour Organisation (ILO) for which there are three criteria, namely: being without work, actively seeking work, and being available for work.
Tables in this article use the following notation:
| Value in italics | data value is forecasted, provisional or estimated and is therefore likely to change; |
| : | not available, confidential or unreliable value; |
| – | not applicable. |
Context
Labour market statistics are increasingly used to support policymaking and to provide an opportunity to monitor participation in the labour market. In the aftermath of the global financial and economic crisis, these statistics have been used to monitor the knock-on effects of the crisis on labour markets (which notoriously lag behind fluctuations in economic activity).
In March 2010, the European Commission launched the Europe 2020 strategy for smart, sustainable and inclusive growth. One of the headline targets for the strategy was to raise the employment rate for women and men aged 20-64 years old to 75 % by 2020. EU Member States could set their own national targets in the light of these headline targets and draw up national reform programmes that included the actions they aimed to undertake in order to implement the strategy.
The slow pace of recovery from the financial and economic crisis in the EU and mounting evidence of rising unemployment led the European Commission to make a set of proposals on 18 April 2012 for measures to boost jobs through a dedicated employment package. In December 2012, in the face of high and still rising youth unemployment in several EU Member States, the European Commission proposed a Youth employment package (COM(2012) 727 final). Efforts to reduce youth unemployment continued in 2013 as the European Commission presented a Youth employment initiative (COM(2013) 144 final) designed to reinforce and accelerate measures outlined in the Youth employment package. It aimed to support, in particular, young people not in education, employment or training in regions with a youth unemployment rate above 25 %. There followed another Communication Working together for Europe's young people — A call to action on youth unemployment (COM(2013) 447 final) which was designed to accelerate the implementation of the youth guarantee and provide help to EU Member States and businesses so they could recruit more young people.
In June 2016, the European Commission adopted a Skills Agenda for Europe (COM(2016) 381/2) under the heading ‘Working together to strengthen human capital, employability and competitiveness’. This was intended to ensure that people develop the skills necessary for now and the future, in order to boost employability, competitiveness and growth across the EU.
On 18 November 2015, the High Representative for Foreign Affairs and Security Policy and the European Commission jointly presented a review of the European Neighbourhood Policy (SWD(2015) 500 final) which underlined a new approach for the EU in relation to its eastern and southern neighbours, based on stabilising the region in political, economic, and security-related terms.
In cooperation with its ENP partners, Eurostat has the responsibility ‘to promote and implement the use of European and internationally recognised standards and methodology for the production of statistics, necessary for developing and monitoring policy achievements in all policy areas’. Eurostat undertakes the task of coordinating EU efforts to increase the statistical capacity of the ENP countries. Additional information on the policy context of the ENP is provided here.
Direct access to
- All articles on non-EU countries
- European Neighbourhood Policy countries — statistical overview — online publication
- Statistical cooperation — online publication
Books
Leaflets
- Basic figures on the European Neighbourhood Policy — East countries — 2019 edition
- Basic figures on the European Neighbourhood Policy — East countries — 2018 edition
- Basic figures on the European Neighbourhood Policy — East countries — 2016 edition
- Basic figures on the European Neighbourhood Policy — East countries — 2015 edition
- Basic figures on the European Neighbourhood Policy — East countries — 2014 edition
- International trade for the European Neighbourhood Policy — East countries — 2016 edition
- European Neighbourhood Policy-East countries — Statistics on living conditions — 2015 edition
- European Neighbourhood Policy — East countries — Key economic statistics — 2014 edition
- European Neighbourhood Policy — East countries — Labour market statistics — 2014 edition
- European Neighbourhood Policy — East countries — Youth statistics — 2014 edition
- Population and social conditions (enpr_ps)
- ENP countries: labour market (enpr_pslm)
- LFS main indicators (lfsi)
- Employment and activity - LFS adjusted series (lfsi_emp)
- Unemployment - LFS adjusted series (une)
- LFS series - detailed annual survey results (lfsa)
- Eastern European Neighbourhood Policy countries (ENP-East) (ESMS metadata file — enpr_esms)