Archive:SDG 9 - Industry, innovation and infrastructure (statistical annex)
Build resilient infrastructure, promote inclusive and sustainable industrialisation and foster innovation (statistical annex)
Data extracted in May 2019.
Planned article update: June 2020.
Highlights

This article provides an overview of statistical data on SDG 9 ‘Industry, innovation and infrastructure’ in the European Union (EU). It is based on the set of EU SDG indicators for monitoring of progress towards the UN Sustainable Development Goals (SDGs) in an EU context.
This article is part of a set of statistical articles, which are based on the Eurostat publication ’Sustainable development in the European Union — Monitoring report - 2019 edition’. This report is the third edition of Eurostat’s series of monitoring reports on sustainable development, which provide a quantitative assessment of progress of the EU towards the SDGs in an EU context.
Full article
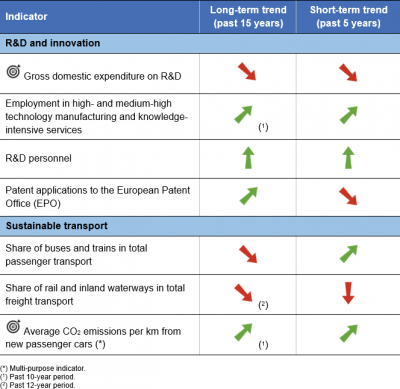
Table 1: Indicators measuring progress towards SDG 9, EU-28

Table 2: Explanation of symbols for indicating progress towards SD objectives and targets


Gross domestic expenditure on R&D

This indicator measures gross domestic expenditure on R&D (GERD) as a percentage of the gross domestic product (GDP) — the R&D intensity. The Frascati Manual defines research and development (R&D) as creative and systematic work undertaken in order to increase the stock of knowledge — including knowledge of humankind, culture and society — and to devise new applications of available knowledge.
.png)
Source: Eurostat (sdg_09_10)
_of_the_gross_domestic_expenditure_on_R%26D_as_a_share_of_GDP,_EU,_2019.png)
Source: Eurostat (sdg_09_10)
.png)
Source: Eurostat (sdg_09_10)
.png)
Source: Eurostat (sdg_09_10)
Employment in high- and medium-high technology manufacturing and knowledge-intensive services

This indicator measures the employment in high- and medium-high technology manufacturing sectors and in knowledge-intensive service sectors as a share of total employment. Data stem from the European Labour Force Survey (LFS). The definition of high- and medium-high technology manufacturing sectors and of knowledge-intensive services is based on a selection of relevant items of the statistical classification of economic activities in the European Community (NACE) Rev. 2 at 2-digit level and is oriented on the ratio of highly qualified working in these areas.
.png)
Source: Eurostat (sdg_09_20)
_of_the_share_of_employment_in_high-and_medium-high_technology_manufacturing_and_knowledge-intensive_services,_EU,_2019.png)
Source: Eurostat (sdg_09_20)
.png)
Source: Eurostat (sdg_09_20)
R&D personnel

This indicator measures the share of R&D personnel broken down by the following institutional sectors: business enterprise, government, higher education and private non-profit. Data are presented in full-time equivalents as a share of the economically active population (the labour force).
.png)
_of_the_share_of_R%26D_personnel,_EU,_2019.png)
Source: Eurostat (sdg_09_30)
.png)
Source: Eurostat (sdg_09_30)
Patent applications to the European Patent Office (EPO)

This indicator measures the requests for protection of an invention directed either directly to the European Patent Office (EPO) or filed under the Patent Cooperation Treaty and designating to the EPO (Euro-PCT), regardless of whether they are granted or not. The data shows the total number of patent applications per country. If one application to the EPO has more than one inventor, the application is divided equally among all of them and subsequently among their countries of residence, thus avoiding double counting. Euro-PCT applications are allocated according to the nationality of the first listed applicant.
.png)
Source: Eurostat (sdg_09_40)
_of_the_patent_applications_to_the_European_Patent_Office_(EPO),_EU,_2019.png)
Source: Eurostat (sdg_09_40)
.png)
Source: Eurostat (sdg_09_40)

This indicator measures the share of buses, including coaches and trolley-buses, and trains in total passenger transport,expressed in passenger-kilometres (pkm). Total passenger transport here includes transport by passenger cars, buses and coaches, and trains, but excludes air and sea transport. All data should be based on movements within national territories, regardless of the nationality of the vehicle. The data collection is voluntary and not fully harmonised at the EU level. Other collective transport modes, such as tram and metro systems, are not included due to the lack of harmonised data.
.png)
Source: Eurostat (sdg_09_50)
_of_the_share_of_buses_and_trains_in_total_passenger_transport,_EU,_2019.png)
Source: Eurostat (sdg_09_50)
.png)
Source: Eurostat (sdg_09_50)

This indicator measures the share of rail and inland waterways in total inland freight transport, expressed in tonne-kilometres (tkm). Inland freight transport modes include road, rail and inland waterways. All data are based on movements on national territory; rail and inland waterways transport are collected based on movements on national territory, regardless of the nationality of the train or vessel. Road transport is redistributed to the national territory on the basis of reported data on the activity of the vehicles registered in each country and modelling the likely journey itinerary by projecting it on the European road network. Neither sea nor air freight transport are currently represented in the indicator.
.png)
Source: Eurostat (sdg_09_60)
_of_the_share_of_rail_and_inland_waterways_in_total_freight_transport,_EU,_2019.png)
Source: Eurostat (sdg_09_60)
.png)
Source: Eurostat (sdg_09_60)
Direct access to
More detailed information on EU SDG indicators for monitoring of progress towards the UN Sustainable Development Goals (SDGs), such as indicator relevance, definitions, methodological notes, background and potential linkages, can be found in the introduction of the publication ’Sustainable development in the European Union — Monitoring report - 2019 edition’.