Archive:Employment statistics
- Data from July 2010, most recent data: Further Eurostat information, Main tables and Database.
Labour market statistics are at the heart of many European Union (EU) policies following the introduction of an employment chapter into the Amsterdam Treaty in 1997. The employment rate, i.e. the proportion of working age population in employment, is a key social indicator.
This article takes a look at recent EU employment statistics, including a split between important socio-economic dimensions: employment statistics show significant differences by gender, age and educational level attained, and there is also considerable variation across Member States and regions within Member States.
Main statistical findings
Highlights
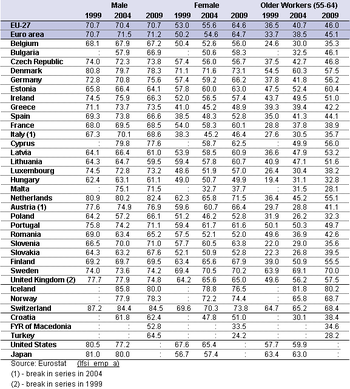
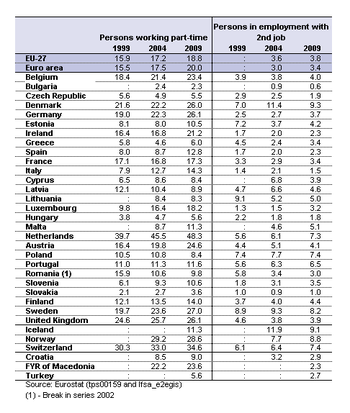
The EU-27 employment rate decreased to 64.6 % in 2009, the rates for men standing at 70.7 % as opposed to 58.6 % for women. The employment rate of older workers reached 46.0 %. The share of part-time employment stood at 18.8 % in 2009, being far more widespread among women (31.0 %) than men (7.4 %). The EU-27 share of employees with temporary contracts decreased to 13.5 %.
Total employment rate and differences by gender, age and educational attainment level
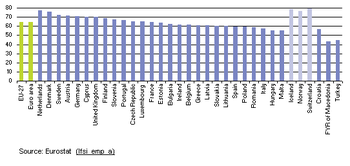
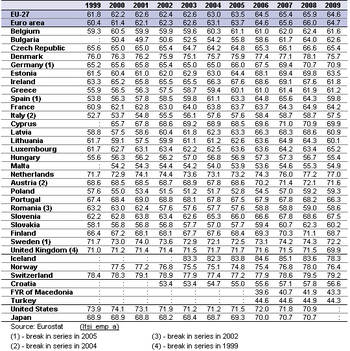
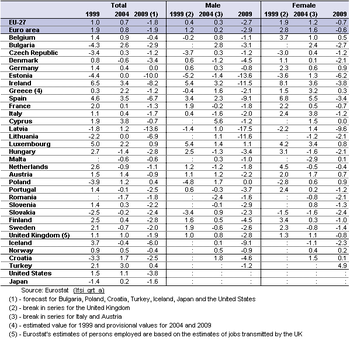
The EU-27 employment rate for persons aged 15 to 64, as measured by the European Union Labour force survey (EU LFS), decreased in 2009 to 64.6 %, down from 65.9 % in 2008. This marked a decrease of 1.3 percentage points, making it the first time the EU-27 employment rate decreased since Eurostat started to estimate this indicator; the EU-27 employment rate stood at 61.2 % 1998 (the first year data are available for this series). The Lisbon European Council in 2000 set a target of 70 % for the employment rate that was to be achieved by 2010. In 2009, employment rates above 70 % were recorded in five of the Member States (Denmark, the Netherlands, Sweden, Austria and Germany). In contrast, employment rates below 60 % were recorded in Malta, Hungary, Italy, Romania, Poland and Spain.
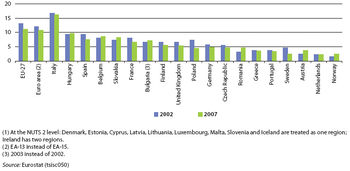
Employment rates vary considerably not only across but also within the Member States according to regional patterns, with a relatively high dispersion (16.3 %) observed across Italy (as measured by the coefficient of variation for regions at the NUTS 2 level). In contrast, there was relatively little divergence in employment rates across the regions of Austria, Greece, Portugal, Sweden or the Netherlands (all below 4 %). The dispersion of regional employment across the whole of the EU-27 declined, as the coefficient of variation fell from 13.2 % to 11.1 % between 2002 and 2007.
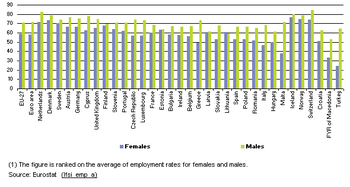
Employment rates are generally lower among women and older workers. In 2009, the employment rate for men reached 70.7 % in the EU-27, as compared with 58.6 % for women. These values may be compared with the data for 2008, when employment rates stood at 72.8 % and 59.1 % respectively. The values recorded in 2009 exceed those of 1998, considerably for women (52.0 % in 1998) and marginally for men (70.3 % in 1998). The Lisbon European Council set a target for the female employment rate of 60 % by 2010. There were 14 Member States which recorded employment rates for women above the 60 % threshold in 2009, with this ratio exceeding 70 % in Denmark, Sweden and the Netherlands.
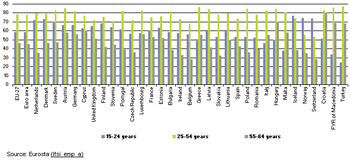
The EU-27 employment rate for older workers (aged between 55 and 64) reached 46.0 % in 2009, compared with 45.6 % in 2008; it was considerably higher than its corresponding rate for 2001 (40.0 %). The Stockholm European Council of 2001 set a target employment rate for older workers of 50 % by 2010. In 2009 there were 11 Member States that had either reached or exceeded this rate. The highest employment rates for older workers were recorded in Sweden (70.0 %) and Estonia (60.4%).
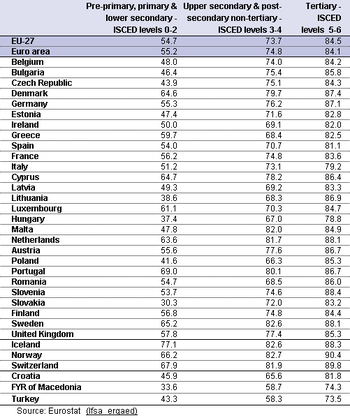
Employment rates vary considerably according to levels of educational attainment. The employment rate of those aged 25 to 64 [1] who had completed a tertiary education was 84.5 % across the EU-27 in 2009, much higher than the rate (54.7 %) for those who had attained a low educational level (primary or lower secondary education). The employment rate of persons with a medium level of educational attainment was 73.7%.
Part-time and fixed-term contracts
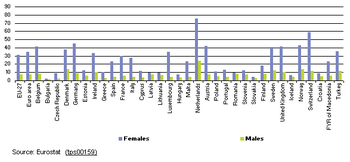
The proportion of the EU-27 workforce reporting that their main job was part-time increased steadily from 15.9 % in 1998 to 18.8 % by 2009. The highest proportion of part-time workers was found in the Netherlands (48.3 % in 2009), followed by Sweden, the United Kingdom and Denmark, where part-time work accounted in each case for over a quarter (26-27 %) of those in employment. In contrast, part-time employment was relatively uncommon in Bulgaria (2.3 % of employment) and Slovakia (3.6 %). The incidence of part-time work differs significantly between men and women. A little less than one third (31.0 %) of women employed in the EU-27 worked part-time in 2009, a much higher proportion than the corresponding figure for men (7.4 %). Three quarters (75.7 %) of all women employed in the Netherlands worked on a part-time basis in 2009, by far the highest rate among the Member States [2].
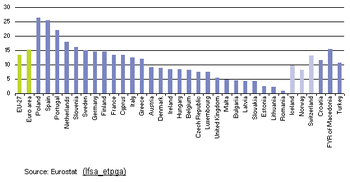
The EU-27 share of employees with a contract of limited duration (fixed-term employment) was 13.5 % in 2009, down from 14.0 % in 2008 and 14.5 % in 2007. In 2009, more than one quarter of employees had a temporary contract in Spain and Poland, and the proportion was more than one fifth in Portugal. Among the remaining Member States, the share of employees working on a contract of limited duration ranged from 18.0 % in the Netherlands, down to just 1.0 % in Romania. The considerable range in the propensity to use limited duration contracts between Member States may, at least to some degree, reflect national practices, the supply and demand of labour, and the ease with which employers can hire or fire.
Data sources and availability
Source statistics
The main data source for labour market statistics is the European Union Labour force survey (EU LFS). Another frequently used source for employment is national accounts. Both sources use similar employment definitions based on international standards from the International Labour Organization (ILO) and the system of national accounts, respectively. A third source for information on employment is enterprise statistics.
The data source for all of the information presented is the EU LFS [3], except for the information on employment growth, which is based on national accounts. National accounts publish employment estimates with no age thresholds, nor socio-demographic breakdowns, which makes data more suitable for an analysis of employment as a labour input to production activities, rather than as a social phenomenon.
The EU LFS is a quarterly sample survey covering the population in private households in the EU, EFTA (except Liechtenstein) and the candidate countries. It provides annual and quarterly results in relation to the labour participation of persons aged 15 and over. The EU LFS collects information on labour force status (all persons being either in employment, unemployed or economically inactive), employment characteristics, working time, job search among the unemployed, levels of education, recent education and training, as well as each individuals' demographic background and family composition.
The EU LFS sample size amounts to approximately 1.5 million individuals each quarter. The quarterly sampling rates vary between 0.2 % and 3.3 % in each country. Eurostat started the collection of LFS micro data in 1983 with one reference quarter per year (usually in the spring). During the period from 1998 to 2005 the survey underwent a transition to a continuous quarterly survey; currently all 27 Member States provide quarterly results.
Definition of employment and main employment characteristics
The economically active population (labour force) comprises employed and unemployed persons.
The EU LFS defines persons in employment as those aged 15 and over, who, during the reference week, performed some work, even for just one hour per week, for pay, profit or family gain. It also includes people who were not at work but had a job or business from which they were temporarily absent, for example, because of illness, holidays, industrial disputes, education or training.
Employment can be measured in terms of number of persons, numbers of jobs, in full-time equivalents or in hours worked. All the estimates presented use the number of persons; employment rates are also built on estimates for numbers of persons. Employment statistics are frequently reported as employment rates to discount the changing size of countries' populations over time and to facilitate comparisons between countries of different sizes. They are typically published for the working age population, which is generally considered to be those aged between 15 and 64 years old within the EU-27 Member States, although the age range of 16 to 64 is used in Italy, Spain, Sweden (only until 2001) and the United Kingdom, as well as in Iceland; this age group (15 to 64 years) is also a standard used by other international statistical organisations.
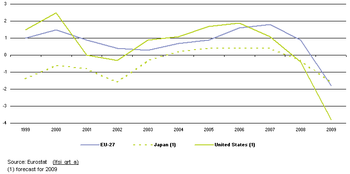
Annual employment growth gives the change, in percentage terms, from one year to another of the total number of persons employed on the economic territory of the country or the geographical area; the data source for employment growth is national accounts.
Some main employment characteristics, as defined by the EU LFS, include:
Employees are defined as those who work for a public or private employer and who receive compensation in the form of wages, salaries, payment by results, or payment in kind; non-conscript members of the armed forces are also included. Self-employed persons work in their own business, farm or professional practice. A self-employed person is considered to be working during the reference week if she/he meets one of the following criteria: works for the purpose of earning profit; spends time on the operation of a business; or is currently establishing a business.
A full-time/part-time distinction in the main job is declared by the respondent, except in Germany, Ireland and the Netherlands, where thresholds for usual hours worked are used.
Indicators for employed persons with a second job refer only to people with more than one job at the same time; people having changed job during the reference week are not counted as having two jobs.
An employee is considered as having a temporary job if employer and employee agree that its end is determined by objective conditions, such as a specific date, the completion of an assignment, or the return of an employee who is temporarily replaced. Typical cases include: people in seasonal employment; people engaged by an agency or employment exchange and hired to a third party to perform a specific task (unless there is a written work contract of unlimited duration); people with specific training contracts.
The dispersion of regional (NUTS level 2) employment rates shows regional differences in employment within countries and between groups of countries. This measure is zero when employment rates across all regions are identical, and will rise as a the differences between regional employment rates increase. The indicator is not applicable for several countries as these comprise only one or a handful of NUTS level 2 regions. However, the employment rates of these countries (regions) are used to compute the indicator at a European level.
Context
Employment statistics can be used for a number of different analyses, including macro-economic (i.e. labour as a production factor), productivity or competitiveness studies. They can alos be used to study a range of social and behavioural aspects related to an individual's employment situation, such as the social integration of minorities, or employment as the source of a households income.
Employment is both a structural indicator and a short-term indicator. As a structural indicator, it may shed light on the structure of labour markets and economic systems, as measured through the balance of labour supply and demand, or the quality of employment. As a short-term indicator, employment follows the business cycle; however, it has limits in this respect, as employment is often referred to as a lagging indicator.
Employment statistics are at the heart of many EU policies. The European employment strategy (EES) was launched at the Luxembourg jobs summit in November 1997 and was revamped in 2005 to align the EU's employment strategy more closely to a set of revised Lisbon objectives. In July 2008, the European Council updated its employment policy guidelines for the period 2008 to 2010; these guidelines included the aims of achieving full employment, improving quality and productivity at work, and strengthening economic, social and territorial cohesion. In March 2010, the European Commission launched the Europe 2020 strategy for smart, sustainable and inclusive growth; this was formally adopted by the European Council in June 2010. The European Council agreed on five headline targets, the first being to raise the employment rate for women and men aged 20 to 64 years old to 75 % by 2020. Member States may set their own national targets in the light of these headline targets and will draw up National Reform Programmes that will include the actions they aim to undertake in order to implement the strategy. The European Commission will further develop and submit to the European Council a range of actions that it proposes to take at an EU level, notably through a series of flagship initiatives. Monitoring mechanisms will also be introduced in order to oversee the implementation of the strategy.
The implementation of the strategy may be achieved, at least in part, through the promotion of flexible working conditions – for example, part-time work or work from home – which are thought to stimulate labour participation. Other initiatives that may encourage more people to enter the labour market include improvements in the availability of childcare facilities, providing more opportunities for lifelong learning, or facilitating job mobility within the EU. Central to this theme is the issue of ’flexicurity’: policies that simultaneously address the flexibility of labour markets, work organisation and labour relations, while taking into account the reconciliation of work and private life, employment security and social protection.
Further Eurostat information
Publications
- Living conditions in Europe – Statistical pocketbook – Data 2003-2006
- The social situation in the European Union 2009
Main tables
- LFS main indicators (t_lfsi)
- Population, activity and inactivity - LFS adjusted series (t_lfsi_act)
- Employment - LFS adjusted series (t_lfsi_emp)
- Employment growth by gender (tsieb050)
- Employment rate by gender (tsiem010)
- Employment rate of older workers by gender (tsiem020)
- Persons employed part-time - Total (tps00159)
- Employees with a contract of limited duration (annual average) (tps00073)
- LFS series - Detailed annual survey results (t_lfsa)
- Employment rate, by highest level of education attained (tsdec430)
- Employed persons with a second job (tps00074)
- Hours worked per week of full-time employment (tps00071)
- Hours worked per week of part-time employment (tps00070)
- Unemployment rates of the population aged 25-64 by level of education (tps00066)
Database
- LFS main indicators (lfsi)
- Population, activity and inactivity - LFS adjusted series (lfsi_act)
- Employment - LFS adjusted series (lfsi_emp)
- Unemployment - LFS adjusted series (une)
- Education and training - LFS adjusted series (lfsi_edu)
- LFS series - Detailed quarterly survey results (from 1998) (lfsq) (Information on NACE Rev.2)
- Total population - LFS series (lfsq_pop)
- Activity and activity rates - LFS series (lfsq_act)
- Employment - LFS series (lfsq_emp)
- Employment rates - LFS series (lfsq_emprt)
- Self employed - LFS series (lfsq_empself)
- Employees - LFS series (lfsq_emppaid)
- Temporary employment - LFS series (lfsq_emptemp)
- Full-time and part-time employment - LFS series (lfsq_empftpt)
- Population in employment having a second job - LFS series (lfsq_emp2job)
- Working time - LFS series (lfsq_wrktime)
- Total unemployment - LFS series (lfsq_unemp)
- Inactivity - LFS series (lfsq_inac)
- LFS series - Detailed annual survey results (lfsa) (Information on NACE Rev.2)
- Total population (lfsa_pop)
- Activity and activity rates - LFS series (lfsa_act)
- Employment - LFS series (lfsa_emp)
- Employment rates - LFS series (lfsa_emprt)
- Self employed - LFS series (lfsa_empself)
- Employees - LFS series (lfsa_emppaid)
- Temporary employment - LFS series (lfsa_emptemp)
- Full-time and part-time employment - LFS series (lfsa_empftpt)
- Population in employment having a second job - LFS series (lfsa_emp2job)
- Population in employment working during asocial hours - LFS series (lfsa_empasoc)
- Working time - LFS series (lfsa_wrktime)
- Total unemployment - LFS series (lfsa_unemp)
- Inactivity - LFS series (lfsa_inac)
- LFS series -Specific topics (lfst)
- Households statistics - LFS series (lfst_hh)
- LFS regional series (lfst_r)
- LFS ad-hoc modules (lfso)
Dedicated Section
Methodology / Metadata
- Labour Force Survey in the EU, Candidate and EFTA countries - Main characteristics of the 2008 national surveys - 2009 Edition
- Quality Report of the European Union Labour Force Survey 2007
External links
See also
Notes
- ↑ For statistics on education level attainment, the age group 25 to 64 is used instead of 15 to 64.
- ↑ Anyone working fewer than 35 hours a week is considered as working part-time in the Netherlands.
- ↑ For Switzerland only spring LFS results (quarter 2) are available and used as annual estimates in the respective tables and charts.
