Archive:Energy, transport and environment - statistics on three closely related domains
- Data extracted in Month YYYY. Most recent data: Further Eurostat information, Main tables and Database. Planned article update: (dd) Month YYYY(, hh:00).
Energy supply and use is of fundamental importance to society. However, energy production and consumption in all sectors of the economy has environmental impacts with transport, being recognised as one of the major sectors affecting the environment. Transportation is accounting for a big share of the energy spent for carrying out and maintaining the range and scope of human activities. The use of the internal combustion engine has facilitated the efficient movement of freight and passengers and prompted the development of a world trade network. Nevertheless, there are environmental aspects linked to transportation and these include atmospheric and noise pollution, land take, resource use and the effects of waste disposal. The largest impacts come from fuel use by transport, but the effects from development and construction of infrastructure and vehicles, as well as the waste from their disposal, add to the environmental costs of transport.
This article provides one of many examples of how transport, energy and the environment are interlinked in everyday human activities. It discusses our societal needs for transport and how they relate to the economy; the demand in energy in order to cover these needs; some impacts of transport and energy demand on the environment; and the policies that the European Union has put in place in order to develop clean energy technologies and a resource-efficient transport system that will benefit the environment and our well-being.
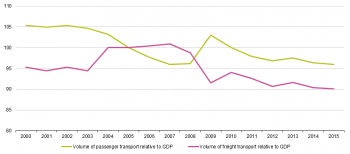
Source: Eurostat (trans_hv_pstra)
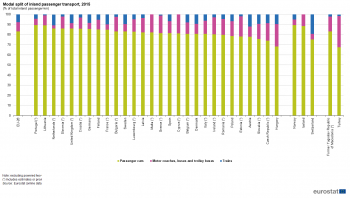
Source: Eurostat (trans_hv_psmod)
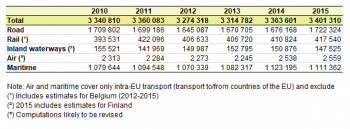
Source: Eurostat (rail_go_typeall) (rail), (iww_go_atygo) (inland waterways), (road_go_ta_tot) (national road transport) (road_go_ca_c) (road cabotage transport) and Eurostat computations (international road transport, air and maritime transport)
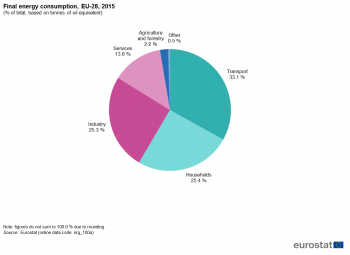
Source: Eurostat (nrg_100a)
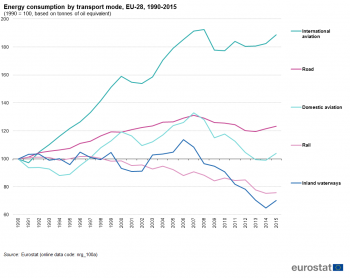
Source: Eurostat (nrg_100a)
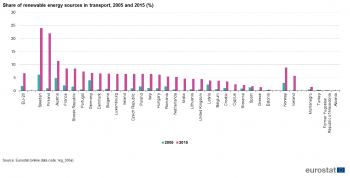
Source: Eurostat (nrg_ind_335a)
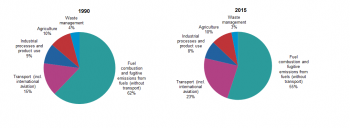
Source: Eurostat (env_air_gge), European Environment Agency
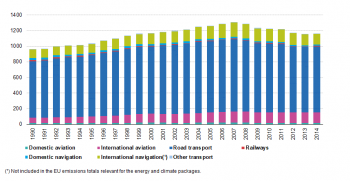
Source: EEA, republished by Eurostat (env_air_gge)
Main statistical findings
Eurostat's energy statistics present energy consumption by economic activity and by energy source, and shows that transportation consumes one third of the total final energy consumption in EU-28. All modes of transport need energy, however the energy efficiency of each mode of passenger and freight transport and their resulting environmental impact differ significantly.
Transport statistics allow for an in depth analysis of the volume and the share of passenger transport, be it by individual cars, trains, buses, ships and airplanes, as well as for transport of freight by roads, trains or by ships on the sea and inland waterways.
Environmental statistics and accounts present the impact on the environment caused by economic activities and households, e.g. emission of greenhouse gas (GHG) from energy generation in power plants, or emission of air pollutants from vehicles with internal combustion engines.
Improved efficiency in energy generation and in energy use for transportation as well as a shift to more environment-friendly transport modes can lead to a reduction of the current pressures on the environment. Energy, transport and environment statistics combined and analysed, together with socio-economic indicators, are important elements for enabling policy makers to take decisions for sustainable, forward-looking policies. Such decisions may result in significant financial investments with long lasting impacts for the current and future generations.
Transport and the economy
The driving force for transport activities is our economy; transport is fundamental for a functioning and growing economy and its demand is high in urban, industrial and other densely populated areas.
Figure 1 shows the indexed volumes of passenger transport (in passenger-kilometres) and freight transport (in tonne-kilometres) in relation to GDP (in chain-linked volumes, at 2005 exchange rates). The charts present the link between economic development and transport needs and can answer the question if economic growth is possible without an increase in transport demands.
The extent to which transport demand for passengers and goods is coupled with GDP decreased between 2000 and 2015. The economic crisis in 2008 – 2009 had a strong negative impact on freight transport, however, passenger transport did not decline but continued to increase steadily during that period and the years after. The charts suggest that passenger transport seems to be less sensitive to economic changes than freight transport.
From 2010 – 2015 both, passenger and freight transport, showed a decreasing development in transport demand per unit of GDP: The index for passenger transport fell from 100 % to 96 % and for freight transport from 94 % to 90.1 %. This recent development can be interpreted as an absolute decoupling of transport demand from economic growth.
However, transport activities have environmental and societal impacts. Local greenhouse gas (GHG) emissions from transportation contribute to global climate change. Air pollution from vehicles with internal combustion engines harm human health and biota in cities and urban areas, and affect building surfaces. Traffic noise has negative impacts on people living close to busy streets, motorways, rail tracks and airports, and growing transport volumes cause congestion, and as result of traffic accidents, fatalities or injuries.
Subtitle 2
Data sources and availability
<description of data sources, survey and data availability (completeness, recency) and limitations>
Context
<context of data collection and statistical results: policy background, uses of data, …>
See also
- Name of related Statistics Explained article
- Name of related online publication in Statistics Explained (online publication)
- Name of related Statistics in focus article in Statistics Explained
- Subtitle of Statistics in focus article=PDF main title - Statistics in focus x/YYYY
Further Eurostat information
Data visualisation
- Regional Statistics Illustrated - select statistical domain 'xxx' (= Agriculture, Economy, Education, Health, Information society, Labour market, Population, Science and technology, Tourism or Transport) (top right)
Publications
Publications in Statistics Explained (either online publications or Statistics in focus) should be in 'See also' above
Main tables
- Title(s) of second level folder (if any)
- Title(s) of third level folder (if any)
Database
- Title(s) of second level folder (if any)
- Title(s) of third level folder (if any)
Dedicated section
Methodology / Metadata
<link to ESMS file, methodological publications, survey manuals, etc.>
- Crime and criminal justice (ESMS metadata file — crim_esms)
- Title of the publication
Source data for tables, figures and maps (MS Excel)
Other information
<Regulations and other legal texts, communications from the Commission, administrative notes, Policy documents, …>
- Regulation (EC) No 1737/2005 (generating url [http://eur-lex.europa.eu/LexUriServ/LexUriServ.do?uri=CELEX:32005R1737:EN:NOT Regulation (EC) No 1737/2005]) of DD Month YYYY on ...
- Directive 2003/86/EC (generating url [http://eur-lex.europa.eu/LexUriServ/LexUriServ.do?uri=CELEX:32003L0086:EN:NOT Directive 2003/86/EC]) of DD Month YYYY on ...
- Commission Decision 2003/86/EC (generating url [http://eur-lex.europa.eu/LexUriServ/LexUriServ.do?uri=CELEX:32003D0086:EN:NOT Commission Decision 2003/86/EC]) of DD Month YYYY on ...
<For other documents such as Commission Proposals or Reports, see EUR-Lex search by natural number>
<For linking to database table, otherwise remove: {{{title}}} ({{{code}}})>
External links
Notes
[[Category:<Subtheme category name(s)>|Name of the statistical article]] [[Category:<Statistical article>|Name of the statistical article]]
Delete [[Category:Model|]] below (and this line as well) before saving!

