Archive:SDG 1 - No poverty (statistical annex)
End poverty in all its forms everywhere (statistical annex)
- Data from early October 2018. Most recent data: Further Eurostat information, Main tables. Planned article update: November 2018.
This article provides an overview of statistical data on SDG 1 ‘no poverty’ in the European Union (EU). It is based on the set of EU SDG indicators for monitoring of progress towards the UN Sustainable Development Goals (SDGs) in an EU context.
This article is part of a set of statistical articles, which are based on the Eurostat publication ’ Sustainable development in the European Union — Monitoring report on progress towards the SDGs in an EU context (2017 edition)’. This report is the first edition of Eurostat’s future series of monitoring reports on sustainable development, which provide a quantitative assessment of progress of the EU towards the SDGs in an EU context.
People at risk of poverty or social exclusion
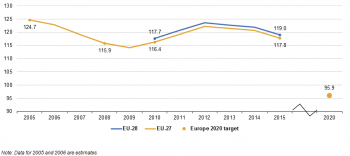
The number of people at risk of poverty or social exclusion has fallen since 2005. However, a strong increase between 2009 and 2012 has put the EU considerably off its path towards the target of lifting 20 million people out of this situation. Since 2012, the number of people at risk has fallen continuously.
(million people)
Source: Eurostat online data code (sdg_01_10)
(% of population)
Source: Eurostat online data code (sdg_01_10)
The Europe 2020 strategy promotes social inclusion, in particular through the reduction of poverty, by aiming to lift at least 20 million people out of the risk of poverty and social exclusion compared with 2008 levels [1]. This indicator corresponds to the number of people who are in at least one of the following situations: (1) at risk of poverty or (2) severely materially deprived or (3) living in households with very low work intensity. People are only counted once even if they are present in several sub-indicators. For more detailed information on the methodology behind the three sub-indicators please see the sections further below. Data presented in this section stem from the EU Statistics on Income and Living Conditions (EU-SILC).
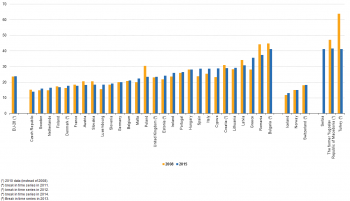
In 2015, 119.0 million people, or 23.8 % of the EU population, were at risk of poverty or social exclusion, meaning almost a quarter of the EU population experienced at least one of the three forms of poverty or social exclusion covered by this indicator.
The development of risk of poverty or social exclusion in the EU over the past decade has been marked by two turning points: in 2009, when the number of people at risk started to rise because of the delayed social effects of the economic crisis and in 2012, when this trend reversed [2]. By 2015, the number of people at risk had fallen almost to 2010 levels, reaching 119.0 million people. Despite this recent decline, the gap to the Europe 2020 target has widened to about 23 million people compared with 2008, putting the EU considerably off its target path.
The overall rate of people at risk of poverty or social exclusion masks considerable differences between different groups of people. It is therefore necessary to look at breakdowns by group to identify those most at risk:
- By sex: In 2015, women were more likely to experience poverty or social exclusion than men by 1.4 percentage points (the rate for women was 24.5 % while for men it was 23.1 %). Women were worse off in all EU countries except for Poland and Spain, where men were at higher risk of poverty or social exclusion, and Finland, where the risk was equal for men and for women. In 2015, the gender gaps were highest in the Baltic States of Latvia (5.5 percentage points) and Estonia (3.8 percentage points) as well as in Bulgaria (3.5 percentage points), the Czech Republic and Slovenia (3.3 percentage points each).
- By age group: Young people aged 18 to 24 were the age group at the highest risk of poverty or social exclusion: Almost a third of the young people were at risk of poverty or social exclusion in 2015 (31.8 % of women and 30.8 % of men). Moreover, the situation of young people aged 18 to 24 has deteriorated the most since 2010 compared to other age groups. Although their risk of poverty or social exclusion had been falling until 2009, it climbed back up in the following years. The year 2015 showed a slight reduction compared to 2014. Children had the second highest risk of poverty or social exclusion, with 27.1 % at risk in 2015. In contrast, older people aged 65 or over had the lowest rate of poverty or social exclusion, at 17.4 % in 2015 [3]. Rates for this group showed a steady decline between 2011 and 2015. As a result, the age gap between younger and older people widened during this period and has remained stable after that.
- By degree of urbanisation: On average, EU citizens in rural areas were slightly more likely to live at risk of poverty or social exclusion than those in urban areas (25.5 % in rural areas compared with 24.0 % in urban areas) in 2015. Those living in towns or suburbs were the least likely to be at risk (22.1 %). However, the figures vary greatly between Member States. In 15 Member States, people living in rural areas were at the highest risk of being poor or socially excluded. The countries with the highest risk of poverty or social exclusion in rural areas compared with urban areas are Romania (26.7 percentage points higher) and Bulgaria (23.1 percentage points higher) [4]. In other countries, such as Denmark, Austria, Belgium, the United Kingdom and Germany, the opposite is true: a clearly larger share of urban residents live in poverty or social exclusion compared with residents in rural areas or towns. There are also countries, such as the Czech Republic, Finland and Slovenia, where the poverty rates in urban, rural or suburban areas differ only slightly.
- By household type: Among households of single people with one or more dependent children, 48.1 % were at risk at risk of poverty or social exclusion in 2015. This was just over twice the average rate and higher than for other household types. However, this group also experienced the largest decline in the risk-of-poverty rate since 2010 when the rate was 52.1 %. In general, households with only one adult — both with children and without — and households with three or more children are at a higher risk of poverty or social exclusion. In single-adult households there is no partner to help cushion temporary disruptions such as unemployment or sickness. Single parents also face the challenge of being both the primary breadwinner and caregiver for the family. The group with the lowest poverty rate in 2015 was that of households with two adults where at least one person was aged 65 years or over.
By educational attainment: In 2015, 34.3 % of people with at most lower secondary educational attainment were at risk of poverty or social exclusion. In comparison, only 11.7 % with tertiary education were in the same situation. This shows that the least educated people were almost three times more likely to be at risk than those with the highest education levels. This is also reflected in the data on employment which shows that the likelihood of being employed rises in line with educational level (see the respective analysis in chapter 8 ‘Decent work and economic growth’).
- By country of birth: People living in the EU but born in a non-EU country had a 40.3 % risk of living in poverty or social exclusion in 2015. The risk was lower for people born in an EU-country other than the one they were living in, at 25.0 %. Among the people whose country of residence corresponded to their country of birth, 21.8 % were at risk of poverty or social exclusion. Thus, people born outside the EU were almost twice as likely to be at risk of poverty or social exclusion compared with those born in the same country. Compared to migration from a country from outside the EU, migration within the EU bears a far smaller risk of poverty or social exclusion.
- By disability status: In 2015, people with disabilities were at higher risk of poverty than people with no disabilities in the EU [5]. In that year, 30.2 % of the population aged 16 or more and who had a disability were at risk of poverty or social exclusion, compared with 20.8 % of those with no disability.
- Children, by educational attainment level of parents: In 2015, 65.6 % of children (aged 0-17) of parents with at most pre-primary and lower secondary education were at risk of poverty or social exclusion. Young children (aged 0-6) of such parents were at an even higher risk, at 68.2 %. This was over six times higher than for children of parents with first or second stage tertiary education. Moreover, between 2010 and 2015 the increase in the risk of poverty or social exclusion was particularly high for children of parents with the lowest educational attainment, while the increase was minimal for the other children. Thus, education, which is a strong determinant of poverty or social exclusion for adults, also influences whether children live in poverty or social exclusion. Children who live in such circumstances are more likely to attain a lower level and quality of education (leaving school early) than those who do not live in poverty or social exclusion. Therefore, they are also at higher risk of poverty in their adult life.
Income poverty was the most widespread form of poverty in 2015. There were 86.8 million people (17.3 % of the EU population) living at risk of poverty after social transfers in that year. This was more than twice as many as those with severe material deprivation (40.4 million people or 8.1 % of EU citizens) and very low work intensity (39.8 million people or 10.7 % of EU-citizens aged 0-59) [6]. Almost 39 million people, or nearly one-third (32.5 %) of all people at risk of poverty or social exclusion, were affected by more than one dimension of poverty over the same period. Out of those, 9.2 million people, or one in twelve of those at risk of poverty or social exclusion (7.7 %), were affected by all three forms.
The country-specific recommendations under the European Semester aim to encourage fiscal and structural reforms (including social policies) that contribute to reducing both poverty and inequality.
The share of people at risk of poverty or social exclusion varied across the EU in 2015, ranging from 14.0 % to 41.3 %. In Bulgaria, Greece, Cyprus and Hungary, the largest group of people at risk of poverty or social exclusion were those affected by severe material deprivation without experiencing income poverty or living in a household with very low work intensity. In all other Member States, income poverty was the most prevalent form of poverty in 2015.
People at risk of income poverty after social transfers
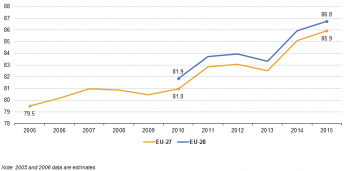
The number of people at risk of income poverty after social transfers has been growing since 2005. This increase has intensified since 2010.
Source: Eurostat online data code (sdg_01_20)
(% of population)
Source: Eurostat online data code (sdg_01_20)
People at risk-of-poverty are persons with an equivalised disposable income below the risk-of-poverty threshold, which is set at 60 % of the national median equivalised disposable income (after social transfers).
In 2015, 86.8 million people or 17.3 % of the EU population had an equivalised disposable income below the national poverty threshold. This represents an increase compared with 2010, when 81.9 million people fell below this line. It is important to note that the at-risk-of-poverty rate is a relative measure of poverty. Relative poverty occurs when someone’s standard of living and income are much worse than the general standard in the country or region they live in. They may struggle to live a normal life and to participate in ordinary economic, social and cultural activities. Relative poverty varies greatly between Member States. The threshold also varies over time and in a number of Member States it has fallen in recent years in the aftermath of the financial and economic crisis. Data presented in this section stem from the EU Statistics on Income and Living Conditions (EU-SILC).
Compared with the main economies worldwide, the share of people suffering from income poverty in the EU was low (17.3 %), despite increases since 2005. In most non-EU OECD countries, this value was roughly between 20 % and 25 %. Commonwealth countries in the OECD outside the EU as well as Asian OECD countries including Russia were at the bottom end of this range, with 19.1 % in Korea, 19.3 % in Canada, 19.6 % in New Zealand, and 20.5 % in Australia as well as, 21.9 % in Japan and Russia. Income poverty was even more prevalent in the Latin American OECD countries Chile (23.3 %) and Mexico (23.7 %) as well as the Unites States (23.6 %), Turkey (25.1 %) and Israel (25.8 %) [7].
The European Commission is working towards a European pillar of social rights, which will enable upwards convergence as regards social and labour market performances, thereby contributing to reducing poverty and inequalities.
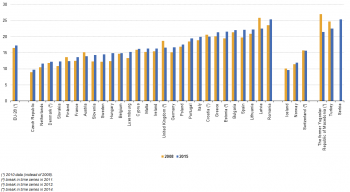
The share of people at risk of income poverty varied moderately across the EU, ranging from 9.7 % to 25.4 % in 2015. Between 2008 and 2015, most countries experienced growth in the number of people below the income poverty line, regardless of whether they had low or high levels to begin with.
To reduce the risk of poverty or social exclusion of their populations, governments provide social security in the form of [[Glossary:Social transfers|social transfers], such as unemployment benefits and sickness and invalidity benefits, among others. The effectiveness of monetary social provision can be assessed by comparing the at-risk-of-poverty rate before and after social transfers [8]. In the EU, social transfers reduced the share of people at risk of poverty by 8.8 percentage points in 2015, from 26.1 % to 17.3 %. However, the extent to which Member States were able to reduce this rate through social transfers varied between 19.9 and 3.9 percentage points.
Severely materially deprived people
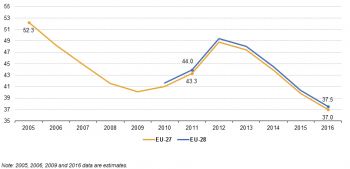
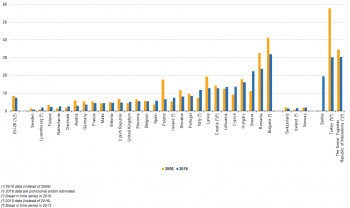
The number of people affected by severe material deprivation has fallen over the long term as well as the short term.
(million people)
Source: Eurostat online data code (sdg_01_30)
(% of population)
Source: Eurostat online data code (sdg_01_30)
Severely materially deprived people have living conditions that are severely constrained by a lack of resources, cannot afford at least four out of these nine deprivation items: i) to pay rent or utility bills, ii) to keep their home adequately warm, iii) face unexpected expenses, iv) to eat meat, fish or a protein equivalent every second day, v) a week-long holiday away from home, vi) a car, vii) a washing machine, viii) a colour TV, or ix) a telephone. Data presented in this section stem from the EU Statistics on Income and Living Conditions (EU-SILC).
In 2016, 37.5 million people in the EU, or 7.5 % of the total EU population, were living in conditions severely constrained by a lack of resources. It is worth noting that out of the three sub-indicators making up the ‘risk of poverty or social exclusion’ indicator presented above, severe material deprivation has shown the strongest fluctuations over time, with a decline of almost 12 million people over the past four years. It has thus been the main driver behind the recent overall reduction in people at risk of poverty or social exclusion in the EU.
The share of the population suffering from severe material deprivation varied considerably across EU countries, ranging from less than 1 % to 31.9 %. A comparison with the risk-of-poverty rate (see previous section) reveals that in a few Member States the share of people living in poor conditions was much higher than the prevalence of income poverty. This shows that the structure of poverty is different across the Member States. For example, in Bulgaria the proportion of people living in severely deprived conditions was about 1.4 times as high as the share living in income poverty. In contrast, in a few countries with higher living standards, such as Spain, Sweden, Estonia and Luxembourg, the income poverty rate clearly exceeded the rate of people suffering from severe material deprivation.
The European Social Fund (ESF) is Europe’s main tool for promoting employment and social inclusion — helping people to get a job (or a better job), integrating disadvantaged people into society and ensuring fairer life opportunities for all.
People living in households with very low work intensity
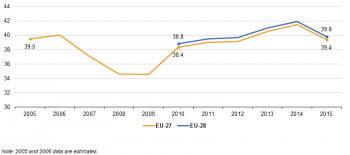
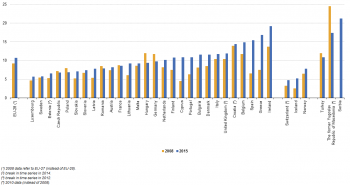
The number of people affected by very low work intensity in the EU-27 has slightly decreased over the long term since 2005. However, a small increase was recorded over the short term due to the economic crisis.
(million people aged less than 60)
Source: Eurostat online data code (sdg_01_40)
(% of population aged less than 60)
Source: Eurostat online data code (sdg_01_40)
In 2015, 10.7 % (or 39.8 million) of the EU population aged 0 to 59 were living in households with very low work intensity. This means the working-age members of the household worked no longer than 20 % of their potential working time during the previous year. Data presented in this section stem from the EU Statistics on Income and Living Conditions (EU-SILC).
Even though the share of the population aged 0 to 59 who were living in households with very low work intensity increased by only 1.5 percentage points across the EU between 2008 and 2015, the share changed considerably in some Member States, as shown in Figure 1.8 below.
The incidence of very low work intensity varied across the EU in 2015, ranging from 5.7 % to 19.2 %. In some countries, low work intensity levels do not seem to correspond to the extent of the other forms of poverty or social exclusion. Belgium, the United Kingdom and Denmark, for example, had a higher-than-average proportion of households with very low work intensity (14.9 %, 11.9 % and 11.6 % respectively), despite their risk of income poverty and severe material deprivation being below the EU average. In contrast, Latvia and Romania were among the Member States with the highest proportion of their population at risk of income poverty in 2015 while having some of the lowest shares of households with very low work intensity (7.8 % and 7.9 %, respectively) [9].
Housing cost overburden rate
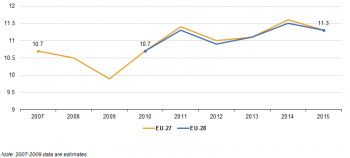
The percentage of the EU population spending more than 40 % of income on housing has increased since 2010.
(% of population)
Source: Eurostat online data code (sdg_01_50)
(% of population)
Source: Eurostat online data code (sdg_01_50)
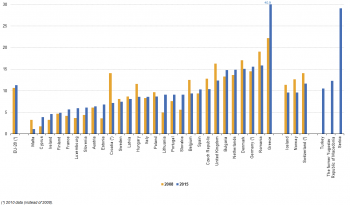
Housing affordability is measured by the housing cost overburden rate, which shows the share of population living in households that spend 40 % or more of the household disposable income on housing. Housing costs include rental or mortgage interest payments but also the cost of utilities such as water, electricity, gas or heating. The data presented in this section stem from the EU Statistics on Income and Living Conditions (EU-SILC).
The proportion of the population whose housing costs exceeded 40 % of their equivalised disposable income was highest for tenants with market price rents (27.0 %) and lowest for persons in owner-occupied dwellings with mortgage or loan (6.7 %).
People living below the poverty threshold (with an income below 60 % of median equivalised income) were more than seven times more likely to suffer from housing cost overburden. Some 39.2 % of poor people spent more than 40 % of their disposable income on housing, compared to 5.4 % of people above the poverty threshold.
Housing cost overburden rates varied considerably across the EU in 2015, mainly due to the exceptionally high rate for Greece (40.9 %). The average national figures shown in Figure 1.10, however, mask considerable in-country variations between people who are at risk of poverty and those who are not. In Malta, total housing cost overburden rate was at 1.1 %, whereas the rate for poor people was only 3.5 percentage points higher. In Cyprus, the difference amounted to 9.2 percentage points. All other countries showed differences above 10 percentage points. In Denmark, Germany and the Netherlands, total housing cost overburden was ranging around 15 %, whereas more than 50 % of poor people were affected by housing cost overburden. In Greece, 95.8 % of poor people faced housing cost overburden in 2015.
Population living in a dwelling with a leaking roof, damp walls, floors or foundation, or rot in window frames of floor
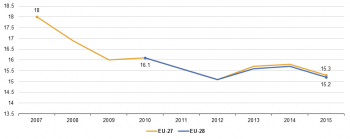
The share of EU population experiencing basic deficits in their housing conditions has declined since 2010.
(% of population)
Source: Eurostat online data code (sdg_01_60)
(% of population)
Source: Eurostat online data code (sdg_01_60)
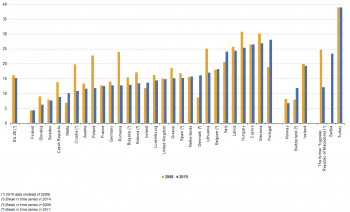
The indicator captures the share of the population experiencing at least one of the following basic deficits in their housing condition: a leaking roof, damp walls, floors or foundation, or rot in window frames or floor. The data presented in this section stem from the EU Statistics on Income and Living Conditions (EU-SILC).
In 2015, almost one in seven Europeans (15.2 %) experienced at least one of the housing deficits covered by this indicator. This was 0.9 percentage points lower than the share of the population reporting such deficiency in living conditions in 2010. At the EU level, the problem of ‘leaking roof or damp walls, floors or foundation, or rot in window frames of floor’ largely exceeded other forms of housing deprivation measured under the housing dimension in EU-SILC such as ‘darkness of the dwelling’ (5.5 %), lack of basic sanitary facilities (lack of a bath or shower and indoor flushing toilet) (2.4 %) [10].
Those at risk of monetary poverty tended to be more exposed to housing deficiencies, with the incidence of low housing quality being almost two times higher among people living below the poverty threshold (with an income below 60 % of median equivalised income), at 24.0 %, compared to 13.4 % for people above the poverty threshold. Looking at different household types, poor housing conditions were especially pronounced among single women with dependent children (23.1 %) and three or more adults with dependent children (19.1 %). These population groups also faced some of the highest risk of poverty or social exclusion and thus tended to suffer from cumulative disadvantages.
The occurrence of housing deficits according to the reasons analysed here varies considerably between Member States, ranging from 4.4 % to 28.1 % of the population in 2015. Some southern and eastern European countries with relatively high poverty levels reported the highest incidence of housing deficiencies in 2015. Portugal led the ranking, with one in four Portuguese households suffering from housing deficits, compared to only one in 25 Finnish households.
Progress has been most remarkable in Romania, which managed to almost halve the share of households affected by basic housing deficits compared to 2008 levels. In contrast, several Member States with relatively low poverty levels (see people at risk of poverty or social exclusion above) experienced increases in their housing deprivation rate in the same period.
Context
<context of data collection and statistical results: policy background, uses of data, …>
See also
- Name of related Statistics Explained article
- Name of related online publication in Statistics Explained (online publication)
- Name of related Statistics in focus article in Statistics Explained
- Subtitle of Statistics in focus article=PDF main title - Statistics in focus x/YYYY
Further Eurostat information
Data visualisation
- Regional Statistics Illustrated - select statistical domain 'xxx' (= Agriculture, Economy, Education, Health, Information society, Labour market, Population, Science and technology, Tourism or Transport) (top right)
Publications
Publications in Statistics Explained (either online publications or Statistics in focus) should be in 'See also' above
Main tables
- Title(s) of second level folder (if any)
- Title(s) of third level folder (if any)
Database
- Title(s) of second level folder (if any)
- Title(s) of third level folder (if any)
Dedicated section
Methodology / Metadata
More detailed information on EU SDG indicators for monitoring of progress towards the UN Sustainable Development Goals (SDGs), such as indicator relevance, definitions, methodological notes, background and potential linkages, can be found on page xx-xx of the publication ’ Sustainable development in the European Union — Monitoring report on progress towards the SDGs in an EU context (2017 edition)’.
- Crime and criminal justice (ESMS metadata file — crim_esms)
- Title of the publication
Source data for tables, figures and maps (MS Excel)
Other information
<Regulations and other legal texts, communications from the Commission, administrative notes, Policy documents, …>
- Regulation (EC) No 1737/2005 (generating url [http://eur-lex.europa.eu/LexUriServ/LexUriServ.do?uri=CELEX:32005R1737:EN:NOT Regulation (EC) No 1737/2005]) of DD Month YYYY on ...
- Directive 2003/86/EC (generating url [http://eur-lex.europa.eu/LexUriServ/LexUriServ.do?uri=CELEX:32003L0086:EN:NOT Directive 2003/86/EC]) of DD Month YYYY on ...
- Commission Decision 2003/86/EC (generating url [http://eur-lex.europa.eu/LexUriServ/LexUriServ.do?uri=CELEX:32003D0086:EN:NOT Commission Decision 2003/86/EC]) of DD Month YYYY on ...
<For other documents such as Commission Proposals or Reports, see EUR-Lex search by natural number>
<For linking to database table, otherwise remove: {{{title}}} ({{{code}}})>
External links
Notes
- ↑ Due to the structure of the survey on which most of the key social data is based (EU Statistics on Income and Living Conditions), a large part of the main social indicators available in 2010, when the Europe 2020 strategy was adopted, referred to 2008 as the most recent year of data available. This is why 2008 data for the EU-27 are used as the baseline year for monitoring progress towards the Europe 2020 strategy's poverty target. For the same reason, the country breakdowns in this chapter use the year 2008 for comparison. Since 115.9 million people were at risk of poverty or social exclusion in the EU-27 in 2008, the target value to be reached is 95.9 million by 2020.
- ↑ For the development following 2009, see European Commission Directorate General for Economic and Financial Affairs (2014), Poverty developments in the EU after the crisis: a look at main drivers, Economic Brief, Issue 31 May 2014.
- ↑ Reasons for this could include that many elderly people receive regular pensions, have accrued some wealth, and have often paid off their housing situation.
- ↑ The same holds true for Malta, but the data is of low reliability.
- ↑ In EU-SILC, disability is approximated according to the concept of global activity limitation, which is defined as a ‘limitation in activities people usually do because of health problems for at least the past six months’. This is considered to be an adequate proxy for disability, both by the scientific community and disabled persons' organisations.
- ↑ The dimension ‘very low work intensity’ is only measured among those aged 0–59. Therefore, people over the age of 59 are considered at risk of poverty or social exclusion only if the criteria of one of the two dimensions ‘income poverty‘ or ‘severe material deprivation’ are met.
- ↑ These values are taken from the OECD dataset on Income Distribution and Poverty and correspond to the newest data available in this set (2014: Australia, Canada, New Zealand, 2015: Israel, Korea, Mexico, Turkey, 2015: Chile and the United States, 2012: Japan, 2011: Russia). All data except for that of Russia is based on the OECD’s new income definition, which includes the value of goods produced for own consumption as a component of self-employed income, an element not considered in the EU SILC income definition.
- ↑ Pensions, such as old-age and survivors’ (widows' and widowers') benefits, are counted as income (before social transfers) and not as social transfers.
- ↑ This can be the case for a number of reasons, such as a high amount of social transfers in one country or a generally low income level in another.
- ↑ Eurostat, Statistics Explained, Housing conditions (Data extracted in February 2017).
[[Category:<Subtheme category name(s)>|SDG 1 - No poverty (statistical annex)]] [[Category:<Statistical article>|SDG 1 - No poverty (statistical annex)]]