Archive:Aquaculture statistics
- Data extracted in August 2017. Most recent data: Further Eurostat information, Main tables and Database. Planned article update: October2018.
Aquaculture is the farming of fish under controlled conditions; it is an alternative to catching wild fish. This article gives an overview of the aquaculture sector in the European Union (EU), using data on the volume and value of production by country and by species.

(% of total fisheries production, tonnes live weight)
Source: Eurostat (fish_aq2a) and (fish_ca_main)

(tonnes of live weight and % of total fishery production)
Source: Eurostat (fish_aq2a) and (fish_ca_main)

(%)
Source: Eurostat (lfsa_egdn2) ad hoc extraction

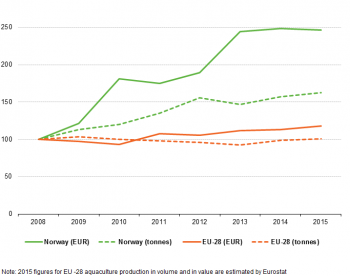
(index 2008=100)
Source: Eurostat (fish_aq2a)

(tonnes live weight)
Source: Eurostat (fish_aq2a)

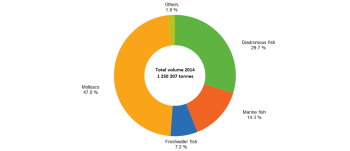
(% of total aquaculture production, tonnes live weight)
Source: Eurostat (fish_aq2a)

(% of total aquaculture production value, EUR)
Source: Eurostat (fish_aq2a)

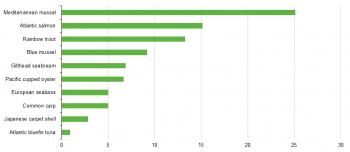
(% of total aquaculture production, tonnes live weight)
Source: Eurostat (fish_aq2a)

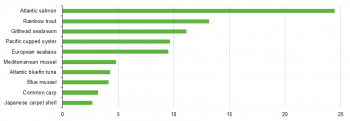
(% of total aquaculture production value, EUR)
Source: Eurostat (fish_aq2a)

(% of total aquaculture production, tonnes live weight )
Source: Eurostat (fish_aq2a)
Main statistical findings
The EU’s aquaculture sector is diverse and specialised: five EU countries account for three quarters of both production value and production volume, while 10 species make up 90 % of the production, in value and volume terms alike.
In 2015 EU aquaculture produced 1.3 million tonnes worth EUR 4 billion, equating to one fifth of total fisheries production
The volume of aquaculture production in the EU[1] in 2015 was estimated at 1.3 million tonnes, or 19.9 % of total EU fisheries production (see Figure 1). Worldwide the EU ranked ninth, with a 1.2 % share in volume[2].
The value of aquaculture production was put at EUR 4 billion. This equates to a 1 % of the output value of agricultural production. However, fish products are a very important source of proteins and healthy fish oils; indeed, the EU is the world’s largest importer of fisheries and aquaculture products[3].
Aquaculture’s highly diverse and specialised nature is reflected in the fact that, in 2015, Spain, the United Kingdom and France were responsible for more than half of the EU’s aquaculture production (with shares of 23.0 %, 16.6 % and 14.1 % respectively). The other big producers were Italy (11.6 %) and Greece (8.3 %). In terms of economic value, the United Kingdom led with a 24.5 % share, followed by France (15.4 %), Spain (12.6 %), Greece (11.4 %) and Italy (9.0 %). This shows that just five EU countries were responsible for almost three quarters of the aquaculture market’s volume and value.
Norway was by far the biggest aquaculture producer in Europe, exceeding the EU in volume and value alike. It produced 1.4 million tonnes, worth EUR 5.2 billion, in 2015, making it the world’s eighth largest producer in farmed fisheries, with a 1.3 % share. Moreover, in 2013 the United Nations Food and Agriculture Organisation[4] ranked Norway as the world’s largest producer of marine finfish, thanks to its salmon production.
All fisheries production in the EU’s landlocked countries (the Czech Republic, Hungary and Slovakia) comes from aquaculture. In the other EU countries it ranges from 89.3 % in Slovenia to 0.6 % in Belgium (see Table 1). In general, aquaculture plays a major role in the countries around the Mediterranean and the Black Sea: Malta, Cyprus, Romania, Greece, Bulgaria and Italy.
Countries around the Mediterranean and Black Sea tend to fish mostly along their coast using small-scale vessels with an average capacity lower than EU average (equal to 18.9 gross tonnes in 2015). As a counterweight, their aquaculture activity plays a major role, representing from 81,6 % in Malta to 43.8 % in Italy of their total fisheries production.
EU aquaculture provides jobs for 39 000 people
In 2015 almost 39 000 people were working in the EU aquaculture sector. They accounted for 28 % of total employment in fisheries (fishing and aquaculture) and 0.02 % of all jobs in the EU. More than a quarter (27.8 %) of them was registered in France. In Norway 4 600 people were employed in aquaculture, corresponding to 39 % of all jobs in the fishing and aquaculture sector and 0.18 % of the country’s total workforce[5] (see Figure 2).
Trends: volume stable, but value slowly increasing
EU aquaculture production remained relatively stable from 2008 to 2015: having peaked in 2009 (up 3.9 % compared to the 2008 base year), by 2013 it had fallen by 4 %, before recovering to 2008 levels in 2015 (see Figure 3). In terms of value, EU aquaculture has been growing since 2011. At the same time, Norwegian aquaculture has enjoyed significant increases in both volume (62 %) and value (147 %).
Structure of aquaculture production
Aquaculture is the farming, under controlled conditions, of aquatic (freshwater or saltwater) organisms such as finfish (e.g. salmon, trout, seabass, carp and tuna), molluscs (e.g. mussels, oysters and clams), crustaceans (e.g. shrimp, crab and lobster), plants (e.g. algae) and other organisms (e.g. frogs, pearls and aquatic mammals). These organisms are grouped together using a taxonomic approach. In 2014 finfish and molluscs made up 98.2 % of all aquaculture production (by weight) in the EU. So by contrast, the production of crustaceans, algae and other organisms was small (see Table 2).
Finfish species are organised into three subgroups, based on their living environment:
- marine fish (species that live solely in saltwater, such as seabass, tuna and seabream);
- freshwater fish (species that live solely in freshwater, such as carp); and
- diadromous fish (species that migrate between oceans and rivers, such as salmon, trout and eels).
In 2014 finfish made up over half (51.2 %) of EU aquaculture production and more than two thirds (70.4 %) of its value. Among finfish, the diadromous subgroup (mostly Atlantic salmon and rainbow trout) accounted for 29.7 % of overall aquaculture production and 37.8 % of total aquaculture value. Molluscs (mussels, oysters and clams) accounted for 47 % of the overall EU aquaculture production, but only 23.2 % of value (see Figure 4 and Figure 5)[6].
The geography of the countries and the natural habitat of the species strongly influence the aquaculture sector, which in EU reported a high degree of specialisation at country level. The Scottish salmon farms made the United Kingdom main producer of diadromous fishes (51.9%). Greece produced 47.8% of the total EU-production of marine fish and Spain accounted for 37.9% of the total EU-production of molluscs. With shares of 23.3 % and 21.7 % respectively, Poland and the Czech Republic were the leading producers of freshwater fish, as Poland’s Baltic coast is less suitable for aquaculture and the Czech Republic is landlocked.
European aquaculture, a highly specialised sector: 10 species make up 90 % of production volume and 87 % of value
Although more than 130 species were farmed in the EU in 2014, the three most common — the Mediterranean mussel, Atlantic salmon and rainbow trout — accounted for over half of all production (53.5 %) and two fifths (42.4 %) of the value. The 10 most common species made up 90 % of production and 87 % of value (see Figure 6 and Figure 7)[7].
The Atlantic salmon was the leading species in European aquaculture. Although it ranked second for volume (15.1 %), it accounted for a quarter of the sector’s overall value (24.4 %). On the contrary, the Mediterranean mussel ranked first for volume (25.1 %) but lagged far behind for value (4.8 %).
Aquaculture is a highly specialised sector. With the exception of rainbow trout, for each of the 10 major species in the EU at least a quarter of the total volume was farmed in one EU country, and each was farmed mainly using one specific method in one specific fishing region (see Table 3)[8].
Among the 10 major species, rainbow trout was the most widespread: it was grown in 24 EU countries, either in inland freshwaters (84.2 %) or in the saltwater of the North East Atlantic (15.8 %), and mainly in tanks (64.9 %). Three countries together accounted for more than half of the total weight: Italy (17.9 %), Denmark (17.3 %) and France (16.8 %).
Common carp, too, was a popular species in the EU: it was farmed in inland freshwaters in 18 Member States. However, two thirds of total production originated in only three countries: Poland (26.9 %), the Czech Republic (26.1 %) and Hungary (15.1 %).
Atlantic salmon was raised almost exclusively in cages in the North East Atlantic, in the United Kingdom (94.8 % of total production) and Ireland (5 %).
Greece farmed most gilthead seabream and European seabass (with 58.8 % and 51.2 % shares respectively), followed by Spain (19.6 % and 26.7 %) and Italy (7.9 % and 9.1 %). Both species were grown mainly in cages in the Mediterranean Sea.
Atlantic tuna was farmed in cages in only three EU countries: Malta (50.6 %), Spain (24 %) and Croatia (20.7 %). While Malta and Croatia farmed Atlantic tuna in the Mediterranean Sea only, Spain also farmed 16.2 % of its overall tuna production in the North East Atlantic.
As for molluscs, Mediterranean mussels were mainly produced in Spain (70.3 %) and Italy (20.3 %) and were almost exclusively raised using the off-bottom method. Despite their name, they came primarily from Spanish farms in the North East Atlantic.
Blue mussels were farmed in the North East Atlantic by the Netherlands (47.1 %), France (37.6 %) and Ireland (9.5 %). Both off-bottom and on-bottom methods were used (50.7 % versus 47.8 %). The off-bottom method was used in France and preferred in Ireland (71.8 % of Irish production). By contrast, 90 % of Dutch production used the on-bottom method.
Pacific cupped oysters were produced mainly in France (88.1 %) and Ireland (8.4 %). The Japanese carpet shell was grown mostly in Italy (95.6 %).
Data sources and availability
Aquaculture production refers to the farming of aquatic (freshwater or saltwater) organisms for human use or consumption, under controlled conditions. Aquaculture implies some form of intervention in the natural rearing process such as regular stocking, feeding and protection from predators. Farming also implies individual or corporate ownership of the stock being cultivated.
For aquaculture statistics, the national authorities of EEA countries submit aquaculture production data to Eurostat under the terms of Regulation (EC) No762/2008 of 9 July 2008 on the submission by Member States of statistics on aquaculture and repealing Council Regulation (EC) No 788/96 (OJ L218 of 13.08.2008).
European data on the quantity of aquaculture production, in tonnes life weight (TLW), have been recorded since 1950 [fish_aq_q]. Since 1984, data on the total value of the production in Thousand Euro are also available [fish_aq_v]. With the entry into force of the new Regulation (EC) No 762/2008 on the submission of aquaculture statistics aquaculture production data are collected and disseminated annually in 5 tables:
- fish_aq2a: Aquaculture production at first sale for human consumption (excluding hatcheries and nurseries) by species, by FAO major area, by cultivation method, by aquatic environment in TLW (tonnes live weight), in Euro and Euro/TLW.
- fish_aq2b: Production of fish eggs (roe) at first sale for human consumption by species, by FAO major area, by aquatic environment in TLW, Euro and Euro/TLW.
- fish_aq3: Input to capture-based aquaculture, i.e. wild seed, by species in TLW, Euro and Euro/TLW.
- fish_aq4a: Production of fertilised eggs at first sale for further on-growing or release to the wild by species in Millions.
- fish_aq
4b: Production of juveniles at first sale for further on-growing or release to the wild by species in Millions.
According to Regulation (EC) No 762/2008, aquaculture production means the output from aquaculture at first sale intended for human consumption. Non-commercial aquaculture is thus not accounted for. Moreover, aquaculture production of aquarium and ornamental species is excluded as well as production for industrial, functional or research purposes.
Data are submitted by all Member States of the European Economic Area by the 31st of December for the preceding year (reporting year -1). They are compiled by the respective competent authorities of the Member States, usually either the National Statistical Institute or the Ministry of Agriculture.
Context
Aquaculture covers the farming of aquatic organisms (finfish, molluscs, crustaceans, algae…) and takes place in both inland and marine areas. Aquaculture is a key component of both the Common Fisheries Policy (CFP) and Blue Growth agenda.
The CFP was first introduced in the 1970s and went through successive updates, the most recent of which took effect on 1 January 2014. The CFP aims to ensure that fishing and aquaculture are environmentally, economically and socially sustainable and that they provide a source of healthy food for EU citizens. Its goal is to foster a dynamic fishing industry and to ensure a fair standard of living for fishing communities.
Blue Growth is the long term strategy to support sustainable growth in the marine and maritime sectors as a whole. Seas and oceans are drivers for the European economy and have great potential for innovation and growth. Aquaculture has been identified as one of the blue economy sectors that have a high potential for sustainable jobs and growth and therefore is included in the strategy.
See also
- Agriculture, forestry and fisheries statistics introduced
- Fishery statistics background
- Fishery statistics in detail
- The EU in the world — agriculture, forestry and fisheries
Further Eurostat information
- Agriculture, forestry and fishery statistics — 2016 edition
- Agriculture, forestry and fishery statistics — 2015 edition
Main tables
- Aquaculture production in tonnes and value (tag00075)
- Catches in all fishing regions (tag00076)
Database
- Aquaculture production by species (fish_aq)
- Catches by fishing area (fish_ca)
- Fishing fleet (fish_fleet)
Dedicated section
Methodology / Metadata
- Aquaculture production (ESMS metadata file — fish_aq_esms)
- Catches by fishing area (ESMS metadata file — fish_ca_esms)
- Fishing fleet (ESMS metadata file — fish_fleet_esms)
Source data for tables, figures and maps (MS Excel)
Other information
Aquaculture:
- Regulations 788/96 and 762/2008 on the submission by Member States of statistics on aquaculture production
External links
- Europa — Policy areas — Maritime affairs and fisheries
- European Commission — Aquaculture
- European Commission — Fisheries
- European Commission — Reform of the common fisheries policy
- FAO — Coordinating Working Party on Fishery Statistics (CWP)
Notes
- ↑ Luxembourg has neither aquaculture nor capture fisheries industry
- ↑ http://www.fao.org/fishery/statistics/en
- ↑ EUMOFA, The EU Fish Market – 2016 edition (http://www.eumofa.eu/the-eu-fish-market)
- ↑ See Global Aquaculture Production Statistics Database updated to 2013, http://www.fao.org/fishery/aquaculture/en
- ↑ In Norway the average productivity per capita was equal to 300 tonnes live weight while the corresponding value for EU was 33 tonnes live weight, i.e. Norway was 9 times more efficient than EU. Such a striking value indicates the high efficiency of the Norwegian salmon farming sector (see FAO, 2017 "Regional review on status and trends in aquaculture development in Europe – 2015")
- ↑ The data for each species and group of species refer to public figures. No data flagged as confidential by EU countries’ data correspondents has been used. All totals are therefore simply the sum of public data and may differ from the real totals. However, in general, the share of production figures flagged as confidential for 2014 was equal to 0.13 % of the total production volume of ‘all aquatic organisms’ and 0.31% for total production value of all aquatic organisms
- ↑ As above: Confidential figures are excluded from the analysis
- ↑ As above: Confidential figures are excluded from the analysis
[[Category:<Subtheme category name(s)>|Name of the statistical article]] [[Category:<Statistical article>|Name of the statistical article]]
Delete [[Category:Model|]] below (and this line as well) before saving!