- Data from December 2009, most recent data: Further Eurostat information, Main tables and Database.
Construction activities in the EU-27, as recorded by NACE Rev. 1.1 Section F, provided employment to an estimated 14.8 million persons in 2007 (some 11.5 % of the non-financial business economy workforce),while generating an estimated EUR 562 billion of value added (9.3 % of the non-financial business economy’s total value added).
Main statistical findings
The construction sector has historically witnessed cyclical patterns to its developments. These may be linked to consumer confidence, the availability of credit (often in the form of mortgages), political events (such as a construction boom in Germany following reunification), or general economic cycles. The peaks and troughs in construction activity tend to be more amplified than those for the whole economy, perhaps as a result of large projects being postponed and/or cancelled during periods when economic output slows or contracts.
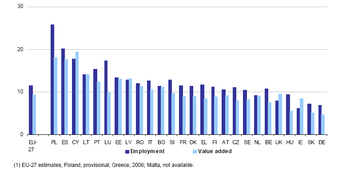
In recent years the construction industry has been highly concentrated in Spain, while this sector has also been of major importance for the Polish and Cypriot economies. Around one quarter of all persons employed in the Polish non-financial business economy (NACE Rev. 1.1 Sections C to I and K) were employed within construction activities in 2007.
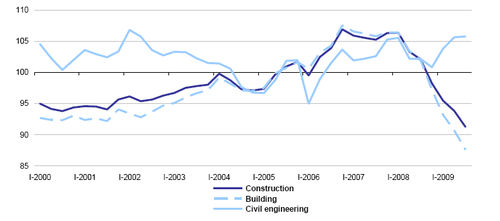
Against this backdrop, the recent credit crisis and economic downturn have had some serious implications for the EU-27 construction sector. Employment has fallen sharply in many of the Member States, particularly in Spain and the Baltic countries. This downsizing of the workforce is reflected in declining output, as the EU-27 index of production for construction fell 14.2 % between the first quarter of 2008 and the third quarter of 2009. Text with Footnote [1]
Structural profile of construction sector
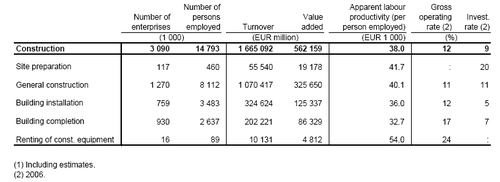
Table 1 provides more detailed information on construction activities within the EU-27 in 2007. There were an estimated 3.1 million construction enterprises across the EU-27, which generated an estimated EUR 1 665 billion of turnover.
The largest of the five construction subsectors (NACE Rev. 1.1 groups) in the EU-27, both in terms of employment and value added, was the building of complete constructions or parts thereof and civil engineering (NACE Group 45.2, hereafter referred to as general construction). This subsector alone accounted for more than half of the value added (about 58 %) and employment (about 55 %) within the EU-27 construction sector in 2007.
Building installation (NACE Group 45.3) and building completion (NACE Group 45.4) were the next largest subsectors, accounting for about 22 % and 15 % respectively of EU-27 value added in construction, and slightly larger shares of employment. The two smallest subsectors were site preparation (NACE Group 45.1) and the renting of construction or demolition equipment with an operator (NACE Group 45.5).
Each person employed within the EU-27 construction sector generated an average EUR 38 000 of value added in 2007. Among the construction subsectors, the highest apparent labour productivity was recorded for the renting of construction equipment (EUR 54 000 per person employed), where labour productivity was about two thirds higher than for building completion activities.
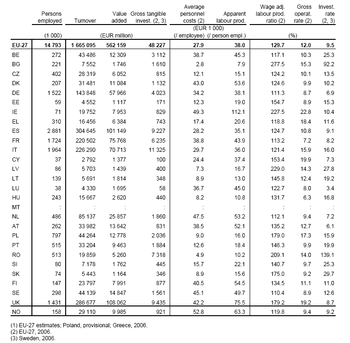
In terms of the number of persons employed, the construction sector in Spain was the largest among the Member States in 2007; the 2.9 million persons employed in these activities represented a little less than one fifth (19.5 %) of the construction workforce in the EU-27. In terms of value added generated, however, the construction sector in the United Kingdom was largest (19.2 % of EU-27 value added), despite having a workforce that was about half the size of that in Spain.
The resulting apparent labour productivity of the construction workforce in the United Kingdom (EUR 75 500 per person employed) was about twice as high as the average in Spain and, among all Member States, only behind that of Ireland (EUR 112 100 per person employed) in 2007.
In comparison to average personnel costs, the value added generated per person employed in construction activities was highest in Bulgaria, where wage adjusted labour productivity was 277.5 %, about two and a half times the ratio of construction workers in Sweden, Germany, the Netherlands and France.
The gross operating rate (the relation between gross operating surplus and turnover) is a measure of profitability. The gross operating rate of the construction sector in 2007 was highest in Ireland (22.8 %) and Cyprus (19.9 %) but lowest in Hungary (6.3 %) and France (7.2 %).
When the 2008 and 2009 structural business statistics become available the impact of the economic downturn on these productivity and profitability ratios will become clear, and it is likely that these will show a significant reduction.
The relative contribution made by the construction sector to the value added of the non-financial business economies of Cyprus (19.4 %), Poland (18.1 %) and Spain (17.6 %) was notably higher than for other Member States. This was also the case for employment, where Luxembourg was also relatively specialised in construction activities.
In value added terms, the least specialised Member States for construction were Germany (reflecting a rebound following the post reunification boom years), Slovakia and Hungary, the construction sector contributing between 4.7 % and 5.5 % of the value added of their respective non-financial business economies in 2007.
High contribution of micro and small enterprises
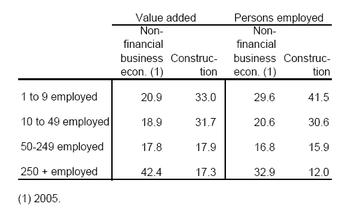
Most construction enterprises serve a local market and, consequently, the construction sector is characterised by a high number of small enterprises, and relatively few large ones. Micro and small enterprises (with less than 50 persons employed) together employed 72.1 % of the EU-27 construction sector workforce in 2006, a much higher share than the average (50.2 %, 2005) for the non-financial business economy. These enterprises also provided about two thirds (64.7 %)of sectoral value added in 2006, compared with two fifths (39.8 %, 2005) for the whole of the nonfinancial business economy.
Development of short-term indices for construction
The specialisation of regions and countries in any one type of activity increases their vulnerability in a downturn. The squeeze on the availability and affordability of credit for construction in the recent economic downturn, as well as the broader downturn in business and consumer confidence has made the construction sector particularly vulnerable.
It is interesting to note (see Figure 1 on the front cover) that the reduction in construction activity has been largely concentrated within the building subsector, while the index of production for civil engineering remained relatively untouched; this possibly reflects decisions made at a governmental level to maintain expenditure on public infrastructure projects.
Confidence indicators (based on the opinions of the main actors involved in economic decision making) provide a subjective view about the position of the economy in an economic cycle. Figure 3 shows the sharp and rapid loss of both consumer and construction confidence since September 2007. The loss of construction confidence was even sharper than the overall loss of consumer confidence, hinting at the particular vulnerability of this sector in the economic downturn.
With caution, it appears as though these two confidence indicators bottomed out in the spring of 2009, since when they have begun to rebound, more clearly in the case of consumer confidence.
Another indicator that may be used to gauge future construction activity is the index of new orders for construction. Figure 4 shows clearly the decline in demand for new constructions since the end of 2007/beginning of 2008. For the EU-27 as a whole, the index for new construction orders declined by almost one third between the final quarter of 2007 and the first quarter of 2009 to levels last recorded at the beginning of 2000 (which is another period associated with a slowdown in economic activity, in particular, relatively high interest rates and a loss of confidence following a crash in global stock markets as the dot-com bubble came to an end).
The new orders index for building peaked in the third quarter of 2007, whereas that for civil engineering peaked later, in the second quarter of 2008. Between those peak levels and the latest index levels (first quarter of 2009) the index for building fell by 37.2 % and that for civil engineering fell by 21.3 %. In some Member States, the decline in the index of new orders in construction has been particularly strong; in Spain there was a reduction of two thirds (-68.9 %) from the relative peak in the third quarter of 2007 to the third quarter of 2009, and in Latvia the index halved between the final quarters of 2007 and 2008.
The downturn in construction activity has inevitably had an impact on the number of persons employed. The EU-27 employment index for construction fell sharply (-8.8 %) between the first quarter of 2008 and the second quarter of 2009.
There were much stronger rates of decline in some Member States, particularly in the Baltic Member States and Spain. The construction workforces of Latvia and Spain shrank by about one third between the first quarter of 2008 and the third quarter of 2009. There were a few Member States, however, where the size of the construction workforce remained relatively stable or even expanded comparing the latest index level with that at the beginning of 2008. In particular, the construction workforce in Slovakia was almost 6 % higher in the third quarter of 2009 than the first quarter of 2008 and growth in Poland was only slightly less.
During this economic downturn one might expect some enterprises to reduce working hours before making cuts in employment. There is only a slight amount of evidence to support this theory of labour retention within the construction sector (maybe the precarious nature of employment contracts – for example, temporary and seasonal work – plays a role). The index of the number of hours worked in construction in the EU-27 declined by a slightly larger amount (-10.4 %) than that of the employment index (-8.8 %) between the first quarter of 2008 and the second quarter of 2009. The retention of labour was more marked in Germany, as the index of hours worked declined by 15.1 %, at a rate that was much greater than that registered for the index of employment (-3.3 %).
Despite the downturn in construction activity and the loss of employment, it is interesting to note that, at least by the final quarter of 2008, there had been little change in the upward development of the EU-27 labour cost index for new residential buildings. Nevertheless, there was a decline in the overall construction cost index (which includes material and labour costs) for new residential buildings from the third quarter of 2008.
In some of the Member States, there were noticeable downturns in these cost indices; as the construction cost indices of Lithuania, the United Kingdom, Estonia and Ireland fell by between 9 % and 16 % in the period between the third quarter of 2008 and the second quarter of 2009. In the Baltic Member States, the labour cost index of new residential buildings declined by between 10 % and 27 % over the same period.
Data sources and availability
<description of data sources, survey and availability (completeness, recency) limitations>
Context
Publications
Further Eurostat information
- Title(s) of second level folder (if any)
- Title(s) of third level folder (if any)
- Title(s) of second level folder (if any)
- Title(s) of third level folder (if any)
<regulations and other legal texts, communications from the commission, administrative notes, policy documents, …>
- Regulation 1737/2005 of DD Month YYYY on ...
- Council Directive 86/2003 of DD Month YYYY
- Commission Decision 86/2003 of DD Month YYYY
<for other documents such as commission proposals or reports, see [http:>
<for linking to database table, otherwise remove: {{{title}}} ({{{code}}})>
External links
See also
Notes
- ↑ Text of the footnote.
[[Category:<category name(s)>]] [[Category:<statistical article>]]

