Archive:Urban Europe - statistics on cities, towns and suburbs - executive summary
- Data extracted in February–April 2016. Most recent data: Further Eurostat information, Main tables and Database.

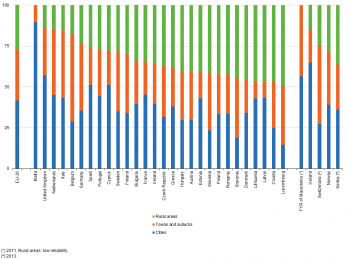
(% of total population)
Source: Eurostat (ilc_lvho01)
This chapter is part of an online publication that is based on Eurostat’s flagship publication Urban Europe — statistics on cities, towns and suburbs.
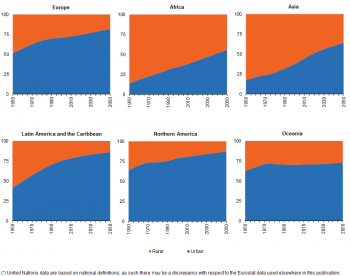
Throughout history, cities have been at the centre of change, from the spread of Greek and Roman civilizations, through the Italian renaissance period, to the industrial revolution in the United Kingdom. Over time, Europe has slowly transformed itself away from being a largely rural, agricultural community and according to the United Nations [1], more than half of the European population was living in an urban area by 1950; this was also the case in North America and Oceania (see Figure 1).
More than half the world’s population is living in urban areas
By contrast, more than 80 % of those living in Africa and Asia in 1950 inhabited rural areas. While the pace of urbanisation in these two continents subsequently accelerated, in 2015 a majority of their populations — Africa (59.6 %) and Asia (51.8 %) — continued to live in rural areas. Almost three quarters of the European population lived in an urban area in 2015, while even higher shares were recorded in Latin America and the Caribbean (79.8 %) and North America (81.6 %). These different levels of urbanisation show that, at a global level, it was only during the last decade that the total number of people living in urban areas overtook those living in rural areas.
According to the United Nations (World urbanisation prospects (2014)), approximately two thirds of the world’s population will be living in an urban area by 2050. This rapid pace of change is projected to be driven primarily by changes in Africa and Asia, as the focus of global urbanisation patterns continues to shift towards developing and emerging economies. The pace of change in Europe will likely be slower, with the share of the population living in urban areas projected to rise to just over 80 % by 2050.
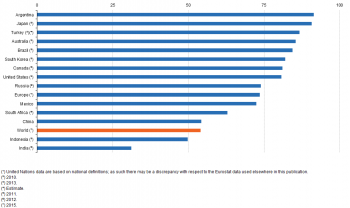
Aside from the considerable differences in shares of urban populations across continents, there are also widespread differences between countries. Figure 2 provides information on the share of the urban population in 2014, which peaked (among those countries shown) in Argentina and Japan (2010 data) at over 90 %. Just over half (54.3 %) the population of China was living in an urban area in 2014, while the urban population in India (2011 data) accounted for less than one third (31.1 %) of the total number of inhabitants.
For a more detailed analysis of global changes in the degree of urbanisation (based on the development of a new global population grid), please refer to The State of European Cities report, recently released by the Directorate-General for Regional and Urban Policy.
Paris and London — the EU’s largest cities — were less than one third the size of Tokyo
The spatial distribution of cities varies considerably: Europe is generally characterised by a high number of relatively small cities and towns that are distributed in a polycentric fashion; this reflects, to some degree, its historical past which has led to a fragmented pattern of around 50 countries being spread over the continent. By contrast, in some parts of Asia and North America, a relatively high proportion of the urban population is concentrated in a small number of very large cities.
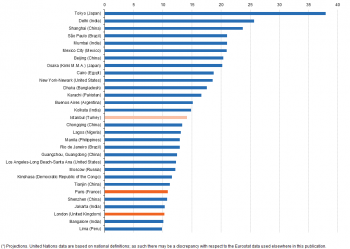
The United Nations defines a megacity as having in excess of 10 million inhabitants. According to this criterion, there are only two megacities within the European Union (EU), those of Paris and London. Figure 3 presents a list of the top 30 global agglomerations in 2015, with all but one of these — the Peruvian capital of Lima (9.9 million inhabitants) — being classified as a megacity.
Of the 29 megacities in 2015, Tokyo (Japan) was the world’s largest city, its agglomeration numbered 38.0 million inhabitants. It was followed by Delhi (India) with 25.7 million, Shanghai (China) with 23.7 million, Mexico City (Mexico), Mumbai (India) and São Paulo (Brazil) each with around 21 million, and Beijing (China) and Osaka (Japan) each with just over 20 million inhabitants. The populations of Paris and London were — in global terms — relatively small, as each had less than 11 million inhabitants; in other words they were less than one third the size of Tokyo. There were two other European cities in the ranking, the Turkish city of Istanbul (14.2 million inhabitants) and the Russian capital of Moscow (12.2 million inhabitants).
Many cities in the EU are characterised by their urban paradoxes
Urban areas in the EU are often characterised by high concentrations of economic activity, employment and wealth with the daily flow of commuters into many of Europe’s largest cities suggesting that opportunities abound in these hubs of innovation, distribution and consumption. However, cities in the EU are also characterised by a range of social inequalities, and it is commonplace to find people who enjoy a comfortable life living in close proximity to others who may face considerable challenges, for example, in relation to housing, poverty or crime — herein lies the ‘urban paradox‘ (see Chapter 2). These polarised opportunities/challenges are often in stark contrast, as patterns of inequality in cities are generally more widespread than those observed for countries as a whole.
The spatial distribution of urban areas across EU Member States is extremely varied
There are considerable differences in the size and spatial distribution of urban developments across the EU Member States: for example, the Netherlands is characterised by a high level of population density and a high share of urban land use, whereas in most of the Nordic Member States and the interior of the Iberian Peninsula much lower levels of urban land use are commonplace. Each of the EU Member States has a distinctive history of territorial developments: for example, centrally-planned economies and the lack of a market for land/property resulted in compact urban developments across most eastern and Baltic Member States. Since the middle of the last century, most of Europe has been characterised by spreading cities and increased population numbers, with people choosing to move out of inner cities to suburban and peri-urban areas (hybrid areas of fragmented urban and rural characteristics); this has resulted in the divide between urban and rural areas becoming increasingly blurred (see Chapter 3).
In most EU Member States, the capital city tends to outperform other cities and regions
Capital cities have the potential to play a crucial role in urban developments within the EU; they are often hubs for competitiveness and employment, and may be seen as drivers of innovation and growth, as well as centres for education, science, social, cultural and ethnic diversity. A comparison of European cities’ economic performance indicates that the major cities — and in particular, the metropolitan regions of EU capital cities — generally outperform the rest. In some EU Member States, capital cities exert a form of ‘capital magnetism’, through a monocentric pattern of urban development which attracts investment/resources so these are concentrated in the capital. Whether such disparities have a positive or negative effect on the national economy is open to debate, as capital cities that dominate their national economies may create high levels of income and wealth that radiate to surrounding regions and pull other cities/regions up (see Chapter 4).
European policymakers are seeking ways to make urban areas more sustainable by encouraging smart city initiatives
Smart cities may be defined as those which seek to address public issues via ICT-based solutions involving multi-stakeholder partnerships. Smart cities have the potential to improve the quality of life: they are innovative, making traditional networks and services more efficient through social innovation and the use of digital technologies, creating more inclusive, sustainable and connected cities for the potential benefit of their inhabitants, public administrations and businesses. Smart cities are generally characterised by very high concentrations of people having completed a higher education, while statistics on innovation activity confirm that they also record a high propensity to patent (see Chapter 5).
While urban areas are often responsible for environmental damage, large and compact cities can potentially deliver sizeable savings in terms of resource efficiency
While urbanisation has the potential to raise wealth, it often does so accompanied by pollution or other forms of environmental damage. Indeed, global patterns of urbanisation have created some of the biggest environmental challenges facing the planet. However, it is increasingly recognised that compact cities are resource-efficient ways for people to live and for businesses to exist, as close proximity and the pooling of resources provides potential efficiency gains.
‘Green cities’ combine higher levels of efficiency, with innovative capacity and reduced environmental impact, addressing issues like congestion through the implementation of, among others, road charges and integrated public transport systems. This ‘greening’ of cities has the potential to reduce pollution and the harm that may be done to an individual’s health, for example, by reducing traffic, promoting the use of cleaner or renewable fuels, encouraging cyclists/pedestrians, or introducing more green spaces (see Chapter 6).
Rapid expansion in tourist arrivals in cities can potentially stimulate economic growth, but may also increase congestion or impact on the quality of life for local inhabitants
In keeping with many aspects of urban development, tourism is a paradox, insofar as an increasing number of tourists in some towns and cities has resulted in congestion/saturation which may damage the atmosphere and local culture that made them attractive in the first place; Venezia (Italy) and Barcelona (Spain) are two of the most documented examples. Furthermore, while tourism has the potential to generate income which may be used to redevelop/regenerate urban areas, an influx of tourists can potentially lower the quality of life for local inhabitants, for example, through: higher levels of pollution and congestion; new retail formats replacing traditional commerce; increased prices; or increased noise (see Chapter 7).
Young people tend to live in the suburbs of some of the largest cities in the EU
Aside from attracting (potential) business investment, cities also need to attract individuals: this can be done through the quality of what they can offer in terms of education, jobs, social experiences, culture, sports and leisure facilities, environment, or urban safety. The results presented in Chapter 8 suggest that a high proportion of Europe’s ageing population lives in relatively small towns and cities (with a preference to live on the coast), whereas younger people are more likely to live in the suburbs within close proximity of capital or other large cities.
Employment rates for women tended to be higher in cities than in rural areas
Employment rates among women were somewhat higher in cities than they were in towns and suburbs or rural areas. Indeed, female participation tended to influence overall employment rates far more than male rates and explained, for example, why relatively low employment rates were recorded in many (particularly rural) parts of southern Europe.
Otherwise, one of the recurring themes in relation to urban labour markets is commuting, which results from increased levels of mobility. Lengthy commutes to work may be associated with increased congestion, as well as environmental and economic costs (for individuals, local authorities and enterprises). The share of people who use public transport to get to work is generally much higher in the EU’s largest cities, while in provincial cities, towns and suburbs the use of private motor vehicles tends to be the principal mode of transport for getting to work (see Chapter 9).
Capital cities were often faced with considerable housing challenges
Some city-dwellers live in urban neighbourhoods that are characterised by overcrowding and/or poor quality housing, a lack of social housing and low levels of home ownership. Such issues may lead, among others, to lower life chances, health inequalities, increased risks of poverty and environmental risks. In absolute terms, the smallest dwellings in cities of the EU were located in the Baltic Member States and Romania (an average of less than 60 m² per dwelling) while the largest were located in Cyprus, Belgium, Luxembourg and Portugal (an average of more than 100 m² per dwelling); those city-dwellers enjoying the largest amounts of living space were usually living in provincial (rather than capital) cities. Indeed, it was commonplace to find that the capital city had the highest share of flats and the lowest share of houses in its total number of dwellings, likely due — among others — to the cost of land, a lack of space for new property developments, a range of alternative land uses competing for space (business and commercial property), and a high level of demand from those wishing to live in the capital city. The highest shares of one-person households among EU cities were recorded in four capitals located in western and northern Europe — Berlin, Helsinki, Amsterdam and Copenhagen — with almost half (49.0 %) of all households in Berlin composed of single persons (see Chapter 10).
Foreign-born populations in the EU tend to congregate in relatively few, large cities
Migrants have historically played an important role in demographic and economic developments within the EU, particularly in some of Europe’s largest cities. However, the selective nature of migratory patterns is such that migrant destinations are often restricted to relatively few, large cities, which tend to receive a disproportionate number of immigrants. These patterns are often accentuated as first wave migrants who establish themselves in a particular part of a city may subsequently encourage relatives and friends to follow them. Results presented in Chapter 11 confirm that the metropolitan regions of capital cities often recorded some of the highest rates of net migration, with Greater London having the highest number of foreign-born inhabitants, at almost three million. Foreign-born populations living in urban regions were typically of working age and a majority were born outside of the EU, although in Luxembourg almost one third of the total population was born in another EU Member State.
There were 34 million people living in EU cities who were at risk of poverty or social exclusion
The distribution of income and wealth in the EU has, particularly in recent years, become increasingly concentrated in the hands of global businesses and the very rich and these developments are particularly visible in urban areas. Cities in western Europe are often found to be among the least inclusive, as witnessed by their relatively high shares of people living at risk of poverty, high shares of people living in low work intensity households, or high unemployment rates. While these cities were often characterised by higher standards of living — as measured by GDP per inhabitant — they also recorded a high degree of income inequality. However, severe material deprivation was relatively low in most of western Europe, while much higher rates were recorded in some of the eastern and southern, as well as the Baltic Member States. An urban paradox would appear to exist in some cities, where a high concentration of job opportunities coexists alongside a large number of disengaged people who remain outside the labour market (see Chapter 12).
People living alone in cities had higher levels of life satisfaction than those living alone in more remote areas
While overall economic growth in the EU has continued to rise, many critiques point out that increased prosperity has failed to deliver better overall standards of living. Quality of life is considered to be one of the most important dimensions for sustaining any urban development. Some of the results from Chapter 13 confirm that single persons living in cities tended to record a higher level of overall life satisfaction than those living alone elsewhere, while one of the main issues facing those living in cities was a lack of satisfaction with their accommodation. Results from a perception survey provide evidence of a geographical divide, insofar as a lower share of city-dwellers living in western European cities were satisfied with life, when compared with relatively high levels of satisfaction among those living in cities in eastern EU Member States.
See also
- Urban Europe — statistics on cities, towns and suburbs (online publication)
- Degree of urbanisation classification - 2011 revision
- European cities - spatial dimension
- European cities – the EU-OECD functional urban area definition
- Eurostat regional yearbook
- Regional typologies overview
- Regions and cities (all articles on regions and cities)
- Territorial typologies
- Territorial typologies for European cities and metropolitan regions
- Urban-rural typology update
Further Eurostat information
Data visualisation
Main tables
Database
- Degree of urbanisation (degurb)
- Metropolitan_regions (met)
- Urban audit (urb)
- Regional statistics by NUTS classification (reg)
Dedicated section
Methodology / Metadata
- What is a city?
- Urban audit (ESMS metadata file — urb_esms)
- Regional statistics by typology (ESMS metadata file — reg_typ_esms)
Source data for tables, figures and maps (MS Excel)
External links
- European Commission, Directorate-General for Regional and Urban Policy, Urban development
- European Commission, Directorate-General for Regional and Urban Policy, A harmonised definition of cities and rural areas: the new degree of urbanisation
- OECD, Redefining urban — a new way to measure metropolitan areas
Notes
- ↑ The data provided by the United Nations are based on national definitions which may undermine comparability in some cases; note these definitions are somewhat different to those employed elsewhere in this publication (based on a harmonised data collection exercise conducted by the EU).


