Archive:The EU in the world - population
- Data extracted in March 2015. Most recent data: Further Eurostat information, Main tables and Database.
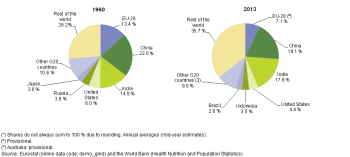
(%)
Source: Eurostat (demo_gind) and the World Bank (Health Nutrition and Population Statistics)
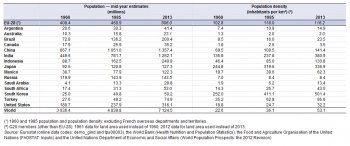
Source: Eurostat (demo_gind) and (tps00003), the World Bank (Health Nutrition and Population Statistics), the Food and Agriculture Organisation of the United Nations (FAOSTAT: Inputs) and the United Nations Department of Economic and Social Affairs (World Population Prospects: the 2012 Revision)

(% of total population)
Source: Eurostat (demo_pjangroup) and the World Bank (Health Nutrition and Population Statistics)
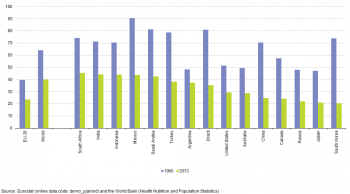
(population aged 0–14 as a percentage of the population aged 15–64)
Source: Eurostat (demo_pjanind) and the World Bank (Health Nutrition and Population Statistics)
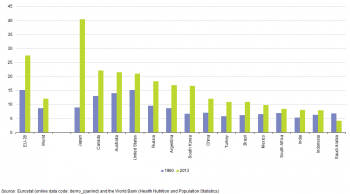
(population aged 65 or more as a percentage of the population aged 15–64)
Source: Eurostat (demo_pjanind) and the World Bank (Health Nutrition and Population Statistics)
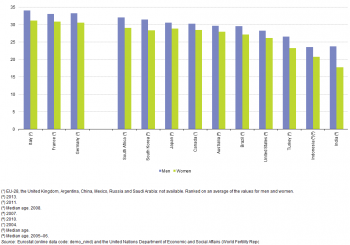
(years)
Source: Eurostat (demo_nind) and the United Nations Department of Economic and Social Affairs (World Fertility Report 2012)
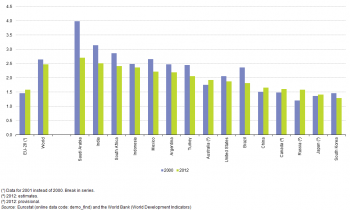
(average number of births per woman)
Source: Eurostat (demo_find) and the World Bank (World Development Indicators)
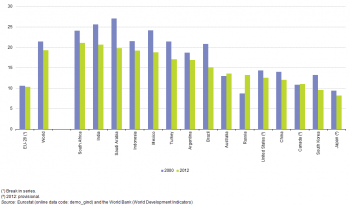
(per 1 000 population)
Source: Eurostat (demo_gind) and the World Bank (World Development Indicators)
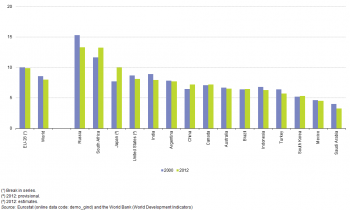
(per 1 000 population)
Source: Eurostat (demo_gind) and the World Bank (World Development Indicators)
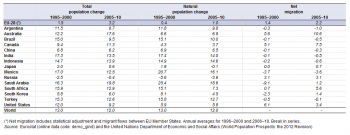
(per 1 000 population)
Source: Eurostat (demo_gind) and the United Nations Department of Economic and Social Affairs (World Population Prospects: the 2012 Revision)
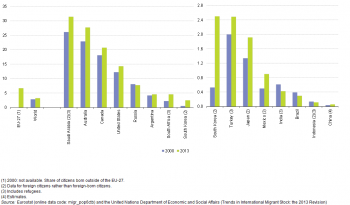
(%)
Source: Eurostat (migr_pop6ctb) and the United Nations Department of Economic and Social Affairs (Trends in International Migrant Stock: the 2013 Revision)
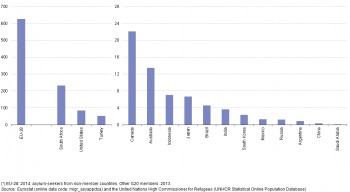
(thousand applicants)
Source: Eurostat (migr_asyappctza) and the United Nations High Commissioner for Refugees (UNHCR Statistical Online Population Database)
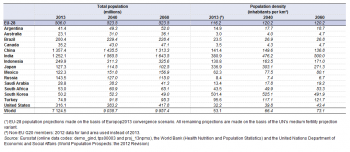
Source: Eurostat (demo_gind), (tps00003) and (proj_13npms), the World Bank (Health Nutrition and Population Statistics) and the United Nations Department of Economic and Social Affairs (World Population Prospects: the 2012 Revision)
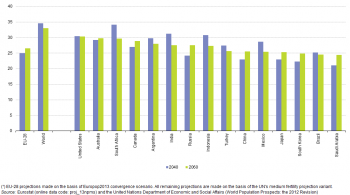
(population aged 0–14 as a percentage of the population aged 15–64)
Source: Eurostat (proj_13npms) and the United Nations Department of Economic and Social Affairs (World Population Prospects: the 2012 Revision)
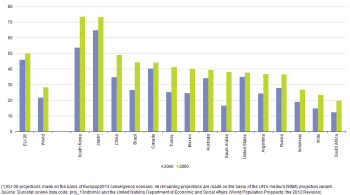
(population aged 65 or more as a percentage of the population aged 15–64)
Source: Eurostat (proj_13ndbims) and the United Nations Department of Economic and Social Affairs (World Population Prospects: the 2012 Revision)
This article is part of a set of statistical articles based on Eurostat’s publication The EU in the world 2015.
This article focuses on population structure and population developments in the European Union (EU) and in the 15 non-EU members of the Group of Twenty (G20). It covers key demographic indicators and gives an insight of the EU’s population in comparison with the major economies in the rest of the world, such as its counterparts in the so-called Triad — Japan and the United States — and the BRICS composed of Brazil, Russia, India, China and South Africa.
Main statistical findings
Population size and population density
Between 1960 and 2013 the share of the world’s population living in G20 members fell from 73.8 % to 64.3 %
In 2013, the world’s population reached 7.1 billion inhabitants and continued to grow. Although all members of the G20 recorded higher population levels in 2013 than they did more than 50 years before, between 1960 and 2013 the share of the world’s population living in G20 members fell from 73.8 % to 64.3 %. Russia recorded the smallest overall population increase (19.7 %) during these 53 years, followed by the EU-28 (23.9 %), while the fastest population growth among G20 members was recorded in Saudi Arabia, with a seven-fold increase.
The most populous countries in the world in 2013 were China and India, together accounting for almost 37 % of the world’s population (see Figure 1) and 57 % of the population in the G20 members. The population of the EU-28 in 2013 was 506.0 million inhabitants, 7.1 % of the world’s total.
As well as having the largest populations, Asia had the most densely populated G20 members, namely South Korea, India and Japan — each with more than 300 inhabitants per km² (of land area), followed by China and Indonesia and then the EU-28 with more than 100 inhabitants per km².
Population age structure
Ageing society represents a major demographic challenge for many economies and may be linked to a range of issues, including, persistently low levels of fertility rates and significant increases in life expectancy during recent decades.
Figure 2 shows how different the age structure of the EU-28’s population is from the average for the whole world. Most notably the largest shares of the world’s population are among the youngest age classes, reflecting a population structure that is younger, whereas for the EU-28 the share of the age groups below those aged 45–49 years generally gets progressively smaller approaching the youngest cohorts. The structure in the EU-28 reflects falling fertility rates over several decades and a modest increase in the most recent decade, combined with the impact of the baby-boomer cohorts on the population structure (resulting from high fertility rates in several European countries up to the mid-1960s). This overall pattern of a progressively smaller share of the population in the younger age groups in the EU-28 stops at the age group 10–14, below which the share stabilises in the age group 5–9 and increases slightly in the age group 0–4. Another notable difference is the greater gender imbalance within the EU-28 among older age groups than is typical for the world as a whole. Some of the factors influencing age structure are presented in the rest of this article and the article on health, for example, fertility, migration and life expectancy.
Japan had by far the highest old-age dependency ratio in 2013
The young and old age dependency ratios shown in Figures 3 and 4 summarise the level of support for younger persons (aged less than 15 years) and older persons (aged 65 years and over) provided by the working age population (those aged 15–64 years). In 2013, the young-age dependency ratio ranged from 20.4 % in South Korea to more than double this ratio in South Africa (45.4 %), with the ratio in the EU-28 (23.6 %) lower than in most G20 members. By far the highest old-age dependency ratio in 2013 was the 40.5 % observed in Japan, indicating that there were two people aged 65 and over for every five people aged 15 to 64 years; the next highest old-age dependency ratio was 27.5 % in the EU-28.
The fall in the young-age dependency ratio for the EU-28 between 1960 and 2013 more than cancelled out an increase in the old-age dependency ratio. Most of the G20 members displayed a similar pattern, with two exceptions: in Japan the increase in the old-age dependency ratio exceeded the fall in the young-age dependency ratio; in Saudi Arabia both the young and old-age dependency ratios were lower in 2013 than in 1960, reflecting a large increase in the working age population in this country.
See also
Further Eurostat information
Publications
- The EU in the world 2014
- Key figures on the enlargement countries — 2014 edition
- Pocketbook on Euro-Mediterranean statistics — 2013 edition
- The EU in the world 2013
- The European Union and the BRIC countries
- The European Union and the African Union — 2013 edition
- The European Union and the Republic of Korea — 2012
- Demographic outlook 2010
Main tables
- Population (t_populat), see:
- Demography (t_pop)
- Demography - National data (t_demo)
- Population (t_demo_pop)
- Population density (tps00003)
- Population (t_demo_pop)
- Demography - National data (t_demo)
Database
- Population (populat), see:
- Demography (pop)
- Demography - National data (demo)
- Demographic balance and crude rates (demo_gind)
- Population (demo_pop)
- Population on 1 January by age and sex (demo_pjan)
- Population on 1 January by five years age groups and sex (demo_pjangroup)
- Population on 1 January: Structure indicators (demo_pjanind)
- Fertility (demo_fer)
- Fertility indicators (demo_find)
- Marriage and divorce (demo_nup)
- Marriage indicators (demo_nind)
- Divorce indicators (demo_ndivind)
- Demography - National data (demo)
- International Migration and Asylum (migr)
- Asylum (migr_asy)
- Applications (migr_asyapp)
- Asylum and new asylum applicants by citizenship, age and sex Annual aggregated data (rounded) (migr_asyappctza)
- Applications (migr_asyapp)
- Asylum (migr_asy)
- Population projections (proj)
- EUROPOP2013 - Population projections at national level (proj_13n)
- Projected population (proj_13np)
- EUROPOP2013 - Population projections at national level (proj_13n)
Dedicated section
Source data for tables and figures (MS Excel)
![]() Population: tables and figures
Population: tables and figures
External links
- Food and Agriculture Organisation of the United Nations FAO
- OECD
- United Nations Department of Economic and Social Affairs
- United Nations Economic Commission for Europe UNECE
- United Nations High Commissioner for Refugees UNHCR
- World Bank