Archive:Enlargement countries - transport statistics
- Data from October 2013. Most recent data: Further Eurostat information, Main tables and Database.
This article is part of an online publication based on the ‘Key figures on the enlargement countries – 2014 edition’ pocketbook and presents statistics on transport in the enlargement countries. It gives an overview on transport-related statistics in the enlargement countries and in the European Union (EU), covering the most important indicators, i.e. motorisation rate, length of main transport networks, road and railway network density and freight transport.
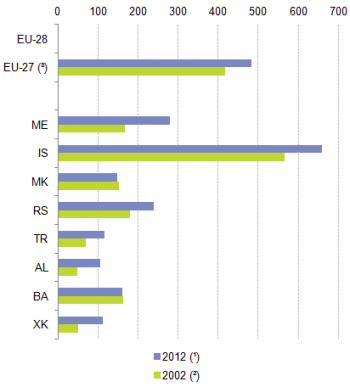
Source: for EU aggregates, DG Mobility and Transport (EU transport in figures); for the enlargement countries, Eurostat (cpc_transp) and (cpc_psdemo)
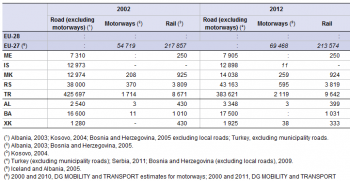
Source: for EU aggregates, DG Mobility and Transport (EU transport in figures); for the enlargement countries, Eurostat (cpc_transp)
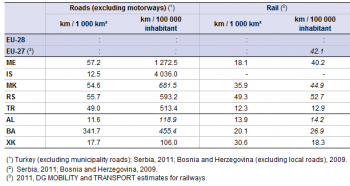
Source: for EU aggregates, Eurostat (road_if_roads), (demo_pjan) and (apro_cpp_luse) and DG Mobility and Transport (EU transport in figures); for the enlargement countries, Eurostat (cpc_transp), (demo_pjan) and (cpc_agmain)
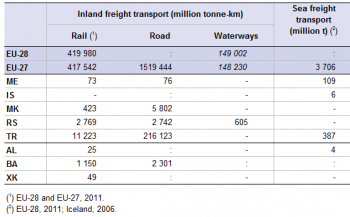
Source: for EU aggregates, (rail_go_typeall), (road_go_ta_tott), (iww_go_atygo) and (mar_mg_aa_cwhd); for the enlargement countries, Eurostat (cpc_transp)
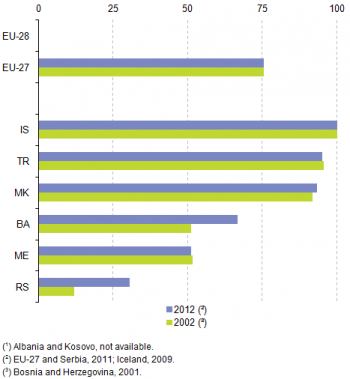
Source: for EU aggregates, (tran_hv_frmod); for the enlargement countries, Eurostat (cpc_transp)
Main statistical findings
Motorisation rate: fastest growth in Kosovo between 2005 and 2012
The EU and all the enlargement countries have increased their motorisation rate since 2002. In the EU, the estimated number of passenger cars per 1 000 inhabitants increased from 417 in 2000 to 483 in 2011, a 15.8 % increase in a decade. Influenced by a demographic transition, it is unlikely that this growth will continue at the same pace as in the past. Considerable growth in relative terms was observed in Albania and Kosovo[1], although these countries remained at the bottom end among the enlargement countries in terms of motorisation rate (see Figure 1). In Kosovo, the number of passenger cars per 1 000 inhabitants increased from 50 in 2005 to 111 in 2012, an increase of almost 122 %. Albania followed with an increase of 118 % and a motorisation rate of 106 passenger cars per 1 000 inhabitants in 2012, compared to 49 in 2002.
Continued growth in the motorway network, little change in the rail network
In the EU, the motorway network is relatively dense and its overall length continued to grow at an average annual rate of 2.4 % between 2000 and 2010, reaching a total length of 69 468 km in 2010 (see Table 2). In Serbia, the motorway network expanded at a faster rate (average annual growth rate of nearly 5 %), reaching a total length of 595 km in 2012. Growth in the motorway network was also registered in Turkey, but the 2 119 km available in 2012 (annual average growth rate of slightly over 2 %) was still fairly low compared to the size and population of the country. In 2010, the EU had over 213 thousand km of railway lines in operation. Newly built railway lines have not been able to entirely compensate for abandoned lines as the total network in 2011 was slightly smaller than that of 2000. This development should also be seen in the light of railway deregulation. At EU level, deregulation helped railway companies to improve their productivity. These productivity gains were, however, achieved mostly through the reorganisation of networks and the discontinuation of unprofitable services. Among the enlargement countries, Turkey experienced a considerable increase in the length of railway lines, from 8 671 km in 2002 to 9 642 km in 2012. In the other enlargement countries, the length of the railway network did not change significantly. Noticeable is nevertheless the important reduction (in relative terms) of the rail network in Kosovo, where the network decreased by 22 %. There are no railways in Iceland. The density of railway lines is high in western and central parts of the EU and lower in the peripheral parts. In 2011, the rail network density in Serbia amounted to an average of nearly 50 km of lines per 1000 km2 of territory (see Table 3). The remaining enlargement countries were well below this density, ranging between 12.3 km and 35.9 km per 1 000 km2. When considering railway lines in relation to the population, the EU had an average of 42 km of railway lines per 100 000 inhabitants, whereas this ratio was almost 53 km for Serbia and nearly 45 km for the former Yugoslav Republic of Macedonia. Turkey and Albania, both characterised by an uneven population distribution, reported the lowest ratios in this category, with 12.9 km and 14.2 km respectively.
For the EU, road remained the dominant freight transport mode, accounting for 1 519 billion tonne-kilometres (tkm) performed in 2012, compared to around 420 billion tkm for rail and almost 150 billion tkm for inland waterways (see Table 4). Not all EU Member States feature several inland transport modes: navigable inland waterways exist in only 16 EU Member States; Malta and Cyprus do not have railways. Whereas road transport played a substantial role in Turkey in 2012, the relative importance of rail freight transport was evident in Bosnia and Herzegovina, the former Yugoslav Republic of Macedonia and especially Serbia. Only Serbia featured freight transport via inland waterways (essentially on the Danube); however, the volumes forwarded remained limited. Looking back in time, the road share in the total transport performance has increased especially in Serbia and Bosnia and Herzegovina. In Serbia the road share rose to 31 % in 2011, compared to 12 % in 2002 (see Figure 5). Similarly, road freight transport became more important in Bosnia and Herzegovina, increasing from a share of 51 % in 2001 to 67 % in 2012. The road share remained stable in the rest of the enlargement countries. Comparing 2002 and 2011, the share of road in total freight transport remained stable in the EU, at 75 %.
Data sources and availability
Data for a core set of indicators are collected each year through questionnaires sent out by Eurostat to the partner countries. A network of contacts in each country has been established for updating the questionnaires. Eurostat distributes the electronic questionnaires to a single contact point in each partner country. This contact point is in charge of the onward distribution of the questionnaires to the various thematic co-ordinators in each country's statistical system (generally within the National Statistical Offices) and of their collection afterwards. When completed, the validated and updated questionnaires are sent back to Eurostat.
Context
An efficient and well-functioning passenger and freight transport system is vital for European Union (EU) enterprises and inhabitants. The EU’s transport policy aims to foster clean, safe and efficient travel throughout Europe, underpinning the internal market for goods (transferring them between their place of production and consumption) and the right of citizens to travel freely throughout the EU (for both work and pleasure). Transport infrastructure is fundamental for the smooth operation of the economy, for the mobility of persons and goods and for the economic, social and territorial cohesion of a country.
See also
- Enlargement countries - statistical overview (online publication)
- International statistical cooperation
- Transport
Further Eurostat information
Publications
- Key figures on the enlargement countries – 2014 edition
- Key figures on the enlargement countries - 2013 edition
- Pocketbook on the enlargement countries - 2012 edition
- EU transport in figures
Database
- Transport (cpc_tr)
- Candidate countries and potential candidates: transport (cpc_transp)
- Transport, see:
- Multimodal data (tran)
- Transport, volume and modal split (tran_hv)
- Railway transport (rail)
- Railway transport measurement - Goods (detailed data based on Directive 80/1177/EC or Regulation (EC) 91/2003) (rail_go)
- Road transport (road)
- Road transport infrastructure (road_if)
- Road freight transport measurement (road_go)
- Inland waterways transport (iww)
- Inland waterways transport measurement - goods (iww_go)
- Inland waterways transport measurement - goods - annual data (iww_go_a)
- Inland waterways transport measurement - goods (iww_go)
- Maritime transport (mar)
- Maritime transport - main annual results (mar_m)
Dedicated section
Methodology / Metadata
External links
Notes
- ↑ This designation is without prejudice to positions on status, and is in line with UNSCR 1244 and the ICJ Opinion on the Kosovo Declaration of Independence.