Archive:Security and investigation services statistics - NACE Rev. 2
- Data from April 2013. Most recent data: Further Eurostat information, Main tables and Database.
This article presents an overview of statistics for the security and investigation services sector in the European Union (EU), as covered by NACE Rev. 2 Division 80.
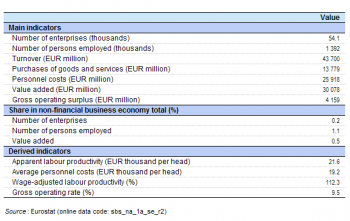
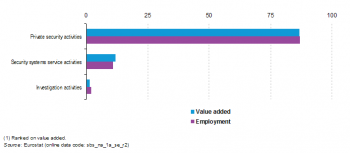
(% share of sectoral total) - Source: Eurostat (sbs_na_1a_se_r2)


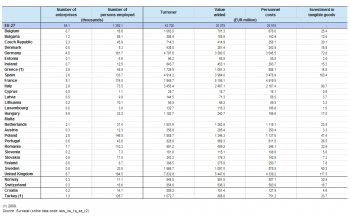
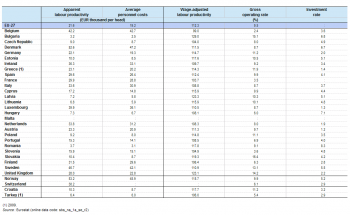

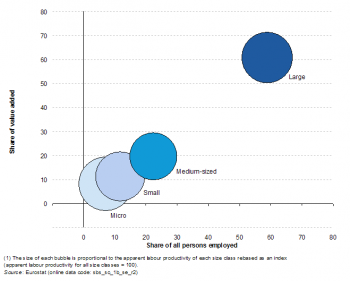
(% share of sectoral total) - Source: Eurostat (sbs_sc_1b_se_r2)
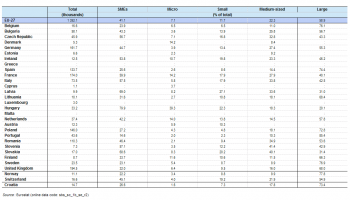
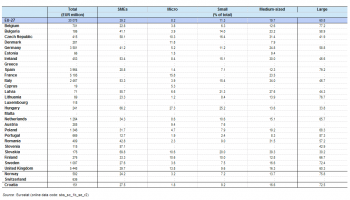
Main statistical findings
Structural profile
There were 54 thousand enterprises operating within the security and investigation services (Division 80) sector in the EU-27 in 2010. They employed 1.39 million persons, which was equivalent to 1.1 % of the total workforce within the non-financial business economy (Sections B to J and L to N and Division 95) or slightly more than 1 in 10 (10.8%) of those employed in administrative and support services (Section N). EU-27 security and investigation services enterprises generated EUR 30.1 billion of value added which was equivalent to 0.5 % of the non-financial business economy total or 7.9 % of the administrative and support services total.
The apparent labour productivity of the EU-27’s security and investigation services sector in 2010 was EUR 21.6 thousand of value added per person employed, which was just under half of the non-financial business economy average (EUR 44.8 thousand) and some EUR 7.4 thousand below the administrative and support services average. As such, the security and investigation services sector recorded the fourth lowest level of apparent labour productivity among all of the NACE divisions that constitute the non-financial business economy.
Alongside this very low level of apparent labour productivity, average personnel costs within the EU-27’s security and investigation services sector were also relatively low at EUR 19.2 thousand per employee in 2010, some EUR 11.7 thousand below the average for the non-financial business economy and EUR 2.4 thousand lower than the average for administrative and support services. EU-27 average personnel costs for the security and investigation services sector were the joint fourth lowest — along with leather and related products manufacturing (Division 15) — across all of the NACE divisions within the non-financial business economy.
The wage-adjusted labour productivity ratio combines the two previous indicators and shows the extent to which value added per person employed covers average personnel costs per employee. With both of these indicators being very low for the security and investigation services sector they largely cancelled each other out when compared with benchmark values such as those for the non-financial business economy. However, with apparent labour productivity being proportionally lower than average personnel costs this resulted in a wage-adjusted labour productivity ratio for the EU-27’s security and investigation services sector of 112.3 %, somewhat inferior to the non-financial business economy average (144.8 %) or the administrative and support services average (137.0 %).
The gross operating rate (the relation between the gross operating surplus and turnover) is one measure of operating profitability; it stood at 9.5 % for the EU-27’s security and investigation services sector in 2010, which was broadly in line with the non-financial business economy average (10.1 %), but lower than the administrative and support services average (16.0 %).
Sectoral analysis
Almost 7 in every 10 enterprises (68.1 %) within the EU-27’s security and investigation services sector were classified as operating within the private security activities (Group 80.1) subsector, while just under one in five (18.3 %) operated within the security systems service activities subsector (Group 80.2), leaving the residual (13.6 %) engaged in investigation activities (Group 80.3).
In terms of output (as measured by value added) and persons employed, the relative importance of private security activities was more pronounced, as this subsector accounted for 86.8 % of sectoral value added and for 87.0 % of the sectoral workforce. The majority of the remainder was accounted for by the security systems service activities subsector, with an 11.8 % share of added value and an 11.0 % share of the workforce. Investigation activities accounted for no more than 2.0 % of sectoral value added or employment.
The low apparent labour productivity figure for the whole of the security and investigation services sector was a pattern repeated across all three subsectors, as this ratio ranged from a high of EUR 23.2 thousand of added value per person employed for the EU-27’s security systems service activities subsector to a low of EUR 14.9 thousand per person employed for investigation activities; the latter was the third lowest level of apparent productivity among any of the NACE groups that constitute the non-financial business economy.
Average personnel costs mirrored the pattern for apparent labour productivity insofar as they were consistently well below the non-financial business economy average for all three security and investigation services subsectors. The lowest level of EU-27 average personnel costs was recorded for investigation activities (EUR 12.8 thousand per employee in 2010); this latter figure was the second lowest level of average personnel costs per employee for any of the NACE groups that constitute the non-financial business economy — behind only beverage serving activities (Group 56.3).
All three security and investigation services subsectors also reported EU-27 wage-adjusted labour productivity ratios in 2010 that were considerably below the non-financial business economy average of 144.8 %. These ranged from 120.4 % for the security systems service activities subsector down to 111.4 % for the largest subsector, private security activities.
There was little difference between the two subsectors for which data are available in relation to the gross operating rate. The lowest operating profitability rate (using this measure) was recorded for the EU-27’s private security activities subsector, at 9.1 % in 2010. This was just below the non-financial business economy average (10.1 %). By contrast, operating profitability was just above the non-financial business economy average for security systems service activities (10.8 %); no information is available for investigation activities.
Country analysis
The United Kingdom accounted for an 18.1 % share of EU-27 value added within the security and investigation services sector in 2010. The United Kingdom also recorded the highest share of EU-27 added value for the private security activities subsector (19.4 %), while France had the biggest share of the security systems service activities subsector (22.9 %) and Italy for the investigation activities subsector (23.4 %).
In relative terms, the value added generated by the security and investigation services sector in 2010 accounted for 1.1 % of non-financial business economy added value in Bulgaria, the highest share among those EU Member States for which data are available; Estonia, Latvia, Portugal and Romania all reported shares of 0.9 %. Although the share of the security and investigation services sector in Spanish non-financial business economy value added was somewhat lower (0.8 %), the security and investigation services sector recorded the second highest specialisation ratio within the Spanish non-financial business economy. At the other end of the range, the least specialised Member States in relation to the security and investigation services sector included Denmark, Cyprus and Austria, where this activity generated no more than 0.2 % of value added within the whole of the non-financial business economy. Within the non-member countries for which data are available, the relative weight of the security and investigation services sector was lower than the EU-27 average (0.5 %) in Norway and in Switzerland, while Croatia and Turkey (data are for 2009) were somewhat more specialised in this activity, as it accounted for 0.7 % of their total value added in the non-financial business economy.
The United Kingdom was also the leading employer within the security and investigation services sector, as its workforce of 194.5 thousand persons was equivalent to 14.0 % of the EU-27 total in 2010, followed by France (12.5 %), Germany (11.6 %) and Poland (10.5 %); each of these three Member States had a workforce of more than 145 thousand persons.
All of the EU Member States for which data are available in 2010, reported wage-adjusted labour productivity ratios for security and investigation services that were above 100 %, other than in Belgium (99.0 %). However, none of the Member States recorded wage-adjusted labour productivity ratios for the security and investigation services sector that were higher than their non-financial business economy averages. The highest wage-adjusted labour productivity ratios were recorded in Bulgaria (129.0 %), Latvia (123.3 %) and the United Kingdom (123.1 %).
For the gross operating rate, there was a wider range of values, with around one third of the EU Member States for which data are available reporting that they had a higher profitability rate for security and investigation services than they did for their respective non-financial business economies. This was most evident in Bulgaria, where the gross operating rate for security and investigation services reached 15.2 %, some 5.7 percentage points higher than the Bulgarian non-financial business economy average. Slovakia reported a higher gross operating rate (16.4 %) but this figure was just 4.4 percentage points higher than the non-financial business economy average. By contrast, the lowest gross operating rate was recorded in Belgium (2.4 %), compared with a non-financial business economy average of 8.3 %.
Size class analysis
The relative importance of the four different enterprise size classes within the EU-27’s security and investigation activities sector rose as a function of average enterprise size. Large enterprises (employing 250 or more persons) accounted for a majority (58.9 %) of the sectoral workforce and for an even higher share (60.8 %) of sectoral added value in 2010. The second highest shares were recorded for medium-sized enterprises (employing 50 to 249 persons); they accounted for about one fifth of total activity, with a 22.3 % share of sectoral employment and a 19.7 % share of sectoral value added.
Among those EU Member States for which data are available, about two thirds reported that large enterprises accounted for more than half of their security and investigation activities workforce in 2010. Large enterprises were particularly prominent, in terms of their employment share, in Portugal (85.4 % of the sectoral workforce), while in excess of 7 out of 10 persons were also employed by large enterprises in Sweden, Belgium, Spain and Poland. The prevalence of large enterprises was also apparent in the non-member countries for which data are available, as they provided 77.8 % and 73.4 % of the security and investigation activities workforce in Norway and Croatia. As such, the contribution of large enterprises to the Norwegian workforce was 19.1 percentage points higher than the EU-27 average, which was the second largest difference (across all NACE divisions that compose the non-financial business economy) between the large enterprises share of sectoral employment in Norway and the EU-27.
By contrast, at the other end of the ranking there were two EU Member States — Slovakia and Latvia — where the relative importance of large enterprises was just over 30 %, while the lowest share was recorded in Hungary, where barely one in five persons occupied in the security and investigation activities sector worked for a large enterprise (20.1 %).
There was a fairly narrow range in the productivity ratios recorded for each of the different size classes within the EU-27 security and investigation activities sector in 2010. Apparent labour productivity was highest at either end of the scale: micro enterprises (with fewer than 10 persons employed) generated, on average, EUR 25.1 thousand of value added per person employed, while the corresponding value for large enterprises was just EUR 2.7 thousand lower.
Data sources and availability
The analysis presented in this article is based on the main dataset for structural business statistics (SBS) and size class data, all of which are published annually.
The main series provides information for each EU Member State as well as a number of non-member countries at a detailed level according to the activity classification NACE. Data are available for a wide range of variables.
In structural business statistics, size classes are generally defined by the number of persons employed. A limited set of the standard structural business statistics variables (for example, the number of enterprises, turnover, persons employed and value added) are analysed by size class, mostly down to the three-digit (group) level of NACE. The main size classes used in this article for presenting the results are:
- small and medium-sized enterprises (SMEs): with 1 to 249 persons employed, further divided into;
- micro enterprises: with less than 10 persons employed;
- small enterprises: with 10 to 49 persons employed;
- medium-sized enterprises: with 50 to 249 persons employed;
- large enterprises: with 250 or more persons employed.
Context
This article presents an overview of statistics for the security and investigation services sector in the EU, as covered by NACE Rev. 2 Division 80. It includes security-related services such as private security services, security systems services and investigation activities. Private security activities include the provision of guard and patrol services, protected pick-up, transit and delivery of valuable items (including money), bodyguard services and fingerprinting services. Security systems service activities include monitoring of electronic security alarm systems (such as burglar and fire alarms) including their installation and maintenance. Also included are installing, repairing, rebuilding, and adjusting mechanical or electronic locking devices, safes and security vaults in connection with later monitoring and remote monitoring. Investigation activities include investigation and detective services regardless of the type of client or purpose of investigation.
This NACE division is composed of three groups:
- private security activities (Group 80.1);
- security systems service activities (Group 80.2);
- investigation activities (Group 80.3).
Public order and safety activities, which form part of public administration and defence; compulsory social security (Division 84) are excluded, as are the installation or sale of security systems without later monitoring — which form part of specialised construction activities (Division 43) and retail trade (Division 47). Also excluded are services of security consultants, which from part of other professional, scientific and technical activities (Division 74).
See also
- Administrative and support service activities
- Other analyses of the business economy by NACE Rev. 2 sector
- Structural business statistics introduced
Further Eurostat information
Publications
- European business - facts and figures (online publication)
Main tables
Database
- SBS – services (sbs_serv)
- Annual detailed enterprise statistics - services (sbs_na_serv)
- Annual detailed enterprise statistics for services (NACE Rev.2 H-N and S95) (sbs_na_1a_se_r2)
- Preliminary results on services, main indicators (NACE Rev.2) (sbs_sc_r2preli)
- SMEs - Annual enterprise statistics broken down by size classes - services (sbs_sc_sc)
- Services broken down by employment size classes (NACE Rev.2 H-N and S95) (sbs_sc_1b_se_r2)
- Annual detailed enterprise statistics - services (sbs_na_serv)
- SBS - regional data - all activities (sbs_r)
- SBS data by NUTS 2 regions and NACE Rev.2, from 2008 onwards (sbs_r_nuts06_r2)
Dedicated section
Source data for tables and figures (MS Excel)
Other information
- Decision 1578/2007/EC of 11 December 2007 on the Community Statistical Programme 2008 to 2012
- Regulation 295/2008 of 11 March 2008 concerning structural business statistics