Archive:Agricultural income per worker
- Data from December 2013, most recent data: Further Eurostat information, Main tables.
According to first estimates, real agricultural income per worker in the European Union (EU) has decreased by 1.3% in 2013, following a increase of 0.3% in 2012. This decline results from a reduction in real agricultural income (-2.1%), together with a fall in agricultural labour input (-0.9%). These estimates for the EU are based on data supplied by the national authorities in the Member States.
Main statistical findings
First estimates for 2013: down by 1.3% on the previous year
The decrease in EU28 real agricultural income in 2013 is mainly the result of higher increase in real terms in input costs producer prices (-10.5%), than in the value of the outputof the agricultural sector at producer prices (+0.1%).
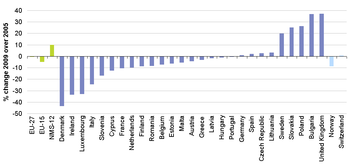
Real agricultural income per worker in 2013 is estimated to have risen in fifteen Member States and to have fallen in thirteen. The largest falls are expected in Estonia (-17.2%), France(-16.4%) and Croatia(-16.2%), and the highest rises in the Netherlands (+11.4%), Romania, (+10.4%) and Spain (+10.0%).
In 2013, the value of EU agricultural output at producer prices is estimated to have increased by 0.1%, mainly due to a increase in real terms in the value of animal output crop production (+1.5%) and a decrease in the value of crop production animal production (-1.1%).
- Declining crop prices: In crop production, the decrease in value is due to a decline in prices (-3.7%), while the volume is expected to increase(+2.7%). Volumes fell for olive oil (-30.6%), sugar beet (-4.5%), fresh vegetables (-1.7%) and plant & flowers (-1.1%), but rose for potatoes (+1.1%), cereals (+6.1%), oilseeds (+6.6%), fruits (+6.9%) and wine
(+7.2%). Prices declined for oilseeds (-15.4%), cereals (-13.7%), sugar beet (-2.9%) and plants & flowers (-1.8%), while they rose for fresh vegetables (+1.1%), fruits (+2.3%), wine (+2.8%), potatoes (+15.2%) and olive oil (+20.5%).
- Increase in prices for animal production: The increase in the value of animal production is due to an increase in prices (+1.6%) while volume remained stable. Volumes fell for sheep & goats (-2.2%), cattle (-0.9%) and pigs (-0.7%), but rose for milk (+0.1%), poultry (+0.9%) and eggs (+3.7%). Prices fell for eggs (-17.2%) and sheep & goats (-2.7%), while they rose for cattle(+0.8%), pigs (+1.7%), poultry (+2.7%) and milk (+5.8%).
- Increasing input costs: EU28 agricultural input costs (intermediate consumption) are estimated to have risen by 0.8% in real terms, mainly due to an increase in value for feedingstuffs (+1.0%), maintenance of materials (+2.0%) and seeds & planting stocks (+2.5%).
Between 2005 and 2013, EU-28 real income per worker is estimated to have increased by 29.2%. On average, agricultural labour input in the EU-28 has fallen by 20.8% since 2005.
Data sources and availability
Estimated results for agricultural income and labour input are submitted by Member States for the year in question by the end of November the same year and by the end of February the following year. Final data are submitted in September, 9 months after the end of the year.
Context
European Commission Rural development policy aims to improve competitiveness in agriculture and forestry, the environment and the countryside, as well as to improve the quality of life in rural areas, and to encourage the diversification of rural economies.
As agriculture has been modernised and the importance of industry and services within the economy has increased, agriculture has become much less important as a source of jobs. Consequently, increasing emphasis is placed on the role farmers can play in rural development, including forestry, biodiversity and the diversification of the rural economy, in order to create alternative jobs and provide environmental protection in rural areas.
The FSS continues to adapt in order to provide timely and relevant data to help analyse and follow these developments.
See also
Further Eurostat information
Publications
- Eurostat Newsrelease 66/2010, 7 May 2010 - Employment in the agriculture sector down by 25% between 2000 and 2009
- Statistics in focus 18/2010, 7 May 2010 - EU Agricultural Income down 11.6% in 2009
- Eurostat Newsrelease 186/2009, 18 December 2009 - EU27 real agricultural income per worker down by 12.2%
Main tables
- Agriculture (t_agri), see:
- Economic Accounts for Agriculture (t_aact)

