Archive:Household consumption expenditure - national accounts
- Data from September 2008, most recent data: Further Eurostat information, Main tables and Database.
The final consumption expenditure of households encompasses all domestic costs (by residents and non-residents) for individual needs. Among other things, it includes expenditure on goods and services, the consumption of garden produce and rent for owner-occupied dwellings.
This article explains the individual components of household consumption expenditure, which vary widely among Member States due to cultural, economic and several other factors affecting spending and saving habits.
Main statistical findings
Household consumption habits vary substantially among the European Union (EU) Member States. Factors such as culture, income, weather, household composition, economic structure and degree of urbanization can all influence habits in each country.
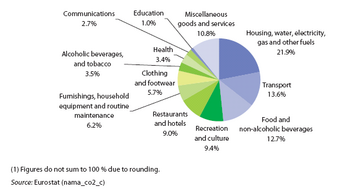
National accounts data also reveals that a little over one-fifth (21.9 %) of total household consumption expenditure in the EU in 2006 was devoted to housing, water, electricity, gas and other housing fuels. Expenditure on transport (13.6 %) and food and non-alcoholic beverages (12.7 %) together accounted for a little more than one-quarter of total households consumption expenditure, making these the next two most important categories in the EU.
Household budget survey
Both the Household budget survey (HBS) and national accounts provide a far more detailed breakdown of these aggregated consumption expenditure statistics.
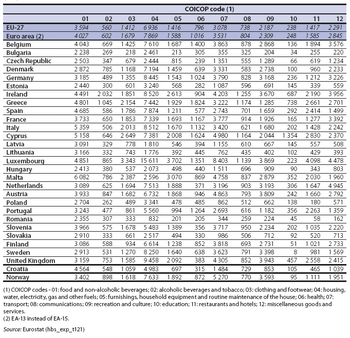
The HBS shows that household expenditure devoted to each consumption categories varied greatly among Member States in 2005. The highest proportion of the mean consumption expenditure of households (in PPS) spent on housing, water, electricity, gas and other fuels in 2005 was recorded in Sweden (32.2 %), which was about three times as high as in Malta (9.1 %). The proportion of household consumption spent on food and non-alcoholic beverages was highest in Member States where household incomes were lowest; in Romania such items accounted for 44.2 % of the mean consumption expenditure of households, compared with a 9.3% average in Luxembourg.
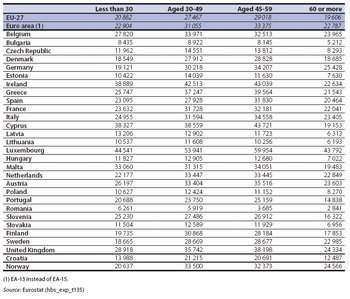
Household consumption expenditure was also reflected in certain broad socio-demographic patterns. The mean consumption expenditure of households whose head was aged 30 to 59 years old tended to be much higher than the equivalent expenditure of households whose head was either aged under 30 or over 60. In several Member States that joined the EU since 2004, average household consumption expenditure of households headed by a person aged under 30 was generally much closer to the expenditure of households headed by someone of an older working age (30 to 59), and in Latvia and Romania was higher.
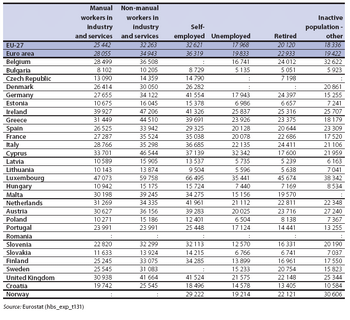
Households headed by self-employed or non-manual workers in industry and services in the Eu had, on average, the highest mean consumption expenditure of about PPS 32 500 in 2005, with that of households headed by manual workers about 25 % lower.
Income-expenditure link
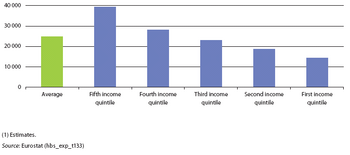
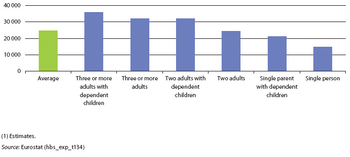
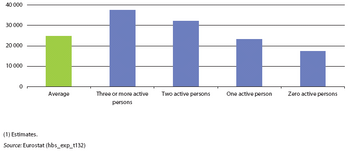
As may be expected, there was a strong link between household income and expenditure across the EU; the 20 % of households with the highest incomes spent an average of about two and three-quarters times more than the poorest 20 % of households in 2005. There was also a strong correlation between average household consumption expenditure, the size of households and the number of active persons in the household. Household consumption expenditure was highest in households with three or more adults with dependent children and lowest within single person households; households with three or more active persons spent more than households with no active persons. Nevertheless, in both cases the relationship was not linear: economies of scale (for example, sharing a flat or a car, heating a room, etc.) may, at least to some degree, explain why the expenditure of a single person is generally considerably more than half the expenditure of a couple.
Data sources and availability
Information on consumption expenditure, according to the Classification of individual consumption by purpose (COICOP), comes from 3 sources in the Database part of Eurostat’s website:
- the Household budget survey (HBS), see Living conditions and social protection,
- Consumption expenditure of private households (hbs)
- Mean consumption expenditure of private households (hbs_exp)
- Structure of mean consumption expenditure (hbs_struc)
- National accounts (na), see Annual national accounts (nama),
- National Accounts detailed breakdowns (by industry, by product, by consumption purpose) (nama_brk)
- Final consumption expenditure of households by consumption purpose (COICOP) (nama_co)
- Final consumption expenditure of households by consumption purpose - COICOP 2 digit - aggregates at current prices (nama_co2_c)
- Final consumption expenditure of households by consumption purpose - COICOP 2 digit - volumes (nama_co2_k)
- Final consumption expenditure of households by consumption purpose - COICOP 2 digit - price indices (nama_co2_p)
- Final consumption expenditure of households by consumption purpose - COICOP 3 digit - aggregates at current prices (nama_co3_c)
- Final consumption expenditure of households by consumption purpose - COICOP 3 digit - volumes (nama_co3_k)
- Final consumption expenditure of households by consumption purpose - COICOP 3 digit - price indices (nama_co3_p)
- Final consumption expenditure of households by consumption purpose (COICOP) (nama_co)
- Harmonized indices of consumer prices (HICP) (prc_hicp)
- HICP - Item weights (prc_hicp_inw)
The first two provide information both on amounts and on the structure, whilst the last only provides a structure of expenditure. In fact the HBS shows amounts per household and per adult equivalent in PPS, whilst the NA shows data in current prices and volumes as well as price indices. Obviously the three sources are related, however they show some differences, due to the way they are collected, to differing definitions and to the timeliness they are published.
As its name implies the HBS is a survey which is run on a sample of households in the participating countries and collected, aggregated and published by Eurostat on a gentlemen’s agreement. In all the countries, sharing common accommodation and expenditures is a prerequisite for a group of persons to be considered a household. In addition, many countries include the share of a common budget in their definition of household. Big institutions like hospitals, hotels, institutes and prisons are excluded from this survey.
National accounts (NA) data are compiled through a variety of statistical sources; such as HBS, business surveys, foreign trade statistics and VAT statistics. NA also uses slightly different definitions. Final consumption expenditure of households on detailed COICOP levels is estimated according to the "domestic" concept. It consists of expenditure on goods and services incurred by resident and non-resident households on the economic territory. On an aggregated level, National accounts also publishes Final consumption expenditure of households according to the "national" concept, meaning it includes expenditure by resident households both on the economic territory and abroad (and excludes expenditure by non-resident households on the economic territory). The national concept of final consumption is used in the GDP expenditure approach.
Finally in order to arrive at the structure of consumption expenditure, which is then used to compile the weights used for the estimation of the consumer price index (CPI), in many cases the HICP uses both information coming from the HBS but this is adjusted by using other sources like the NA. One has to note here that in the HICP, imputed rent is not accounted for while in the other two sources it is.
Another important difference comes from the timeliness in publication of the results. National accounts publishes quarterly data on aggregate level and annual data for detailed COICOP levels, the HICP updates its weights annually, and although in many countries the HBS is run on an annual basis, in some it is run on a five year basis so Eurostat only collects, aggregates and publishes this information on a five year cycle, normally with a 2 year time lag.
Now what are the pros and cons one has to consider in using each source? The HBS deals strictly with the households and all the information is brought directly from them. Besides information on consumption expenditure, there is also information on income, place of residence, and some characteristics of the reference person. There are some doubts on the accuracy or at least completeness in reporting on what are considered as “sin consumption” like prostitution, drug addiction, alcohol, and tobacco. This would not have an effect on the amounts reported for the other divisions of the COICOP; however it will have an effect on the structure of expenditure. Besides this, another handicap for this source is the frequency that it is collected and the timeliness by which it is published. Finally, since this survey is run on a gentlemen’s agreement, no one is in a position to dictate certain standards. Having said this, huge steps have been taken in harmonization by the participating countries, resulting in this survey achieving a high level of quality.
National accounts relies on several sources for estimating the consumption expenditure, both from demand and supply sides. Member States are legally obliged to transmit the data to Eurostat. Besides this, this information is published much more frequently and is more recent then the HBS. The major issue with this source is that since it covers expenditure from a macro level, expenditure cannot be correlated with characteristics pertaining to different households.
Finally, the HICP tries to take into account and make good for the weaknesses in the previous two sources by using adjustment techniques to calculate the weights to be used in the estimation of the index. Besides, it produces figures on an annual basis. The issues for contention in this source may be that it produces only the structure and that it does not include imputed rent.
Table 5, which represents the structure of expenditure according to the different sources, highlights the similarities and the differences between them. Actually, in the National accounts, no structure is formally published but it can be easily compiled by taking the expenditure per COICOP division, divided by the total expenditure.
Context
Consumption expenditure is the activity in which persons acting either individually or collectively, uses goods or services to satisfy their needs and wants. A household’s economic well-being can be expressed in terms of its access to goods and services. The more that can be consumed, the higher the level of economic wellbeing, though the relationship between the two is not a linear one. Measuring consumption expenditure might therefore be a way of measuring economic well-being.
Studies of consumption investigate how and why society and individuals consume goods and services, and how this affects society and human relationships. Contemporary studies focus on meanings of goods and the role of consumption in identity making. Traditionally, consumption was seen as rather unimportant compared to production, and the political and economic issues surrounding it. However, with the development of a consumer society, increasing consumer power in the market place, the growth in marketing, advertising, sophisticated consumers, ethical consumption etc, it is recognized as central to modern life.
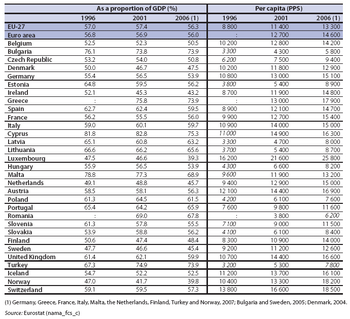
In National accounts, final consumption expenditure of households is the biggest component of the expenditure approach of GDP. Its evolution allows an assessment of purchases made by households, reflecting changes in wages and other incomes, but also in employment and in the behavior towards savings.
Further Eurostat information
Publications
Main tables
- National accounts, see:
- Annual national accounts
- National Accounts detailed breakdowns (by industry, by product, by consumption purpose)
- Final consumption expenditure of households by consumption purpose
- National Accounts detailed breakdowns (by industry, by product, by consumption purpose)
Database
- National accounts, see:
- Annual national accounts
- National Accounts detailed breakdowns (by industry, by product, by consumption purpose)
- Final consumption expenditure of households by consumption purpose
- National Accounts detailed breakdowns (by industry, by product, by consumption purpose)
Other information
- COICOP-HBS 1997 (Classification of Individual Consumption by Purpose)
