Archive:Retail trade statistics - NACE Rev. 2
- Data from April 2012. Most recent data: Further Eurostat information, Main tables and Database.
This article presents an overview of statistics for the retail trade sector in the European Union (EU), as covered by NACE Rev. 2 Division 47. Retailing is typically the final stage of the distribution chain from producers to consumers. Since the development of the internet, there has been an increasing use of web-based commerce. As such, there has been a gradual shift from traditional methods of purchasing from stores or markets towards purchasing remotely.
(% share of sectoral total) - Source: Eurostat (sbs_na_dt_r2)


(%) - Source: Eurostat (sbs_na_dt_r2)
Main statistical findings
Structural profile
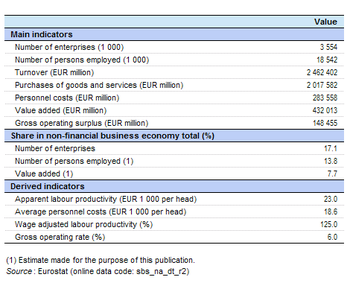
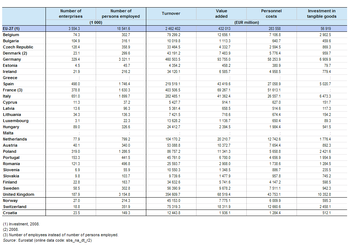
At the NACE division level the retail trade sector (Division 47) was the largest within the EU-27’s non-financial business economy (Sections B to J and L to N and Division 95) in terms of numbers of enterprises and persons employed and the second largest in terms of turnover and value added, behind wholesale trade (Division 46). The EU-27’s retail trade sector's turnover was valued at EUR 2 462.4 billion [1], from which EUR 432.0 billion of value added was generated, equivalent to 11.2 % and 7.7 % of the totals for the non-financial business economy. There were 3.6 million retail trade enterprises in the EU-27 and they employed 18.5 million persons, equivalent to 17.1 % of all enterprises in the non-financial business economy and13.8 % of the non-financial business economy workforce. From these shares the main characteristics of the retail trade sector can be derived: namely, that there were a very large number of enterprises, generally having a small average size, producing a relatively high level of turnover but less value added.
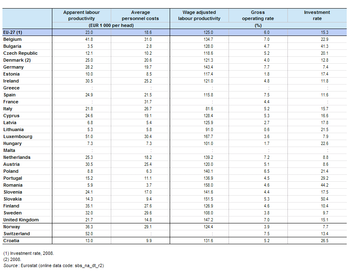
The apparent labour productivity of the EU-27's retail trade sector in 2009 was EUR 23 thousand per person employed, well below the non-financial business economy average of EUR 41.6 thousand per person employed and the distributive trades average of EUR 33 thousand per person employed. This was the lowest apparent labour productivity among the three distributive trades NACE divisions and the fifth lowest (again among NACE divisions) within the non-financial business economy. This low apparent labour productivity was accompanied by low average personnel costs, EUR 18.6 thousand per employee, again far below the non-financial business economy and distributive trades averages (EUR 30.0 thousand and EUR 25.0 thousand per employee respectively) and the sixth lowest level for this ratio among any of the non-financial business economy NACE divisions.
Apparent labour productivity and average personnel costs are both calculated relative to the level of employment based on a head count of workers; there is a relatively high propensity to employ persons on a part-time basis within retail trade and therefore a simple head count of employment over-states the level of labour input when compared with other sectors where part-time employment is less prevalent. The wage-adjusted labour productivity ratio combines the two previous indicators and thereby reduces the impact of the incidence of part-time work. This indicator shows the extent to which value added covers personnel costs, while adjusting for the ratio of paid employees to the total number of persons employed. Although the wage-adjusted labour productivity ratio of 125.0 % for the EU-27’s retail trade sector in 2009 remained below the non-financial business economy average (138.8 %) and the distributive trades average (133.2 %), it was much closer, in relative terms, than was the case for apparent labour productivity and average personnel costs.
The gross operating rate (the relation between the gross operating surplus and turnover) was 6.0 % for the EU-27’s retail trade sector in 2009. Due to the very high turnover inherent in retail trade this rate was relatively low compared with the non-financial business economy average (9.7 %), but it was above the distributive trades’ average (5.1 %).
Sectoral analysis
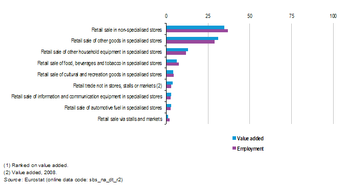
Within the EU-27 as a whole, retail sale in non-specialised stores (Group 47.1) contributed more than one third (34.8 %) of retail trade value added in 2009, while retail trade in specialised stores (Groups 47.2 to 47.7) accounted for 60.2 % and retail sale not in stores (Groups 47.8 and 47.9) the remainder. In employment terms, the shares were broadly similar, with a slightly lower share for retail sale in specialised stores and higher shares for the other two aggregates.
Within retail trade in specialised stores, the largest activity in the EU-27 was the retail sale of other goods in specialised stores (Group 47.7) with 31.1 % of all retail trade value added in 2009 – as such, this activity accounted for more than half of the value added generated in specialised store retailing; it includes, for example, the retailing of clothing, footwear, jewellery, pharmaceuticals, cosmetics, medical products, garden products and second-hand goods. Among the remaining in-store specialised retail activities the largest concerned the retailing of other household equipment (Group 47.5), food, beverages and tobacco (Group 47.2), and cultural and recreation goods (Group 47.6). The two remaining activities for in-store specialised retailing concerned the retail of information and communication (ICT) equipment (Group 47.4) and automotive fuel (Group 47.3).
Retail trade outside of stores was split between retail sale via stalls and markets (Group 47.8) which contributed about 1.0 % of total retail trade value added and the larger activity of retail trade not in stores, stalls or markets (Group 47.9) – which includes, for example, mail-order houses – it contributed 3.8 % to total retail trade value added (2008 data).
The low apparent labour productivity figure for the whole of the EU-27’s retail trade sector was observed across all of the retail subsectors in 2009, except for retail trade not in stores, stalls or markets which recorded an average of EUR 34 thousand of value added per person employed, which was above the distributive trades average. The lowest apparent labour productivity among the nine subsectors was recorded for retail sale via stalls and markets where apparent labour productivity was just EUR 11 thousand per person employed, the lowest figure recorded across all of the NACE groups within the non-financial business economy; this particularly low ratio may again be influenced by part-time employment, for example, when trading only takes place a few days a week (market days). Among the seven other subsectors, apparent labour productivity ranged from EUR 19 thousand per person employed for the retail sale of food, beverages and tobacco in specialised stores to EUR 27 thousand per person employed for the retail sale of information and communication equipment in specialised stores. A ranking of the subsectors according to average personnel costs for the EU-27 showed the same subsectors at each extreme, with average personnel costs per employee ranging from EUR 13.4 thousand for retail sale via stalls and markets to EUR 26.0 thousand for retail trade not in stores, stalls or markets; the latter was again the only retail trade subsector to record a value above the distributive trades average.
As noted above, the wage-adjusted labour productivity ratio is less influenced by the incidence of part-time employment. Nevertheless, the EU-27 retail sale via stalls and markets subsector still recorded the lowest value by far (81.4 %), which was the second lowest among all NACE groups within the non-financial business economy in 2009, higher only than for building completion and finishing (Group 43.3). The remaining eight retail trade subsectors recorded EU-27 wage-adjusted labour productivity ratios above 100 % in 2009, ranging from 113.2 % for the retail sale of other household equipment in specialised stores to 150.7 % for the retail sale of automotive fuel in specialised stores; the latter was the only retail trade subsector where the wage-adjusted labour productivity ratio exceeded the average ratios for distributive trades and the non-financial business economy.
Whereas the retail sale via stalls and markets subsector recorded the lowest productivity ratios within the EU-27’s retail trade sector in 2009, it also recorded the highest gross operating rate (16.3 %) and was thereby the only retail trade subsector with a rate above the non-financial business economy average. Most of the remaining retail subsectors recorded gross operating rates above the distributive trade average (5.1 %), the exceptions being retail sales in non-specialised stores (4.1 %) and the retail sale of automotive fuel in specialised stores (3.3 %).
Country analysis
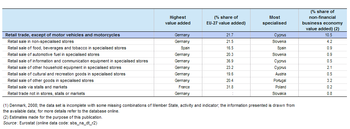
Retail trade is, by definition, a household-oriented service activity and retail trade enterprises often serve a local market. As such, there is relatively little specialisation in the activity as a whole and so it is unsurprising that the five Member States with the largest populations also contributed the most to EU-27 totals: Germany (21.7 % of EU-27 value added), France (16.0 %), the United Kingdom (15.9 %), Spain (10.1 %), Italy (9.6 %). In relative terms, the most specialised Member State was Cyprus where 10.5 % of non-financial business economy value added in 2009 resulted from retail trade activities. Other Member States that were relatively specialised in retail trade were Portugal and Spain, as the retail trade sector contributed 9.0 % of non-financial business economy value added and Latvia where the share was 8.8 %. The least specialised Member States, in value added terms, were the Czech Republic and Hungary, where the retail trade share of non-financial business economy value added was 5.6 %; in Norway the share was lower still, at 4.8 %.
Two Member States recorded wage-adjusted labour productivity ratios below 100 % for the retail trade sector in 2009, namely Lithuania (91.0 %) and Italy (81.6 %), while all Member States, except for Slovenia, recorded wage-adjusted labour productivity ratios that were below their average ratios for the non-financial business economy. The gross operating rate for retail trade was also systematically lower than the average rate for the non-financial business economy in all Member States, ranging from 0.6 % in Lithuania to 7.7 % in Germany.
Focus on retail trade turnover specialisations
Due to the specific nature of retail trade, namely selling goods without transformation to final consumers, an analysis of turnover is of particular interest.
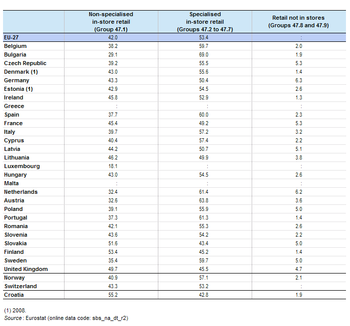
Specialised in-store retailing (Groups 47.2 to 47.7) generated just over half (53.4 %) of retail trade turnover in 2009 in the EU-27, while non-specialised in-store retailing (Group 47.1) generated 42.0 % of the total; retailing not in-stores (Groups 47.8 and 47.9) accounted for the remainder. While retail trade as a whole is not an activity with strong specialisations between Member States, an analysis of turnover for these three regroupings does indicate a certain specialisation in different retailing formats between Member States. The turnover share in 2009 of specialised in-store retailing was highest in Sweden (59.7 %), Belgium (also 59.7 %), Spain (60.0 %), Portugal (61.3 %), the Netherlands (61.4 %), Austria (63.8 %) and Bulgaria (69.0 %) and lowest in Slovakia (43.4 %). In contrast, the turnover share of non-specialised retailing was highest in Estonia (48.1 %), the United Kingdom (49.7 %), Slovakia (51.6 %) and Finland (53.4 %) and lowest in Luxembourg (18.1 %); it was higher still in Croatia (55.2 %). Retail trading not in stores was highest in Germany and the Netherlands where it was over 6.0 % of retail trade turnover, but it was less just 1.3 % in Ireland.
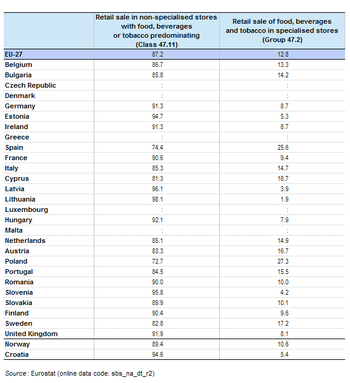
At a more detailed level, it is possible to analyse in-store retailing of food, beverages and tobacco, comparing on one hand specialised retailers of these products and on the other hand non-specialised retailers with food, beverages and tobacco predominating (Class 47.11). For the EU-27 as a whole, a 12.8 % share of the combined retail sales of these two activities was undertaken in specialised food, beverages and tobacco retail stores with the remainder in unspecialised stores with food, beverages and tobacco predominating. Among the Member States, the proportion of sales of these products in specialised stores rose to 27.3 % in Poland and 25.6 % in Spain, while it was as low as 5.3 % in Estonia, 4.2 % in Slovenia, 3.9 % in Latvia and 1.9 % in Lithuania.
Data sources and availability
The analysis presented in this article is based on the main dataset for structural business statistics (SBS) which are disseminated annually. The series provides information for each Member State as well as a number of non-member countries at a detailed level according to the activity classification NACE. Data are available for a wide range of variables.
Context
This article presents an overview of statistics for the retail trade sector in the EU, as covered by NACE Rev. 2 Division 47. This division includes the resale (sale without transformation) of new and used goods mainly to the general public for personal or household consumption or use. The sale is done in shops, department stores, from stalls, mail-order houses, or by door-to-door sales persons, hawkers, consumer cooperatives and so on.
Retail trade is classified first by type of outlet – distinguishing in-store retail trade from retail trade not in stores. Retail trade in stores is divided between non-specialised retail sale (for example, supermarkets or department stores) and specialised retail sale. These are then further subdivided with a distinction for non-specialised in-store retailing between stores with food, beverages or tobacco dominating and others, and a more detailed subdivision of specialised retail trade in stores based on the range of products sold. Retail sale not in stores is subdivided according to different forms of trade rather than the types of products sold. This division also includes retail sales by commission agents and activities of retail auctioning houses.
Handling that is customary in trade does not affect the basic character of the merchandise and may include, for example, sorting, separating, mixing and packaging.
This NACE division is composed of nine groups:
- retail sale in non-specialised stores (Group 47.1);
- retail sale of food, beverages and tobacco in specialised stores (Group 47.2);
- retail sale of automotive fuel in specialised stores (Group 47.3);
- retail sale of ICT equipment in specialised stores (Group 47.4);
- retail sale of other household equipment in specialised stores (Group 47.5);
- retail sale of cultural and recreation goods in specialised stores (Group 47.6);
- retail sale of other goods in specialised stores (Group 47.7);
- retail sale via stalls and markets (Group 47.8);
- retail trade not in stores, stalls or markets (Group 47.9).
The goods sold in this division are limited to goods usually referred to as consumer goods or retail goods. Therefore, goods not normally entering the retail trade sector, such as intermediate goods and industrial machinery are excluded. This division also excludes the sale of farmers' products by farmers (crop and animal production, hunting and related service activities, Division 01), the combined manufacture and sale of goods which is generally classified as a manufacturing activity (Divisions 10 to 32), the retail sale of motor vehicles, motorcycles and their parts and accessories (classified as part of the motor trades sector, Division 45), the sale of food and drinks for consumption on the premises and sale of takeaway food (included as part of food and beverage service activities, Division 56), or the renting of personal and household goods to the general public (which is part of the renting and leasing of goods, Division 77).
Further Eurostat information
Publications
Main tables
Database
- SBS – trade (sbs_dt)
- Annual detailed enterprise statistics – trade (sbs_na_dt)
- Annual detailed enterprise statistics for trade (NACE Rev.2 G) (sbs_na_dt_r2)
- Preliminary results on trade, main indicators (NACE Rev.2) (sbs_dt_r2preli)
- SMEs - Annual enterprise statistics broken down by size classes – trade (sbs_sc_dt)
- Distributive trades broken down by employment size classes (NACE Rev.2 G) (sbs_sc_dt_r2)
- Distributive trades broken down by size class of turnover (NACE Rev.2 G) (sbs_sctrn_dt_r2)
- Breakdown of turnover by product - trade (dt_cpa)
- Breakdown of turnover by product type for wholesale trade (NACE Rev.2 G46) (dt_cpa_n46_r2)
- Annual detailed enterprise statistics – trade (sbs_na_dt)
- SBS - regional data - all activities (sbs_r)
- SBS data by NUTS 2 regions and NACE Rev.2, from 2008 onwards (sbs_r_nuts06_r2)
Dedicated section
Source data for tables, figures and maps (MS Excel)
Other information
- Decision 1578/2007/EC of 11 December 2007 on the Community Statistical Programme 2008 to 2012
- Regulation 295/2008 of 11 March 2008 concerning structural business statistics
External links
See also
- Structural business statistics introduced
- Other analyses of the business economy by NACE Rev. 2 sector
- Distributive trades
Notes
- ↑ A billion is 1 000 million.
