Tutorials
Log in
Statistics Explained
menu
search
search
Navigation
Main page
Statistical themes
Glossary
Categories
Statistics 4 beginners
Tutorials
Help
Eurostat home
Education corner
Online publications
Regional yearbook
Sustainable development
Full list
Tools
User contributions
Logs
View user groups
Special pages
search
Navigation
Main page
Statistical themes
Glossary
Categories
Statistics 4 beginners
Tutorials
Help
Eurostat home
Education corner
Online publications
Regional yearbook
Sustainable development
Full list
Tools
User contributions
Logs
View user groups
Special pages
Navigation
Main page
Statistical themes
Glossary
Categories
Statistics 4 beginners
Tutorials
Help
Eurostat home
Education corner
Online publications
Regional yearbook
Sustainable development
Full list
Tools
User contributions
Logs
View user groups
Special pages
Uploads by Wahrila
This special page shows all uploaded files.
File list
Items per page:
20
50
100
250
500
Search for media name:
Username:
Include old versions of files
Go
First page
Previous page
Next page
Last page
Date
Name
Thumbnail
Size
Description
Versions
09:50, 20 June 2011
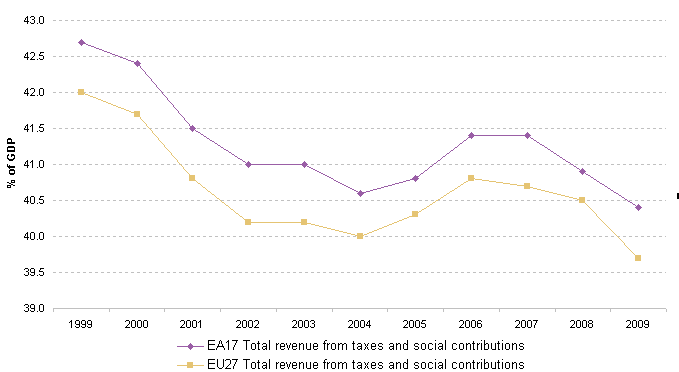
1 Total tax revenue in the EU-27 and euro area as a percentage of GDP.png
(
file
)
5 KB
1
11:00, 20 June 2011
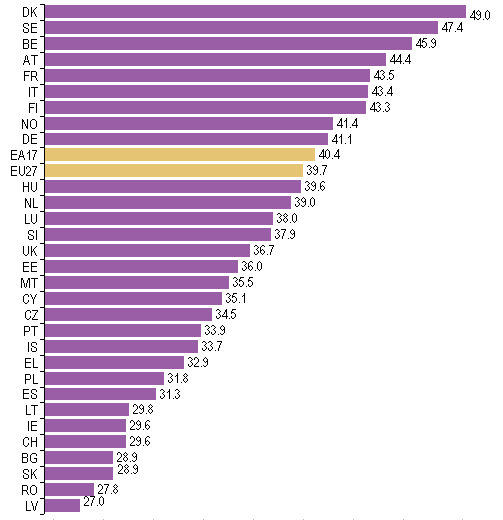
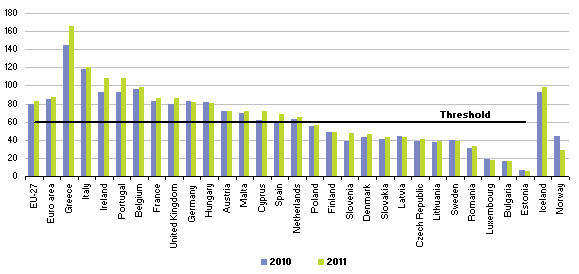
2 Ranking of total tax revenue by Member States and EFTA countries as a % of GDP.png
(
file
)
5 KB
1
13:14, 20 June 2011
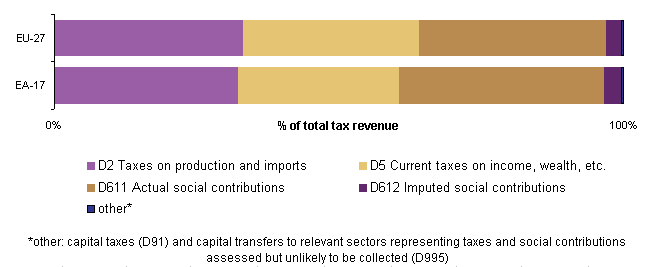
4 Composition of EU-27 and EA-17 tax revenue.png
(
file
)
4 KB
1
14:23, 20 June 2011
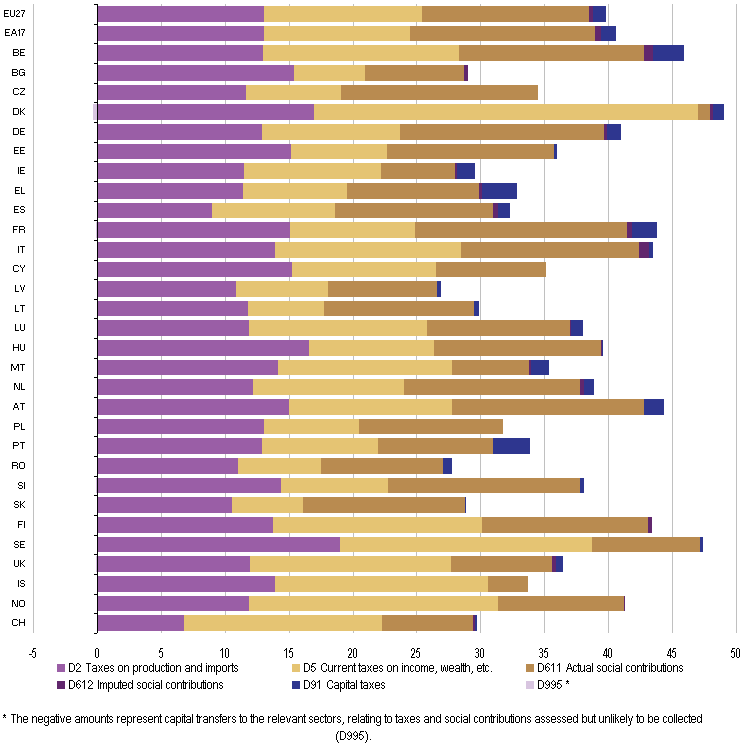
5 Breakdown of tax revenue by country and by main tax categories(percentage of GDP).png
(
file
)
12 KB
2
12:43, 10 August 2011
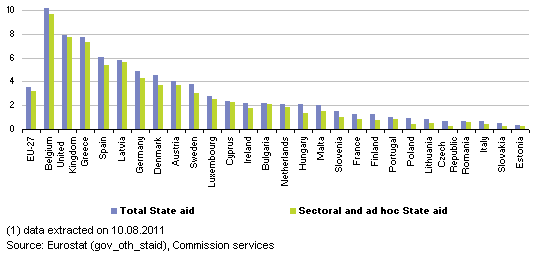
Figure 14 State aid, 2009 (% of GDP).png
(
file
)
4 KB
1
10:48, 12 August 2011
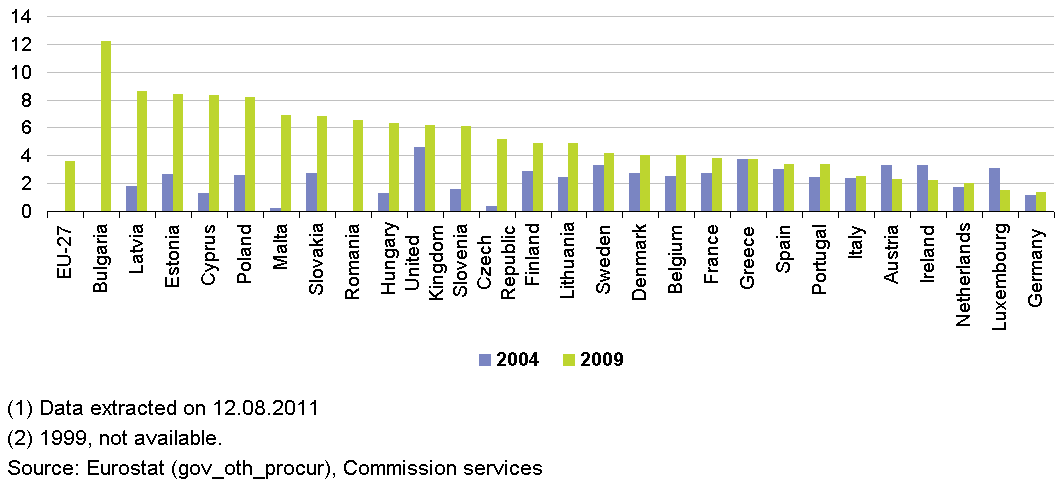
Figure 13 Public procurement (1) (value of public procurement which is openly advertised, as % of GDP).png
(
file
)
10 KB
2
07:51, 16 August 2011
Government finance 20110810.xls
(
file
)
382 KB
3
16:33, 21 October 2011
Government finance 20111021.xls
(
file
)
393 KB
2
11:48, 24 October 2011
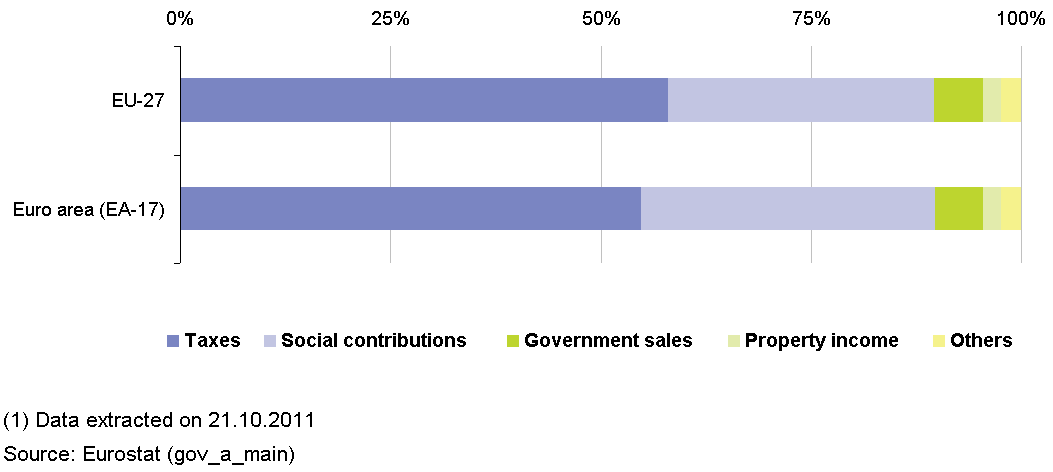
Figure 6 Composition of total revenue, 2010 (%).png
(
file
)
7 KB
2
11:48, 24 October 2011
Figure 7 Main components of government revenue, 2010 (%).png
(
file
)
14 KB
2
11:48, 24 October 2011
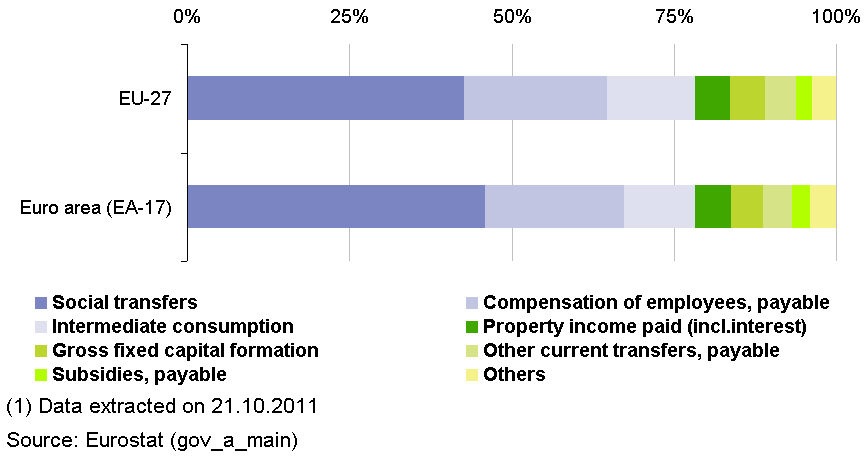
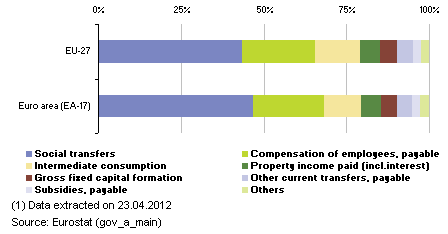
Figure 8 Composition of total expenditure, 2010 (% of total expenditure).png
(
file
)
9 KB
2
11:49, 24 October 2011
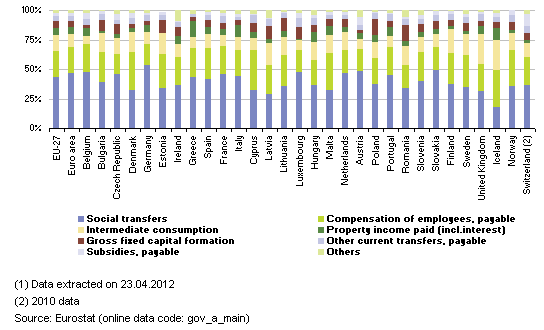
Figure 9 Main components of government expenditure, 2010 (% of total expenditure).png
(
file
)
16 KB
2
11:49, 24 October 2011
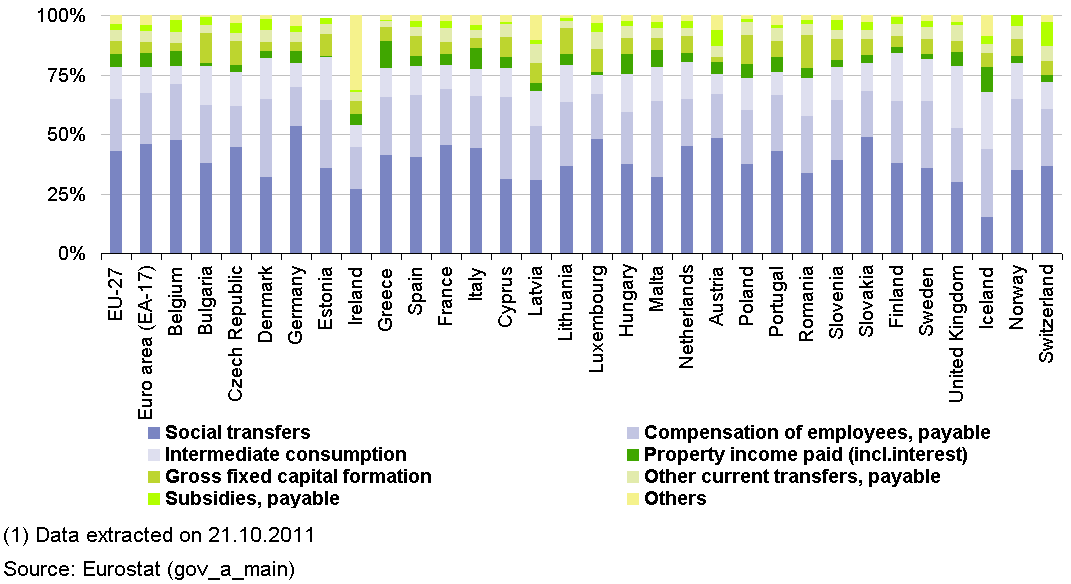
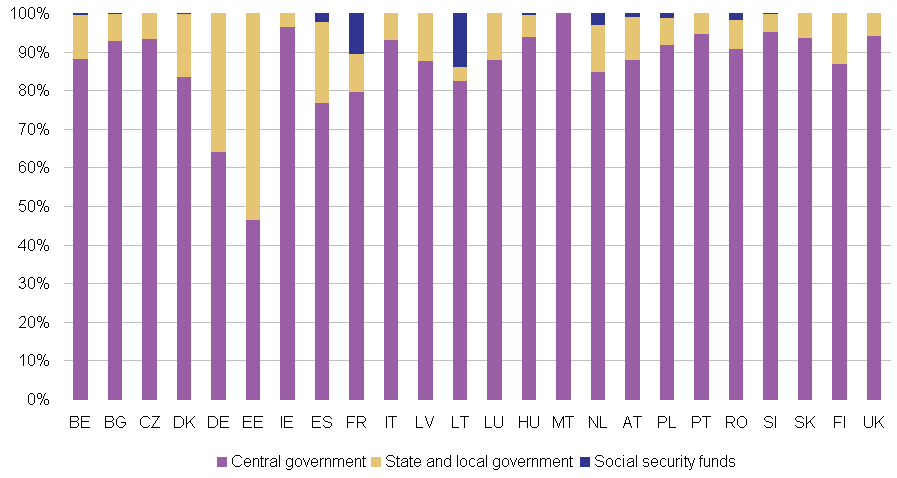
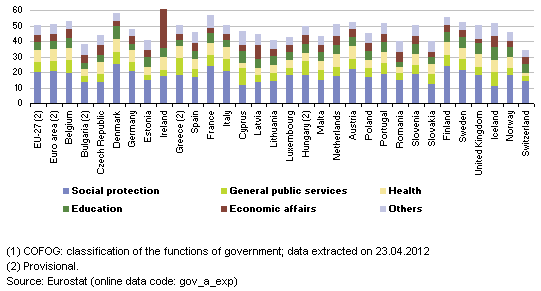
Figure 10 General government expenditure by COFOG function, 2009 (1) (% of GDP).png
(
file
)
15 KB
2
11:49, 24 October 2011
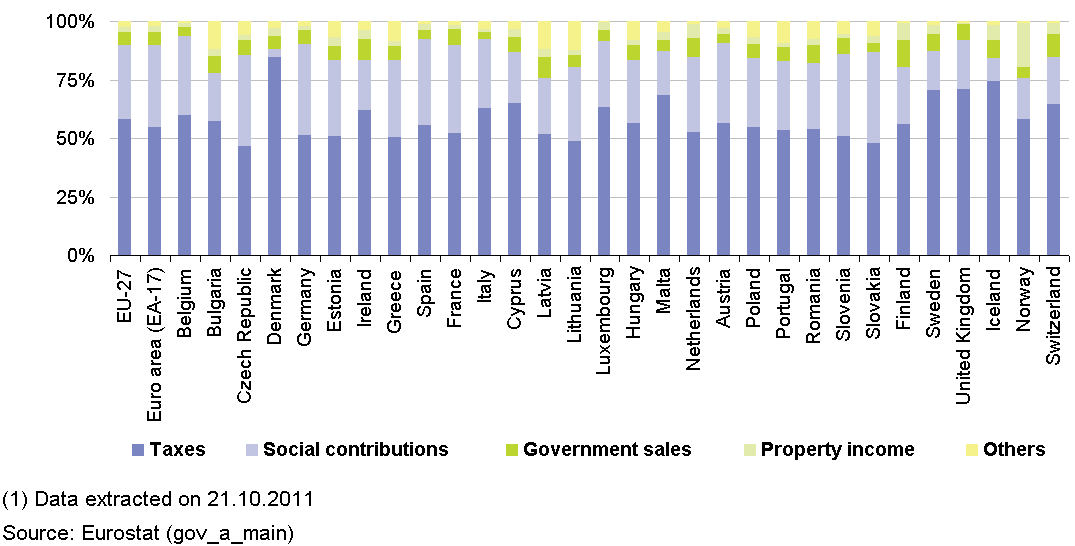
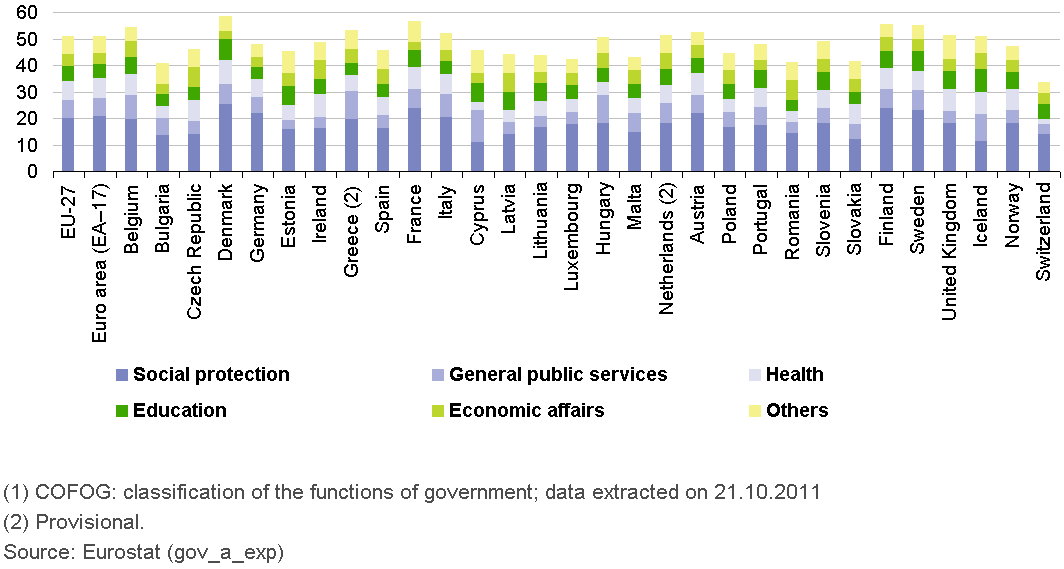
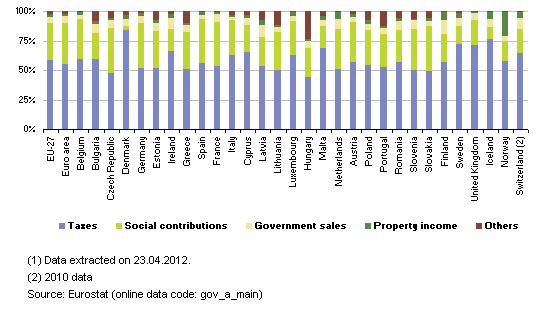
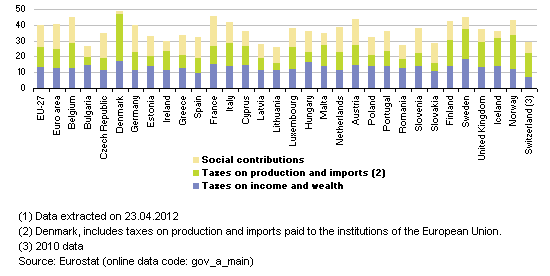
Figure 12 Main categories of taxes and social contributions, 2010 (1) (% of GDP).png
(
file
)
14 KB
2
11:50, 24 October 2011
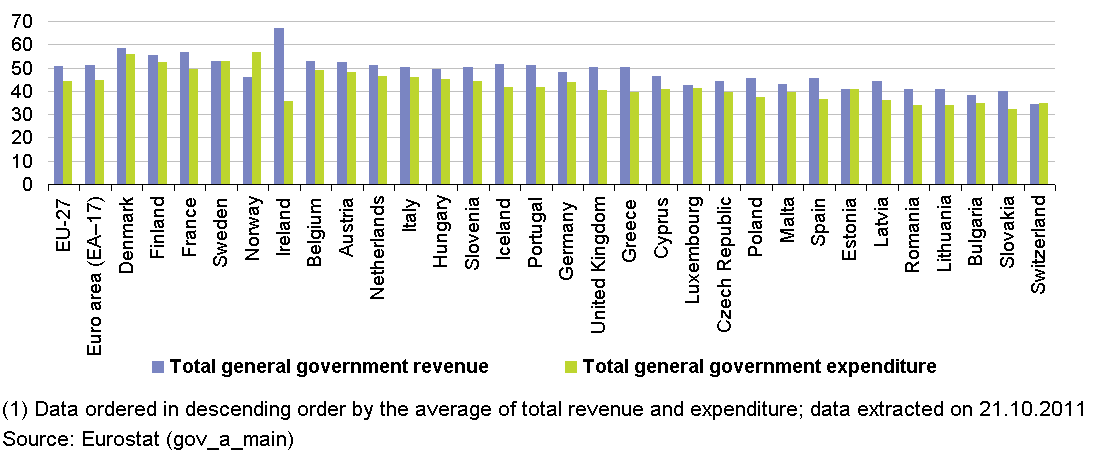
Figure 5 Government revenue and expenditure, 2010 (1) (% of GDP).png
(
file
)
13 KB
5
15:06, 19 December 2011
Debt by financial instrument, 2010.png
(
file
)
7 KB
1
15:06, 19 December 2011
Debt by subsector, 2010.png
(
file
)
8 KB
1
15:07, 19 December 2011
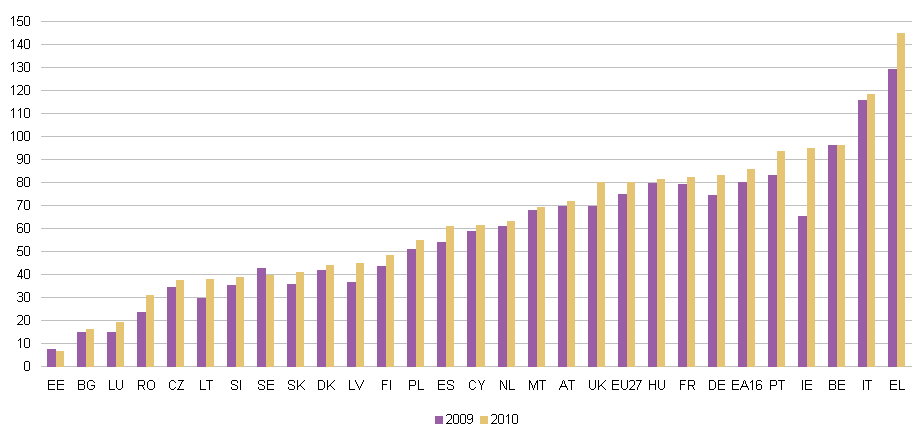
Maastricht Debt as a percentage of GDP, 2009-2010.png
(
file
)
5 KB
1
13:31, 5 January 2012
4 Composition of EU-27 and EA-17 tax revenue.PNG
(
file
)
4 KB
2
13:32, 5 January 2012
5 Breakdown of tax revenue by country and by main tax categories(percentage of GDP).PNG
(
file
)
9 KB
2
15:42, 5 January 2012
Tax revenue - tables.xls
(
file
)
297 KB
2
12:47, 27 January 2012
GFSdetail Web Oct2011.xls
(
file
)
1.45 MB
1
12:48, 27 January 2012
GFSTRTE SS web Oct2011.xls
(
file
)
1.66 MB
1
12:53, 27 January 2012
GFSSummaryTables Web Oct2011.xls
(
file
)
1.54 MB
2
12:49, 15 March 2012
TE by sub-sector 20120314.xls
(
file
)
74 KB
2
13:49, 23 April 2012
Figure 5 Government revenue and expenditure, 2011 (1) (% of GDP).png
(
file
)
5 KB
1
13:50, 23 April 2012
Figure 6 Composition of total revenue, (%).png
(
file
)
3 KB
1
13:50, 23 April 2012
Figure 7 Main components of government revenue, (%).png
(
file
)
5 KB
1
13:50, 23 April 2012
Figure 8 Composition of total expenditure, (% of total expenditure).png
(
file
)
3 KB
1
13:50, 23 April 2012
Figure 9 Main components of government expenditure, (% of total expenditure).png
(
file
)
7 KB
1
13:51, 23 April 2012
Figure 10 General government expenditure by COFOG function, (1) (% of GDP).png
(
file
)
6 KB
1
13:54, 23 April 2012
Figure 12 Main categories of taxes and social contributions, (1) (% of GDP).png
(
file
)
6 KB
2
17:35, 25 April 2012
Government debt 2010 2011.png
(
file
)
4 KB
3
17:35, 25 April 2012
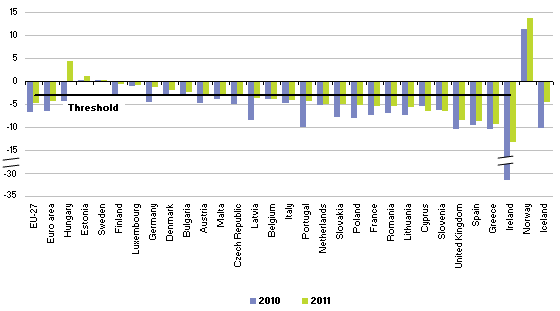
Government deficit 2010 2011.png
(
file
)
4 KB
4
10:51, 27 April 2012
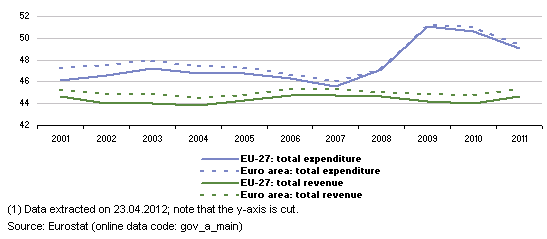
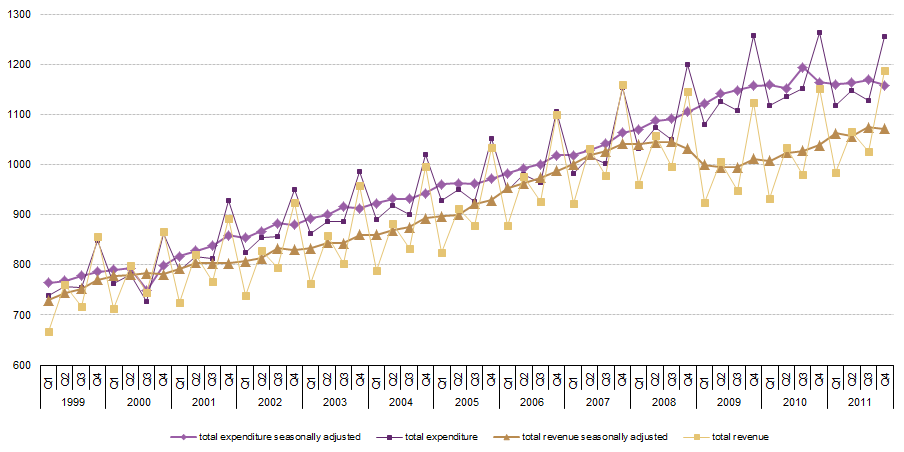
Figure 3 Development of total expenditure and total revenue (1) (% of GDP).png
(
file
)
3 KB
5
10:51, 27 April 2012
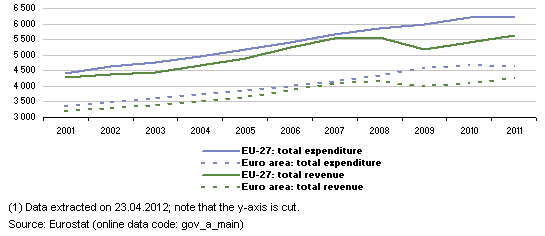
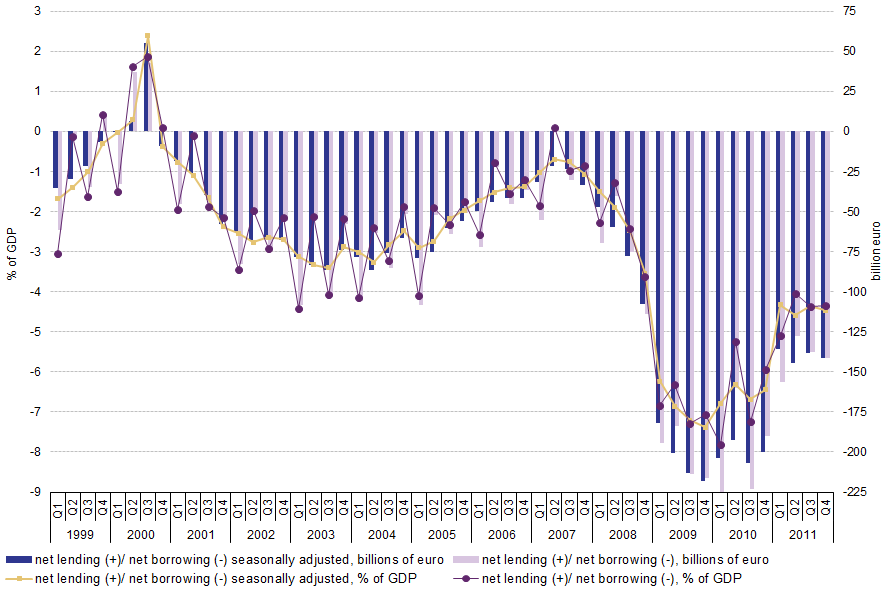
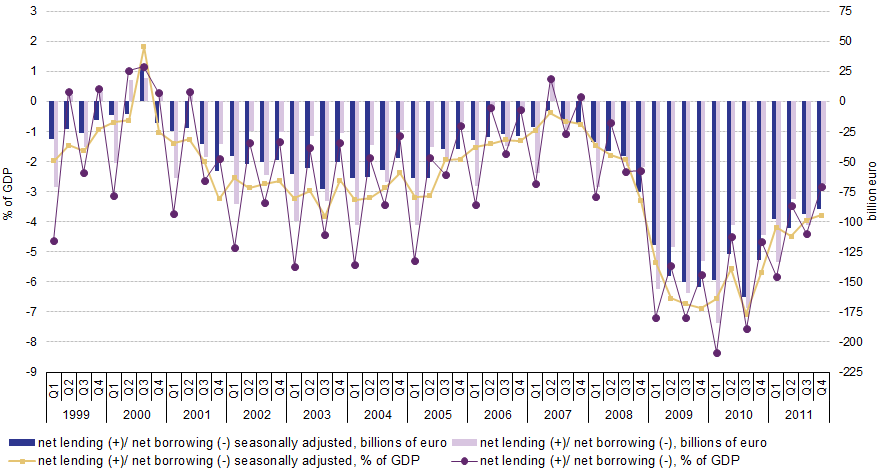
Figure 4 Development of total expenditure and total revenue (1) (billions of euro).png
(
file
)
3 KB
6
10:58, 27 April 2012
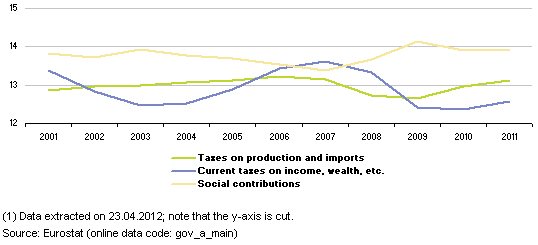
Figure 11 Main categories of Taxes and social contributions, EU-27 (1) (% of GDP).png
(
file
)
3 KB
6
10:59, 27 April 2012
Government finance statistics 20120423.xls
(
file
)
792 KB
7
11:36, 27 June 2012
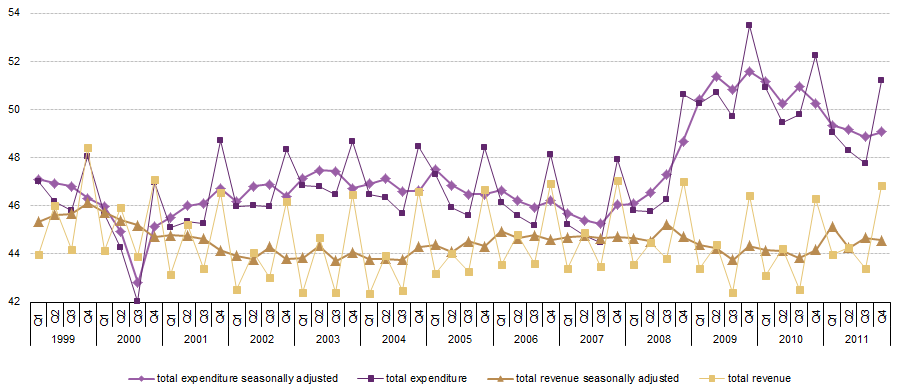
1 EU-27 TETR %GDP.png
(
file
)
38 KB
1
11:37, 27 June 2012
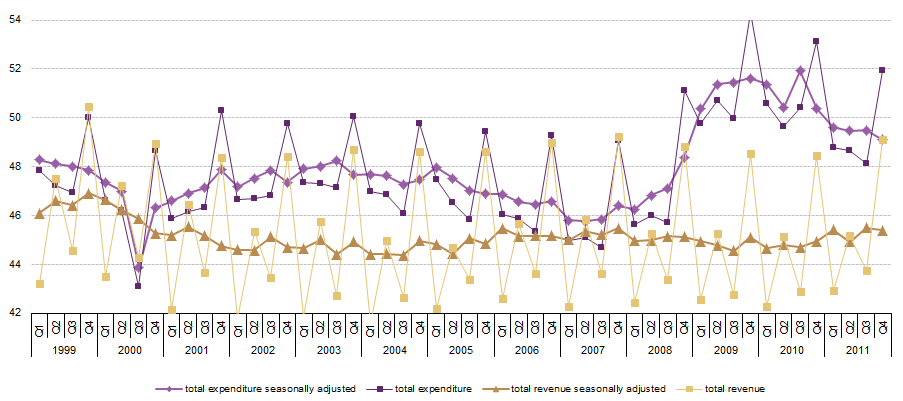
2 EA-17 TETR %GDP.png
(
file
)
46 KB
1
11:53, 27 June 2012
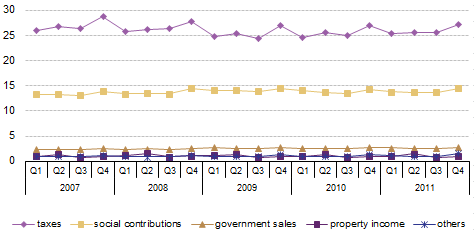
3 EU-27 revenue components.png
(
file
)
8 KB
1
11:54, 27 June 2012
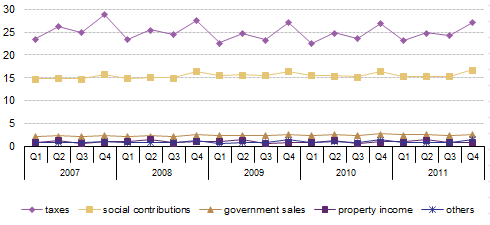
4 EA-17 revenue components.png
(
file
)
8 KB
1
11:54, 27 June 2012
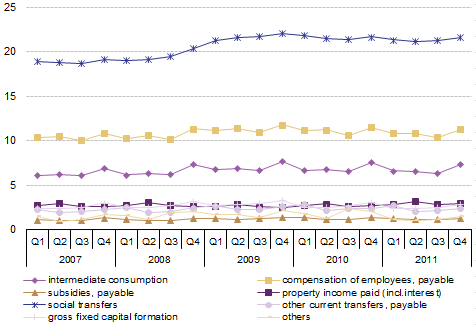
5 EU-27 expenditure components.png
(
file
)
13 KB
1
11:54, 27 June 2012
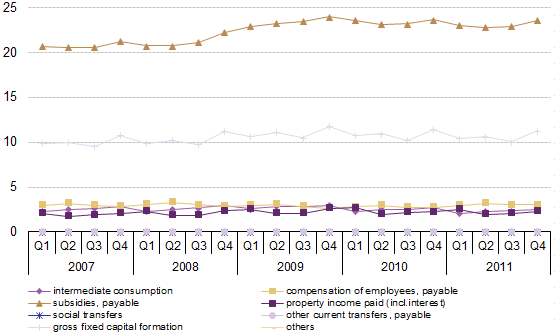
6 EA-17 expenditure components.png
(
file
)
11 KB
1
12:07, 27 June 2012
9 EU-27 B9.png
(
file
)
41 KB
1
12:07, 27 June 2012
10 EA-17 B9.png
(
file
)
38 KB
1
12:08, 27 June 2012
8 EA-17 TETR absolute.png
(
file
)
37 KB
1
13:43, 27 June 2012
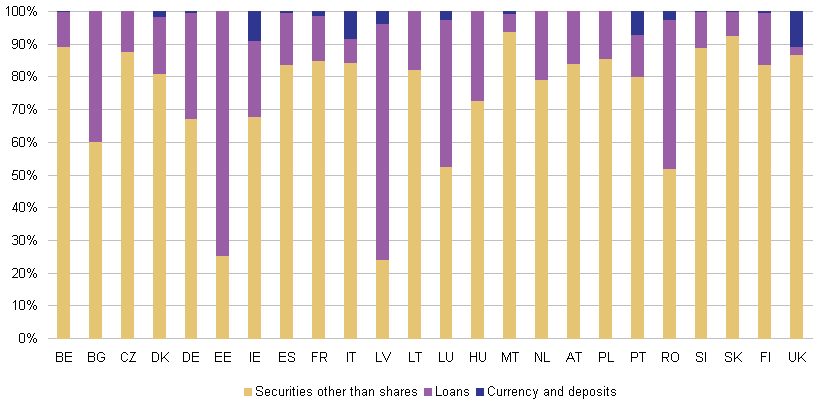
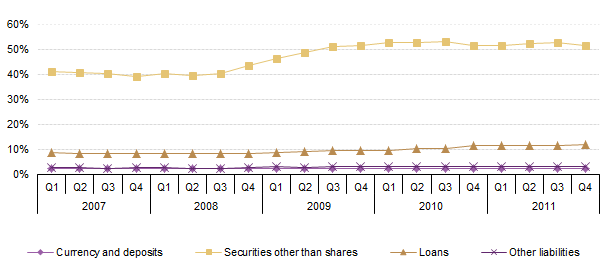
18 EA-17 stocks liabilities components.png
(
file
)
7 KB
1
13:44, 27 June 2012
17 EU-27 stocks liabilities components.png
(
file
)
7 KB
1
13:44, 27 June 2012
16 EA-17 stocks assets components.png
(
file
)
8 KB
1
First page
Previous page
Next page
Last page
Special page
ISSN 2443-8219


.png)
.png)
_(value_of_public_procurement_which_is_openly_advertised,_as_%25_of_GDP).png)
.png)
.png)
.png)
.png)
_(%25_of_GDP).png)
_(%25_of_GDP).png)
_(%25_of_GDP).png)


.PNG)
_(%25_of_GDP).png)
.png)
.png)
.png)
.png)
_(%25_of_GDP).png)
_(%25_of_GDP).png)


_(%25_of_GDP).png)
_(billions_of_euro).png)
_(%25_of_GDP).png)


