Tutorials
Log in
Statistics Explained
menu
search
search
Navigation
Main page
Statistical themes
Glossary
Categories
Statistics 4 beginners
Tutorials
Help
Eurostat home
Education corner
Online publications
Regional yearbook
Sustainable development
Full list
Tools
User contributions
Logs
View user groups
Special pages
search
Navigation
Main page
Statistical themes
Glossary
Categories
Statistics 4 beginners
Tutorials
Help
Eurostat home
Education corner
Online publications
Regional yearbook
Sustainable development
Full list
Tools
User contributions
Logs
View user groups
Special pages
Navigation
Main page
Statistical themes
Glossary
Categories
Statistics 4 beginners
Tutorials
Help
Eurostat home
Education corner
Online publications
Regional yearbook
Sustainable development
Full list
Tools
User contributions
Logs
View user groups
Special pages
Uploads by Sabadga
This special page shows all uploaded files.
File list
Items per page:
20
50
100
250
500
Search for media name:
Username:
Include old versions of files
Go
Date
Name
Thumbnail
Size
Description
Versions
16:17, 20 January 2015
Average number of inhabitants served by each post office, 2004 and 2011 (number).png
(
file
)
34 KB
Fig 3
1
16:18, 20 January 2015
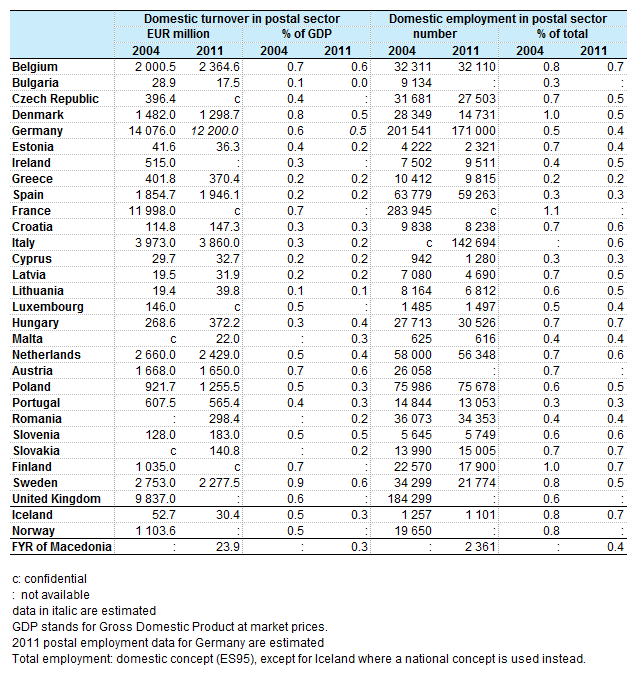
Domestic turnover and employment of the European postal market, 2004 and 2011 .png
(
file
)
55 KB
Tab 1
1
12:56, 21 January 2015
Selected indicators of the European postal market (2004, 2011).png
(
file
)
70 KB
Tab 2
1
13:00, 21 January 2015
Turnover from the domestic postal sector relative to GDP, 2004 and 2011 (% of GDP).png
(
file
)
40 KB
Fig 1
1
13:02, 21 January 2015
Number of persons employed in the domestic postal sector as share of total employment, 2004 and 2011 (%).png
(
file
)
34 KB
Fig 2
1
13:04, 21 January 2015
Average number of letter-post items per inhabitant, 2004 and 2011 (number).png
(
file
)
35 KB
Fig 4
1
13:06, 21 January 2015
Percentage of priority letters delivered on-time according to national performance indicators (domestic services), 2004 and 2011 .png
(
file
)
28 KB
Fig 5
1
17:13, 3 December 2015
ICT specialists in Europe, 2014.png
(
file
)
44 KB
1
17:25, 3 December 2015
ICT specialists in the EU-28, 2005-2014.png
(
file
)
16 KB
1
17:29, 3 December 2015
ICT specialists by level of education, by age and by gender.png
(
file
)
50 KB
1
17:35, 3 December 2015
ICT specialists versus total employment in the EU-28, growth rate (%).png
(
file
)
15 KB
1
17:41, 3 December 2015
ICT specialists by level of education, 2014.png
(
file
)
40 KB
1
17:42, 3 December 2015
ICT specialists by age group, 2014.png
(
file
)
40 KB
1
15:48, 14 December 2015
ICT specialists by age group, 2014 .png
(
file
)
40 KB
1
15:48, 14 December 2015
ICT specialists by gender, 2014.png
(
file
)
35 KB
3
15:49, 14 December 2015
ICT specialists by level of education, 2014 .png
(
file
)
40 KB
1
12:19, 15 December 2015
ICT specialists in employment.xlsx
(
file
)
55 KB
1
16:39, 5 January 2016
ICT specialists in the EU-28, 2005-2014 (in 1000s and as a % of total employment).png
(
file
)
18 KB
5
16:58, 5 January 2016
ICT specialists in employment.xls
(
file
)
54 KB
1
15:01, 8 February 2016
ICT specialists in Europe, 2014 (as a % of total employment).png
(
file
)
23 KB
4
14:45, 24 October 2016
ICT specialists by age group, 2015.png
(
file
)
56 KB
1
14:48, 24 October 2016
ICT specialists by gender, 2015.png
(
file
)
55 KB
1
15:25, 24 October 2016
ICT specialists by level of education, age and gender (as a % of the total employment of ICT specialists).png
(
file
)
61 KB
3
16:14, 24 October 2016
ICT specialists in employment 2015.xls
(
file
)
68 KB
1
16:42, 24 October 2016
Growth rate of employment of ICT specialists and of total employment, EU-28 (%).png
(
file
)
9 KB
3
Special page
ISSN 2443-8219
.png)

.png)
.png)
.png)
.png)
,_2004_and_2011_.png)


.png)


.png)
.png)


.png)
.png)