Tutorials
Log in
Statistics Explained
menu
search
search
Navigation
Main page
Statistical themes
Glossary
Categories
Statistics 4 beginners
Tutorials
Help
Eurostat home
Education corner
Online publications
Regional yearbook
Sustainable development
Full list
Tools
User contributions
Logs
View user groups
Special pages
search
Navigation
Main page
Statistical themes
Glossary
Categories
Statistics 4 beginners
Tutorials
Help
Eurostat home
Education corner
Online publications
Regional yearbook
Sustainable development
Full list
Tools
User contributions
Logs
View user groups
Special pages
Navigation
Main page
Statistical themes
Glossary
Categories
Statistics 4 beginners
Tutorials
Help
Eurostat home
Education corner
Online publications
Regional yearbook
Sustainable development
Full list
Tools
User contributions
Logs
View user groups
Special pages
Uploads by Peterle
This special page shows all uploaded files.
File list
Items per page:
20
50
100
250
500
Search for media name:
Username:
Include old versions of files
Go
First page
Previous page
Next page
Last page
Date
Name
Thumbnail
Size
Description
Versions
12:22, 2 September 2011
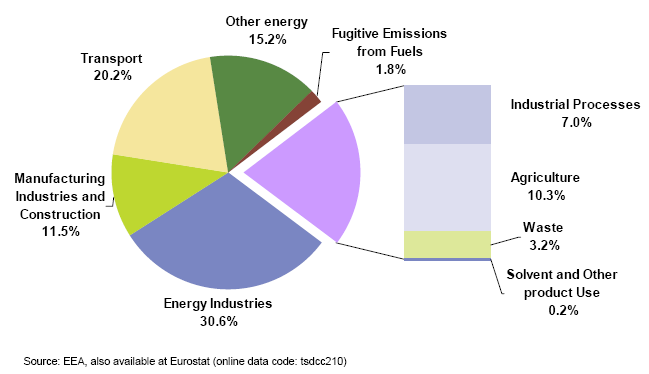
EU-27 greenhouse gas emissions by source sector 2009.PNG
(
file
)
22 KB
1
15:39, 13 September 2011
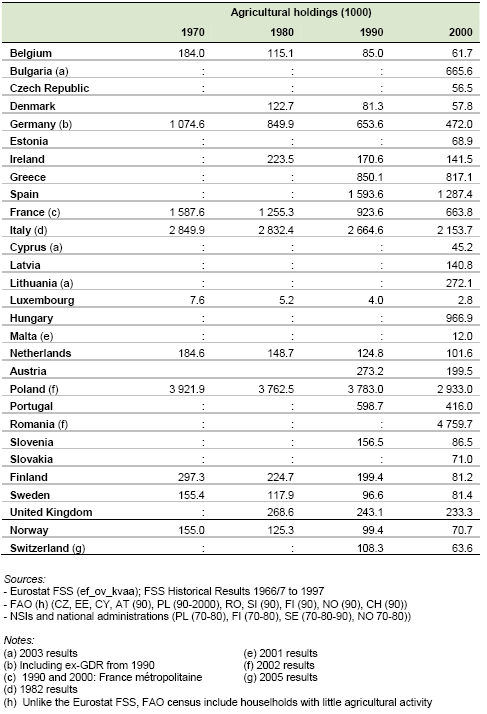
Agri Census 1970 2000.png
(
file
)
38 KB
3
15:41, 13 September 2011
Number of agricultural holdings in Agricultural censuses 1970-2000 (in 1000).png
(
file
)
38 KB
1
10:43, 23 September 2011
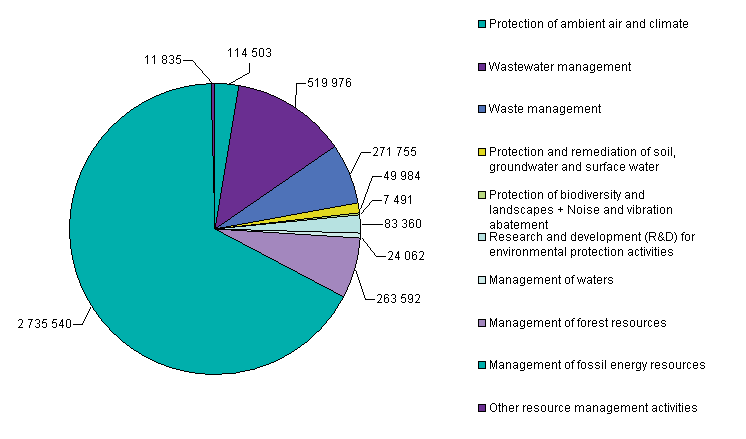
Environmental goods and services sector turnover by environmental domains in thousand euros, Germany 2007.png
(
file
)
8 KB
2
10:49, 23 September 2011
Corporations' turnover in environmental goods and services sector by environmental domains in thousand euros, Portugal 2007.png
(
file
)
10 KB
3
10:53, 23 September 2011
Corporations' value added in environmental goods and services by type of products, thousand euros, Romania 2006.png
(
file
)
4 KB
2
10:55, 23 September 2011
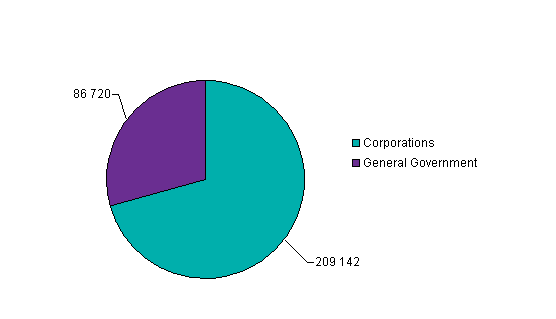
Employment in environmental goods and services sector, full time equivalent distributed by producer, France 2008.png
(
file
)
3 KB
2
10:57, 23 September 2011
Exports in environmental goods and services sector by environmental domain, thousand euros, Sweden 2006.png
(
file
)
9 KB
2
11:12, 23 September 2011
Turnover for Corporations' environmental specific and connected services, distribution by environmental domains, thousand euros, Latvia 2008.png
(
file
)
4 KB
2
11:18, 23 September 2011
Corporations' turnover in adapted goods, distribution by environmental domain, thousands of euro, Netherlands, 2007.png
(
file
)
4 KB
2
14:24, 29 September 2011
Figure 1 Estimated share of GHG emissions from three disposal treatment operations.PNG
(
file
)
4 KB
2
10:33, 28 October 2011
JVR EUEAagg 2011Q2 chart.PNG
(
file
)
8 KB
2
10:46, 28 October 2011
JVR by country 2011Q2 chart.PNG
(
file
)
7 KB
2
10:50, 28 October 2011
JVR by country 2011Q2 table.png
(
file
)
24 KB
2
10:52, 28 October 2011
Stat explained 2011q2.xls
(
file
)
88 KB
1
18:26, 23 November 2011
Overweight and obesity - men, by age.png
(
file
)
5 KB
2
18:28, 23 November 2011
Overweight and obesity - women, by age.png
(
file
)
5 KB
2
14:54, 9 December 2011
Volume indices of GDP per capita 2010 EU27=100.PNG
(
file
)
17 KB
1
15:30, 9 December 2011
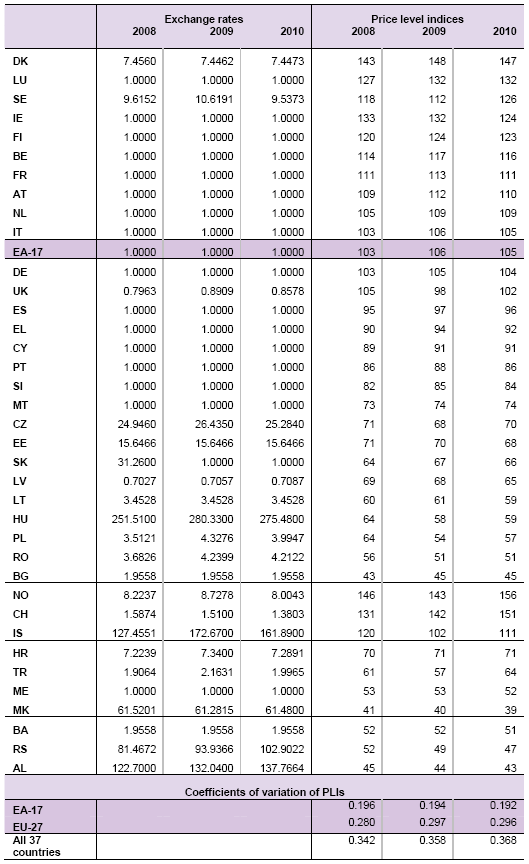
Exchange rates and price level indices for AIC, 2008-2010.PNG
(
file
)
47 KB
1
15:39, 9 December 2011
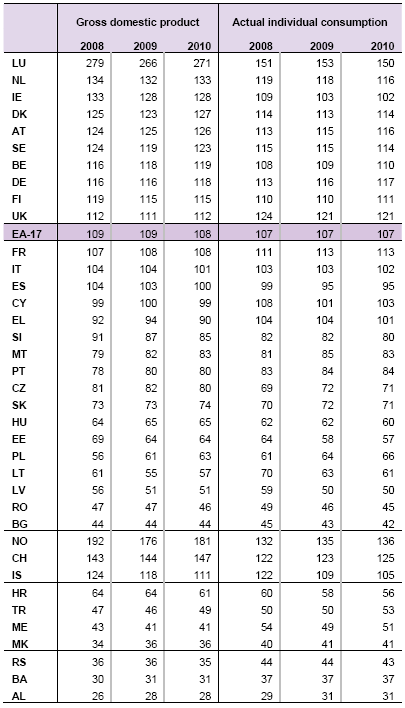
Volume indices per capita, 2008-2010.png
(
file
)
33 KB
1
16:45, 12 December 2011
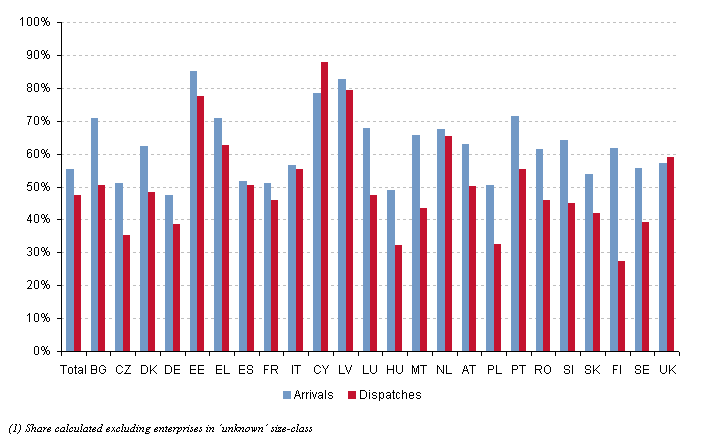
Share of SMEs in arrivals and dispatches, 2009.PNG
(
file
)
7 KB
1
16:59, 12 December 2011
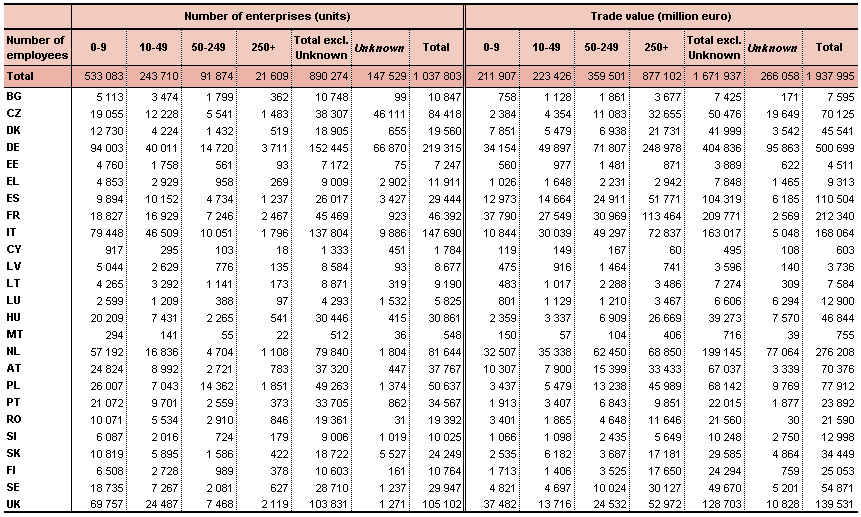
Total EU-27 arrivals and dispatches (1) by economic activity and enterprise size, 2009.PNG
(
file
)
16 KB
1
17:30, 12 December 2011
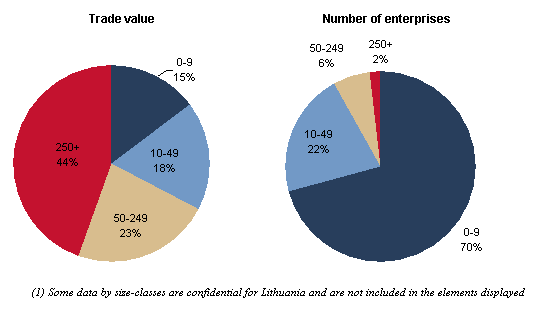
Countries’ total arrivals by enterprise size, 2009 (% of trade value and number of enterprises).PNG
(
file
)
5 KB
3
17:50, 12 December 2011
Countries’ total dispatches by enterprise size, 2009 (% of trade value and number of enterprises).PNG
(
file
)
5 KB
3
17:53, 12 December 2011
Arrivals by enterprise size, 2009.PNG
(
file
)
25 KB
3
17:55, 12 December 2011
Dispatches by enterprise size, 2009.PNG
(
file
)
24 KB
3
18:00, 12 December 2011
Trade balance by enterprise size, 2009 – thousand euro.PNG
(
file
)
6 KB
3
18:06, 12 December 2011
EU-27 total arrivals and dispatches by economic activity, 2009 (% of trade value and number of enterprises).PNG
(
file
)
4 KB
3
18:15, 12 December 2011
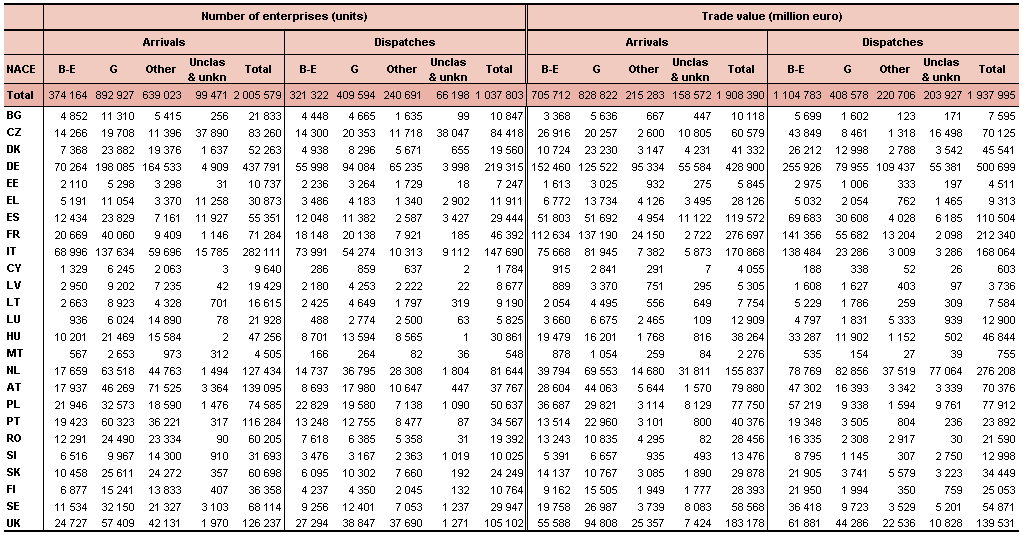
EU-27 arrivals and dispatches by economic activity, 2009.PNG
(
file
)
28 KB
3
17:05, 16 December 2011
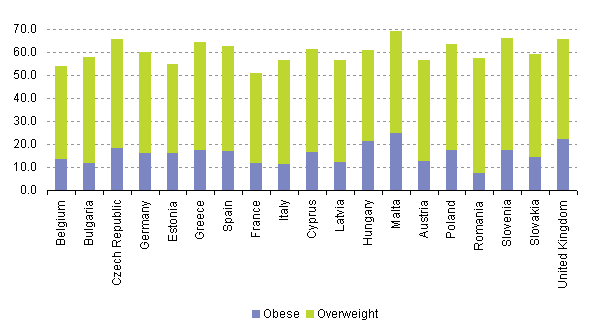
Overweight and obesity - women, 2008.png
(
file
)
4 KB
1
17:10, 16 December 2011
Overweight and obesity - men.png
(
file
)
5 KB
1
17:16, 16 December 2011
Overweight and obesity - women, by educ.png
(
file
)
4 KB
1
17:17, 16 December 2011
Overweight and obesity - men, by educ.png
(
file
)
5 KB
1
17:22, 16 December 2011
EHIS overweight obesity.xls
(
file
)
61 KB
2
18:24, 16 December 2011
Number of persons killed in railway accidents (2009 and 2010).PNG
(
file
)
9 KB
2
18:32, 16 December 2011
Train passengers killed per bllion passenger-km, (2009 and 2010).PNG
(
file
)
5 KB
2
14:50, 4 January 2012
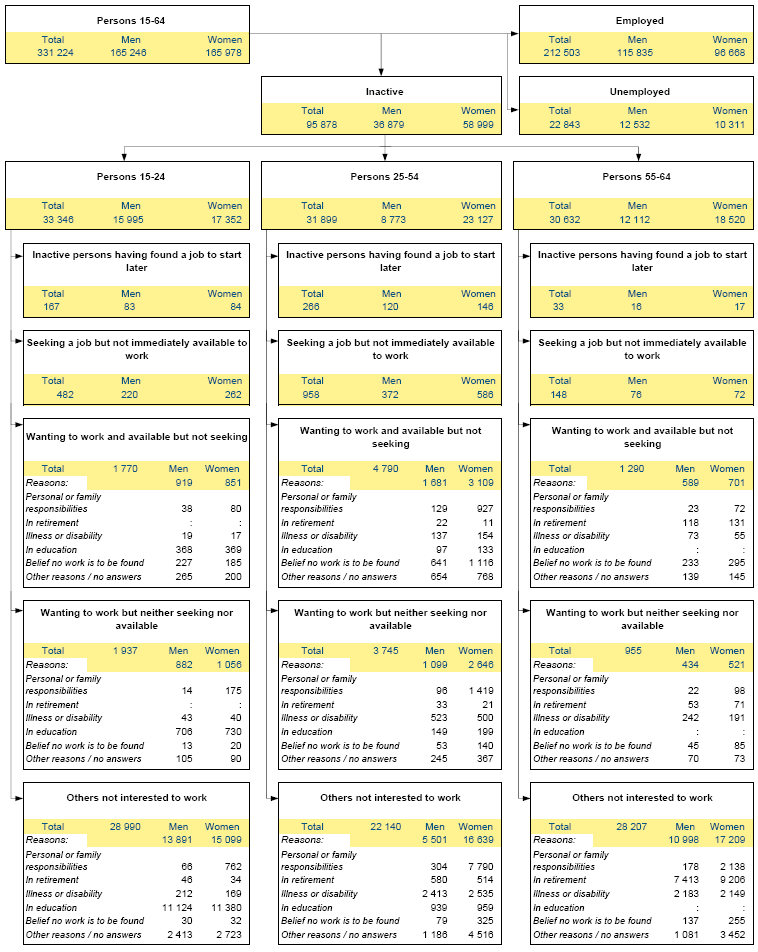
Labour market attachment of persons aged 15-64 in EU-27, 2010 (thousands).PNG
(
file
)
78 KB
3
16:38, 4 January 2012
Gross Nitrogen Balance 2000-2008 (kg N per ha agricultural land).png
(
file
)
6 KB
1
16:44, 4 January 2012
Gross Nitrogen Balance - kg N input per ha agricultural land, average 2005-2008.png
(
file
)
7 KB
1
16:46, 4 January 2012
Gross Nitrogen Balance - share in N inputs, average 2005-2008.png
(
file
)
10 KB
1
16:48, 4 January 2012
Gross Nitrogen Balance - share in manure production, average 2005-2008.png
(
file
)
9 KB
1
16:50, 4 January 2012
Gross Nitrogen Balance - kg N output per ha agricultural land, average 2005-2008.png
(
file
)
8 KB
1
16:53, 4 January 2012
Gross Nitrogen Balance - share in N outputs, average 2005-2008.png
(
file
)
11 KB
1
17:42, 4 January 2012
Gross Nitrogen Balance.xls
(
file
)
66 KB
2
16:13, 6 January 2012
Gross Phosphorus Balance, 2000-2008 (kg P per ha agricultural land).png
(
file
)
6 KB
1
16:14, 6 January 2012
Gross Phosphorus Balance - kg P input per ha agricultural land, average 2005-2008.png
(
file
)
7 KB
1
16:15, 6 January 2012
Gross Phosphorus Balance - share in P inputs, average 2005-2008.png
(
file
)
9 KB
1
16:16, 6 January 2012
Gross Phosphorus Balance - kg P output per ha agricultural land, average 2005-2008.png
(
file
)
9 KB
1
16:16, 6 January 2012
Gross Phosphorus Balance - share in P outputs, average 2005-2008.png
(
file
)
11 KB
1
16:21, 6 January 2012
Gross Phosphorus Balance - share in manure production, average 2005-2008.png
(
file
)
9 KB
1
First page
Previous page
Next page
Last page
Special page
ISSN 2443-8219


.png)


_by_economic_activity_and_enterprise_size,_2009.PNG)
.PNG)
.PNG)


.PNG)


.PNG)
.PNG)
.PNG)
.png)


.png)


