Tutorials
Log in
Statistics Explained
menu
search
search
Navigation
Main page
Statistical themes
Glossary
Categories
Statistics 4 beginners
Tutorials
Help
Eurostat home
Education corner
Online publications
Regional yearbook
Sustainable development
Full list
Tools
User contributions
Logs
View user groups
Special pages
search
Navigation
Main page
Statistical themes
Glossary
Categories
Statistics 4 beginners
Tutorials
Help
Eurostat home
Education corner
Online publications
Regional yearbook
Sustainable development
Full list
Tools
User contributions
Logs
View user groups
Special pages
Navigation
Main page
Statistical themes
Glossary
Categories
Statistics 4 beginners
Tutorials
Help
Eurostat home
Education corner
Online publications
Regional yearbook
Sustainable development
Full list
Tools
User contributions
Logs
View user groups
Special pages
Uploads by Paniang
This special page shows all uploaded files.
File list
Items per page:
20
50
100
250
500
Search for media name:
Username:
Include old versions of files
Go
First page
Previous page
Next page
Last page
Date
Name
Thumbnail
Size
Description
Versions
10:45, 24 April 2014
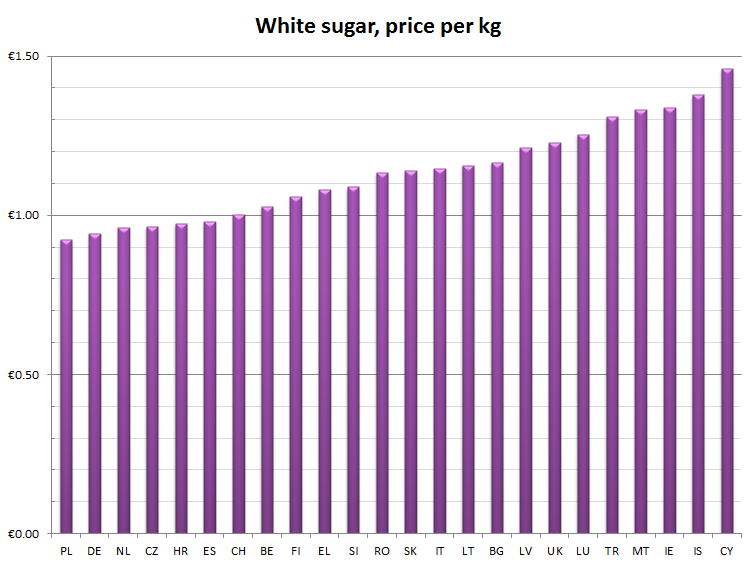
Price White Sugar 2012.png
(
file
)
51 KB
1
12:19, 24 April 2014
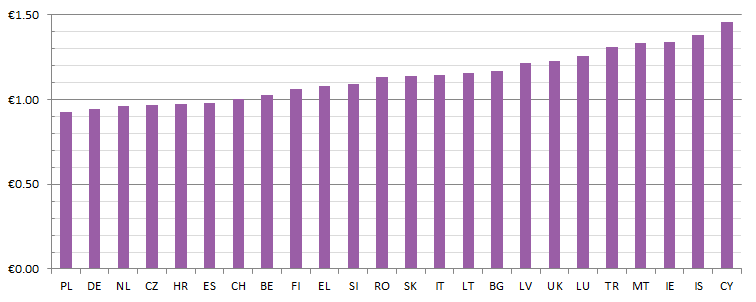
White Sugar Price 2012.png
(
file
)
10 KB
2
12:20, 24 April 2014
Tobacco Price 2012.png
(
file
)
9 KB
3
12:22, 24 April 2014
Cup of coffee Price 2012.png
(
file
)
10 KB
2
12:22, 24 April 2014
Products per country (dap) 2012.png
(
file
)
17 KB
2
12:22, 24 April 2014
Cinema Price 2012.png
(
file
)
10 KB
2
15:20, 24 September 2014
Number of products per country - 2013.png
(
file
)
17 KB
1
15:20, 24 September 2014
Tobacco, price per pack (20 cigarettes), 2013.png
(
file
)
15 KB
1
11:08, 29 September 2014
Cinema, price per ticket, 2013.png
(
file
)
11 KB
2
11:12, 29 September 2014
White sugar, price per kg, 2013.png
(
file
)
16 KB
1
11:15, 29 September 2014
Cup of coffee, price per cup, 2013.png
(
file
)
12 KB
3
17:38, 11 September 2015
HICP-CT Formula.png
(
file
)
4 KB
2
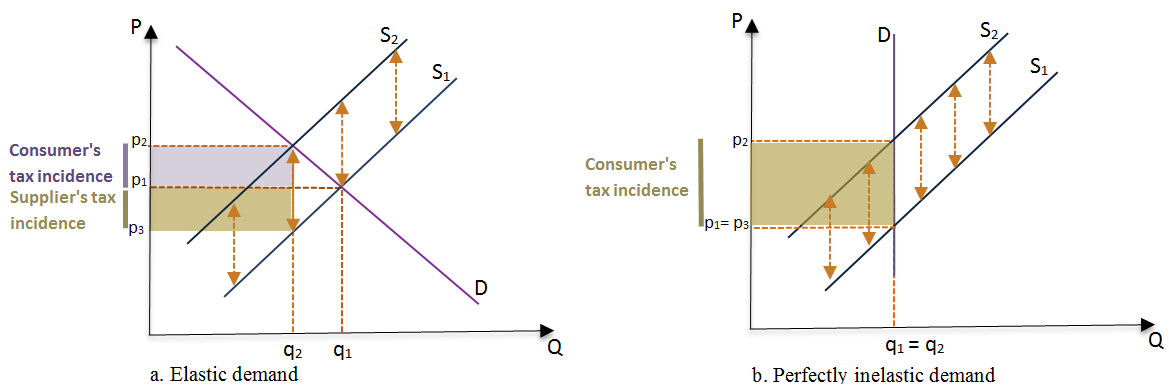
16:10, 14 September 2015
Elastic demand and perfectly inelastic demand.png
(
file
)
45 KB
2
09:41, 23 September 2015
Cinema, price per ticket, 2014.png
(
file
)
16 KB
1
09:42, 23 September 2015
Number of products per country - 2014.png
(
file
)
29 KB
1
09:43, 23 September 2015
Tobacco, price per pack (20 cigarettes), 2014.png
(
file
)
8 KB
1
17:33, 23 September 2015
White sugar, price per kg, 2014.png
(
file
)
20 KB
2
17:34, 23 September 2015
Cup of coffee, price per cup, 2014.png
(
file
)
13 KB
2
16:11, 19 January 2016
Difference between euro area HICP and HICP-CT annual rates per main aggregate (pp in December of each year).png
(
file
)
39 KB
2
11:56, 20 January 2016
HICP and HICP-CT annual rates (2013-2014).png
(
file
)
66 KB
3
18:18, 31 August 2016
Number of products per country - 2015.png
(
file
)
23 KB
1
18:24, 31 August 2016
Tobacco, price per pack (20 cigarettes) (in euros), 2015.png
(
file
)
7 KB
1
10:52, 1 September 2016
Cup of coffee, price per cup (in euro), 2015.png
(
file
)
13 KB
1
14:30, 1 September 2016
White sugar, price per kg (in euro), 2015.png
(
file
)
21 KB
2
14:31, 1 September 2016
Cinema, price per ticket (in euros), 2015.png
(
file
)
15 KB
3
12:36, 31 October 2016
Euro area annual inflation and its main components (%), 2016, October 2015 and May 2016-October 2016-e.png
(
file
)
19 KB
1
12:37, 31 October 2016
Euro area annual inflation and its main components, 2006-October-2016-e.png
(
file
)
26 KB
1
12:38, 31 October 2016
Euro area annual inflation and its main components (%), November 2014-October 2016-e.png
(
file
)
46 KB
1
13:27, 27 February 2017
Euro area HICP and HICP-CT annual rate (% in December), 2016.png
(
file
)
25 KB
2
13:28, 27 February 2017
Difference between euro area HICP and HICP CT annual rates per main aggregate -pp in December of each year, 2016.png
(
file
)
38 KB
2
13:29, 27 February 2017
HICP and HICP-CT annual rates (2013-2016) new.png
(
file
)
67 KB
2
11:55, 18 January 2018
Euro area HICP and HICP-CT annual rate (% in December), 2017.png
(
file
)
23 KB
1
11:55, 18 January 2018
Difference between euro area HICP and HICP CT annual rates per main aggregate -pp in December of each year, 2017.png
(
file
)
27 KB
1
11:56, 18 January 2018
HICP and HICP-CT annual rates (2003-2017).png
(
file
)
68 KB
1
10:50, 28 January 2020
2019Q3 Gross investment rate of non-financial corporations, seasonally adjusted.png
(
file
)
49 KB
1
10:52, 28 January 2020
2019Q3 Household gross investment rate, seasonally adjusted.png
(
file
)
30 KB
1
10:52, 28 January 2020
2019Q3 Household gross saving rate, seasonally adjusted.png
(
file
)
32 KB
1
10:52, 28 January 2020
2019Q3 Nominal growth of household gross adjusted disposable income and gross fixed capital formation (euro area).png
(
file
)
42 KB
1
10:52, 28 January 2020
2019Q3 Gross profit share of non-financial corporations, seasonally adjusted.png
(
file
)
44 KB
1
10:53, 28 January 2020
2019Q3 Nominal growth of components of the investment rate and the profit share (euro area).png
(
file
)
32 KB
1
10:53, 28 January 2020
T+120 NR EN 2019Q3.xlsx
(
file
)
378 KB
1
16:33, 28 April 2020
2019Q4 Household gross saving rate, seasonally adjusted.png
(
file
)
74 KB
1
16:36, 28 April 2020
2019Q4 Household gross investment rate, seasonally adjusted.png
(
file
)
67 KB
1
16:38, 28 April 2020
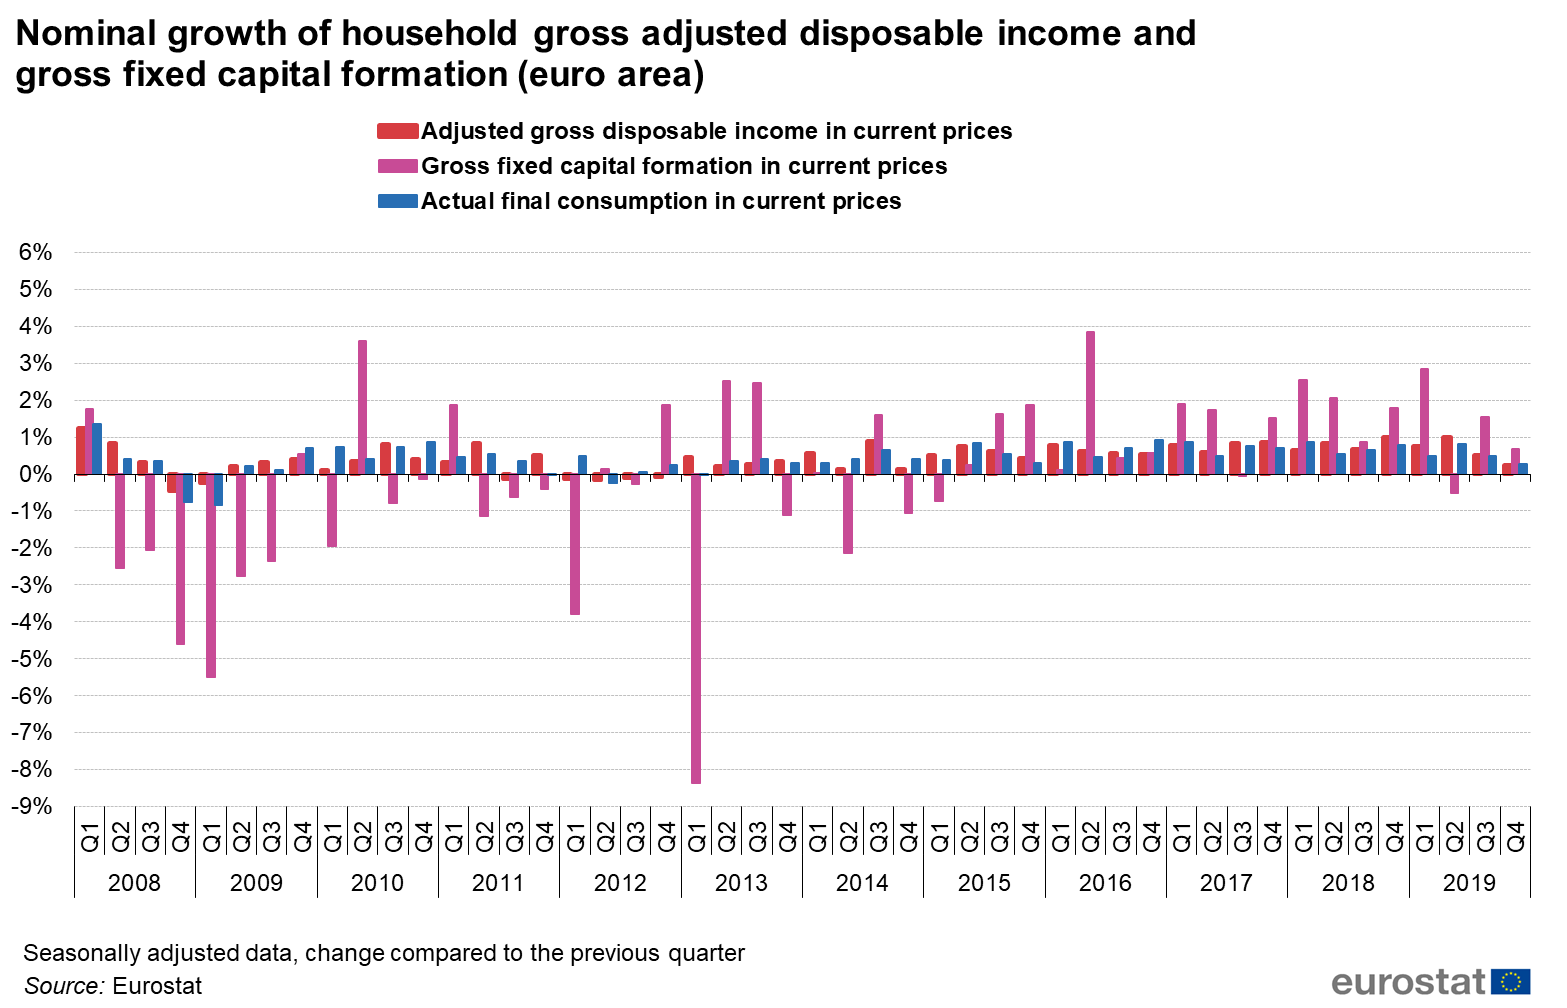
2019Q4 Nominal growth of household gross adjusted disposable income and gross fixed capital formation (euro area).png
(
file
)
109 KB
1
16:50, 28 April 2020
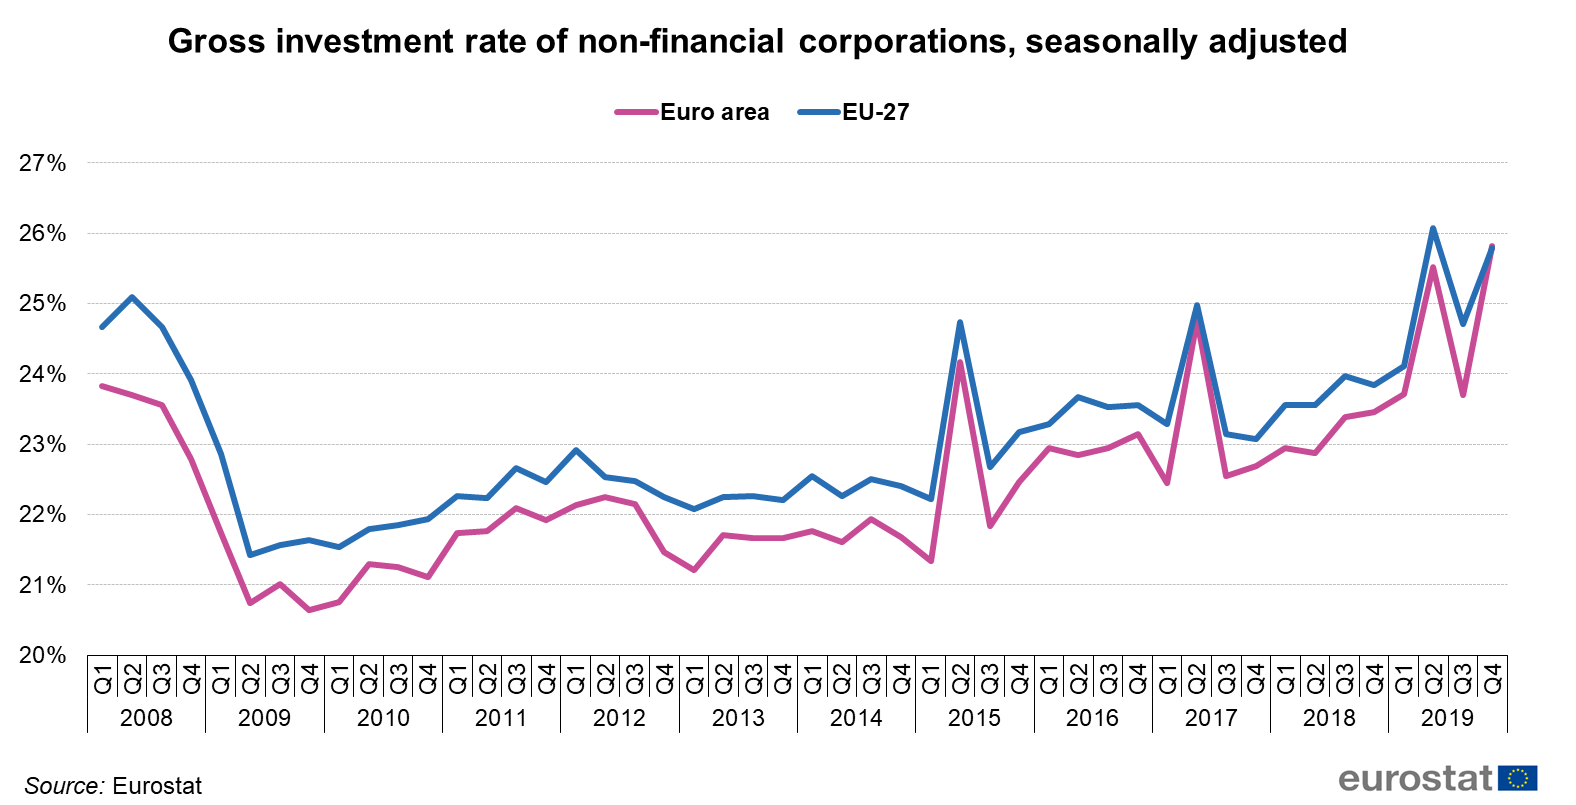
2019Q4 Gross investment rate of non-financial corporations, seasonally adjusted.png
(
file
)
92 KB
1
16:53, 28 April 2020
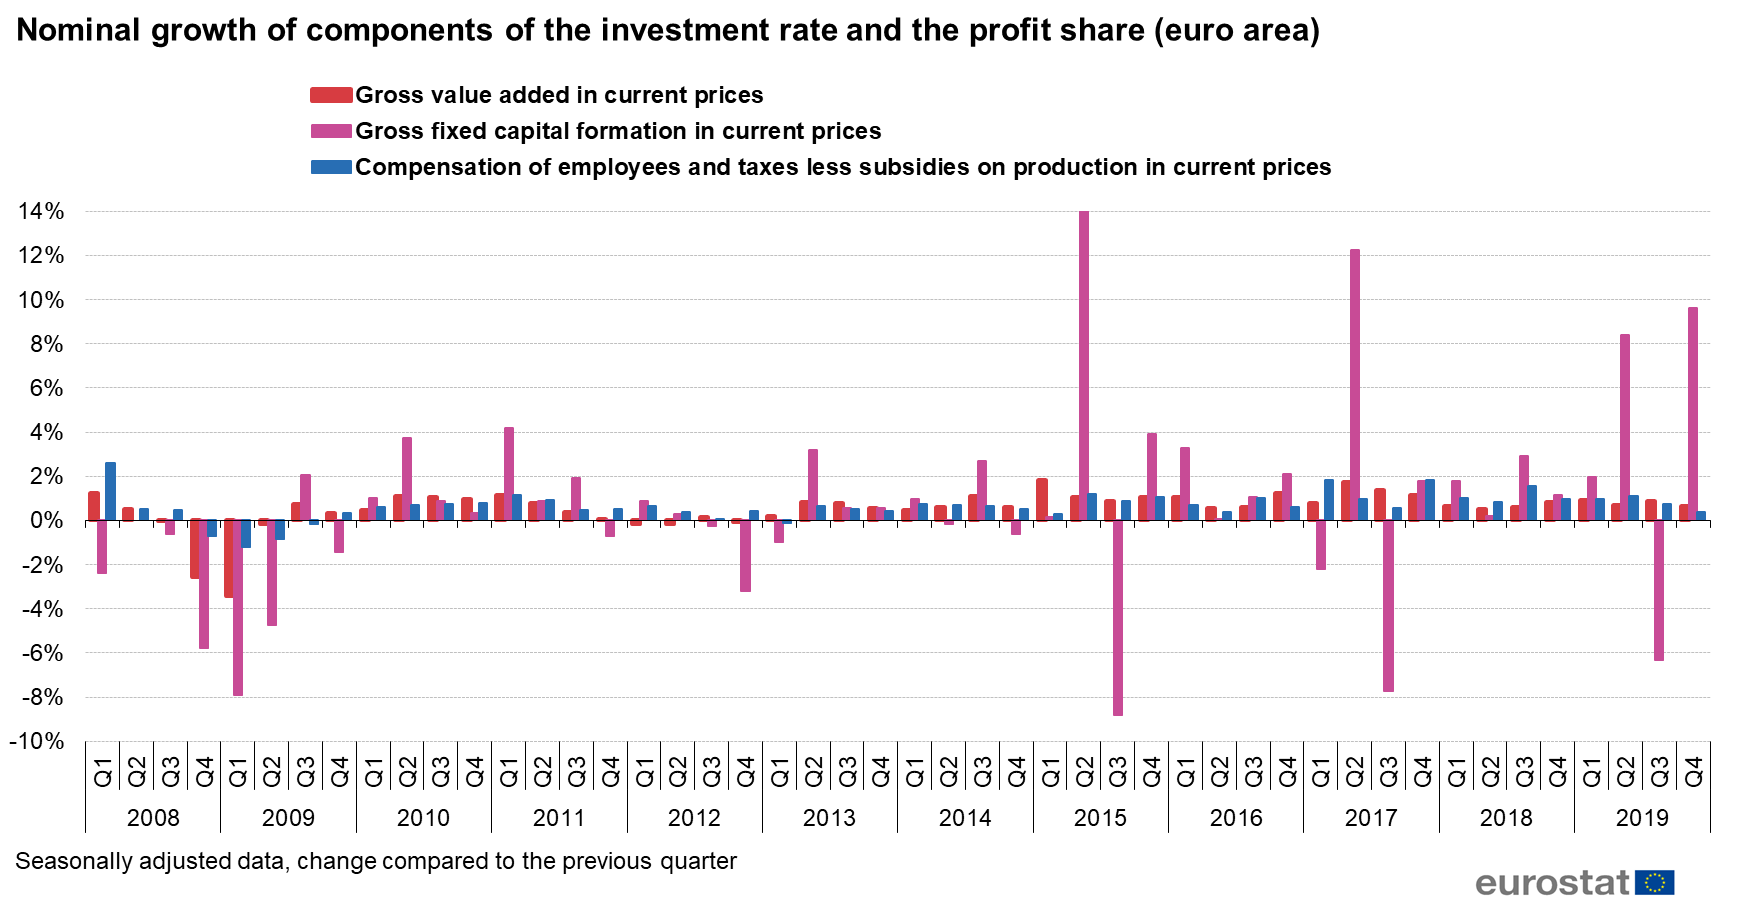
2019Q4 Nominal growth of components of the investment rate and the profit share (euro area).png
(
file
)
99 KB
1
15:24, 19 May 2020
Sector accounts-interactive FP2020.xlsx
(
file
)
11 KB
3
19:04, 19 May 2020
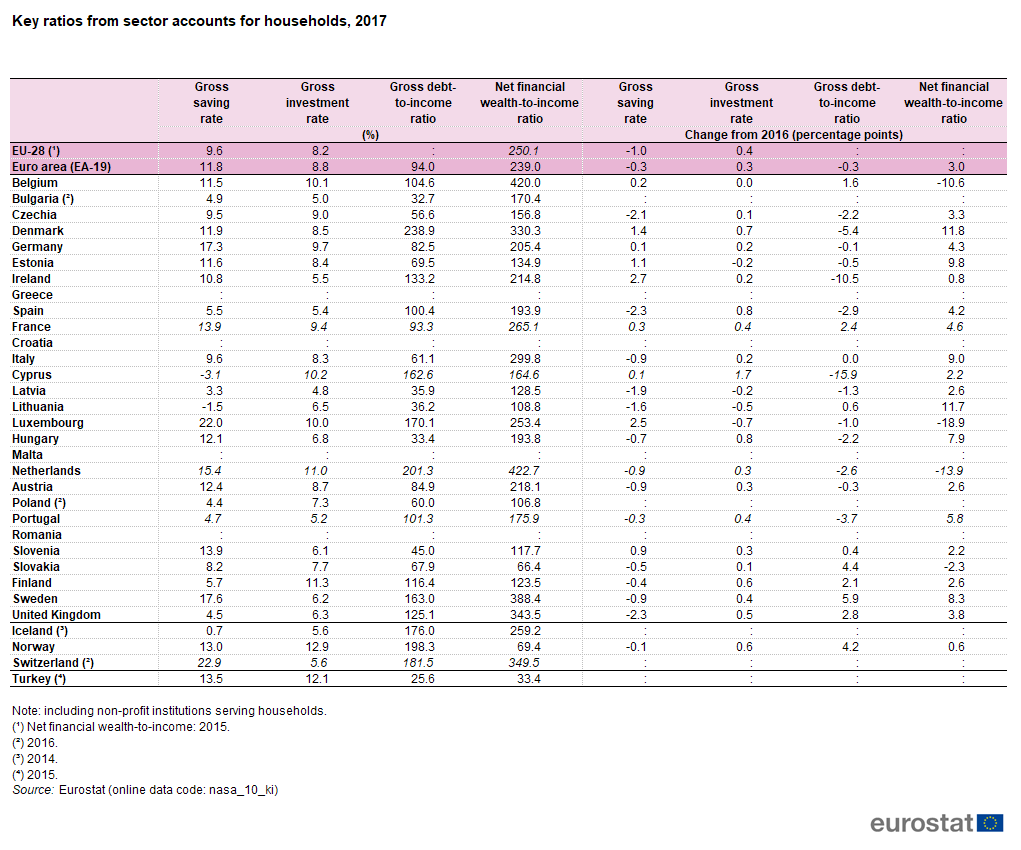
Key ratios from sector accounts for households, 2017 FP19.png
(
file
)
56 KB
Reverted to version as of 13:40, 6 June 2019
3
19:07, 19 May 2020
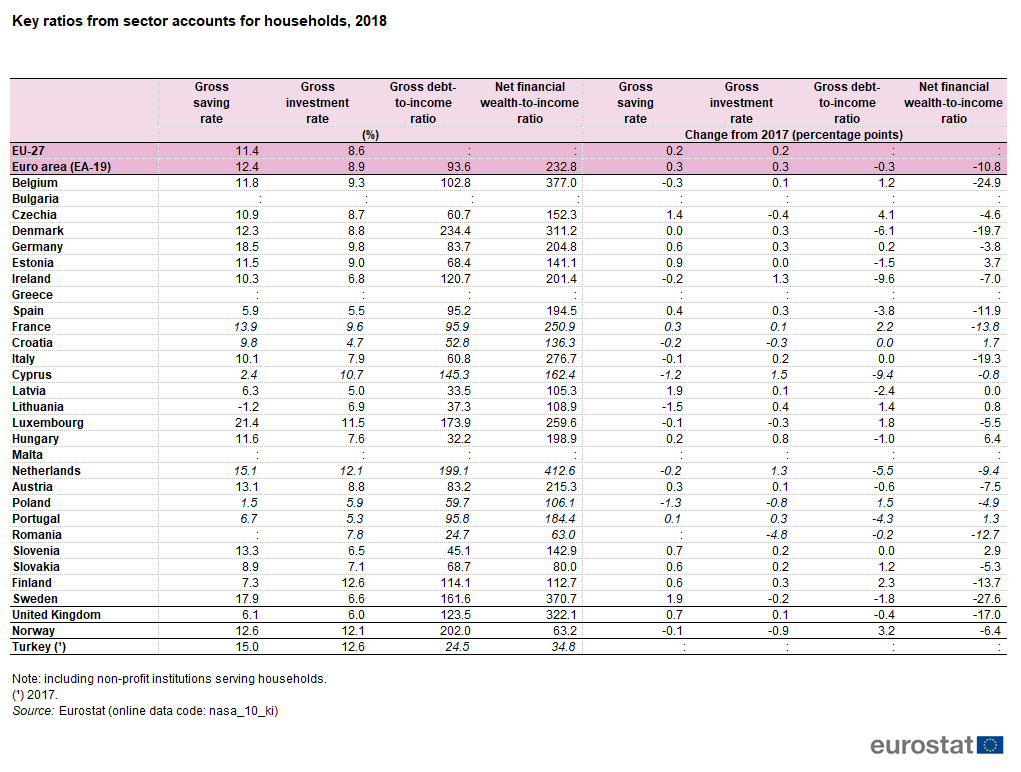
Key ratios from sector accounts for households, 2018 FP20.png
(
file
)
72 KB
4
19:09, 19 May 2020
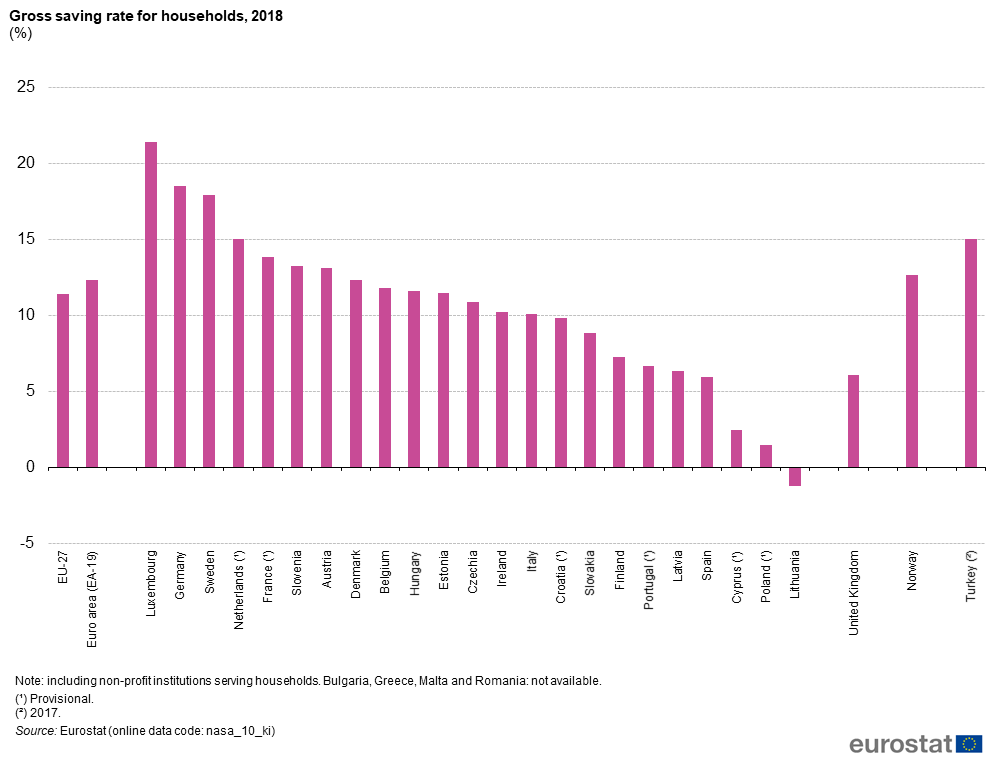
Gross saving rate for households, 2018 (%) FP20.png
(
file
)
60 KB
2
First page
Previous page
Next page
Last page
Special page
ISSN 2443-8219


_2012.png)


,_2013.png)


,_2014.png)


.png)
.png)

_(in_euros),_2015.png)
,_2015.png)
,_2015.png)
,_2015.png)
,_2016,_October_2015_and_May_2016-October_2016-e.png)

,_November_2014-October_2016-e.png)
,_2016.png)

_new.png)
,_2017.png)

.png)


.png)

.png)


.png)

.png)


_FP20.png)