Uploads by Oehlefr
This special page shows all uploaded files.
| Date | Name | Thumbnail | Size | Description | Versions |
|---|---|---|---|---|---|
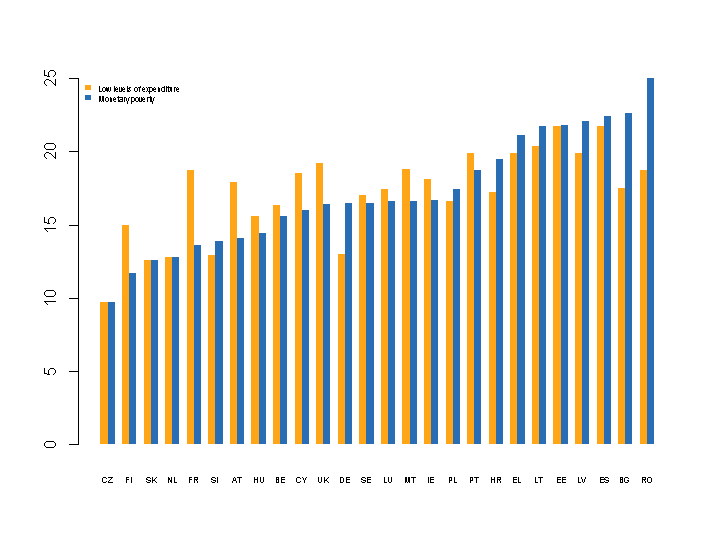
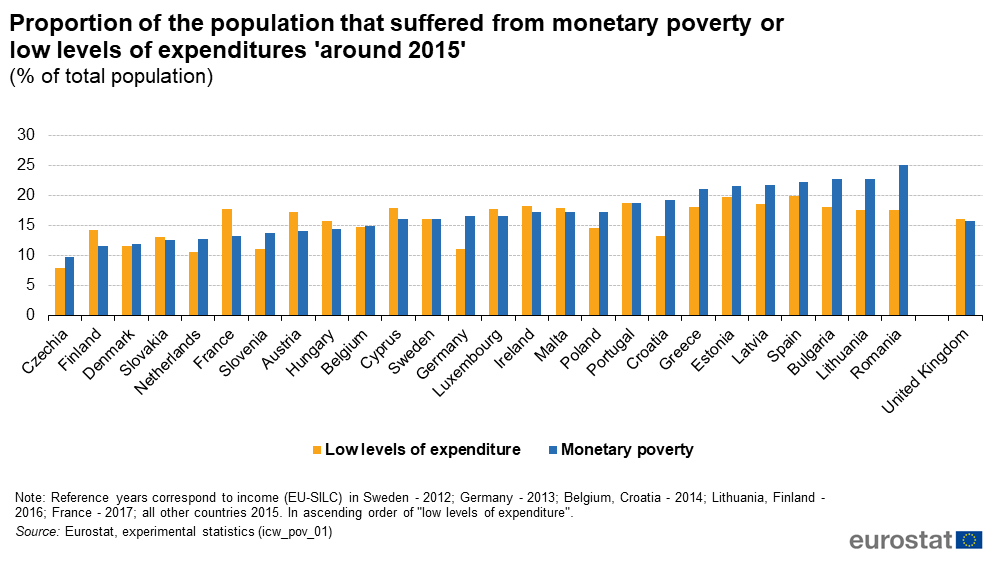
| 15:45, 23 January 2020 | Figure 1 Proportion of the population that suffered from monetary poverty or low levels of expenditures in 2015.png (file) |  |
4 KB | 1 | |
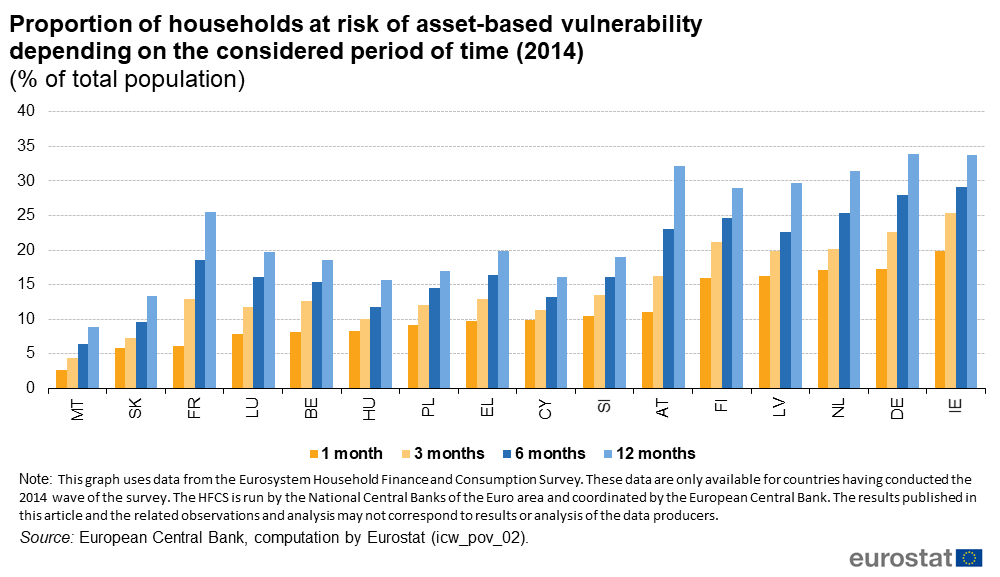
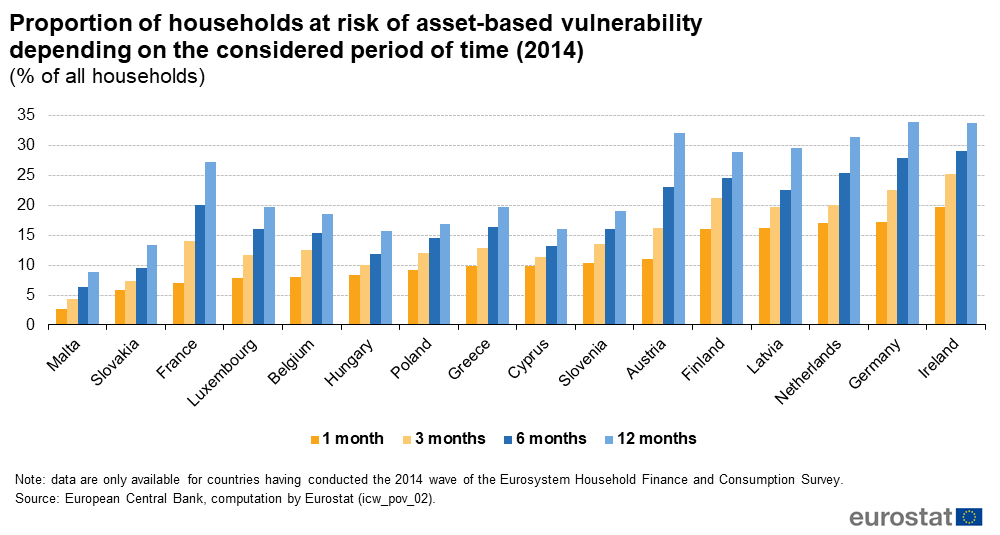
| 19:29, 23 January 2020 | Proportion of households at risk of asset-based vulnerability depending on the considered period of time.png (file) |  |
69 KB | 2 | |
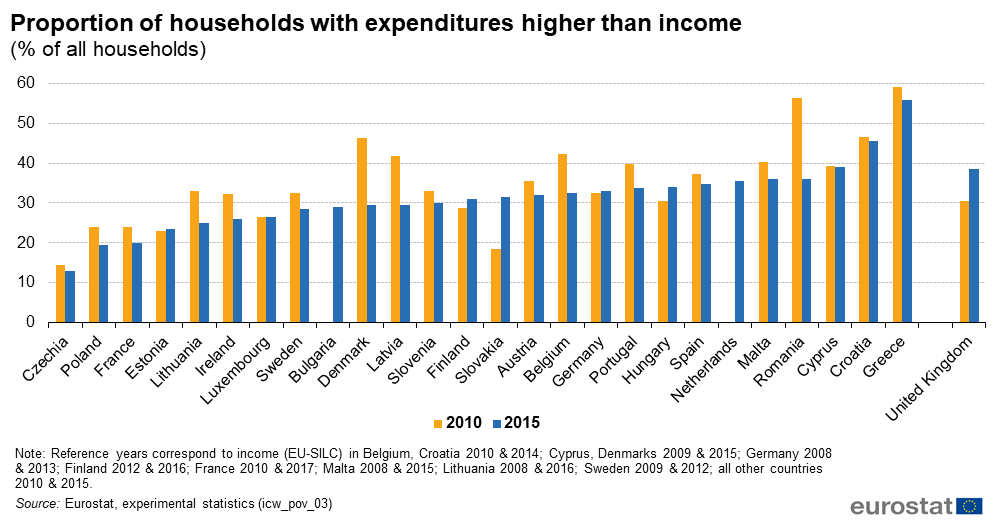
| 10:52, 24 January 2020 | Proportion of households with expenditures higher than income.png (file) |  |
51 KB | Proportion of households with expenditures higher than income (also known as ‘dissaving households’ or ‘households with negative rates’). Source: Eurostat (icw_pov_03) | 3 |
| 09:36, 27 January 2020 | ICW SE01 figures.xlsx (file) | 138 KB | 2 | ||
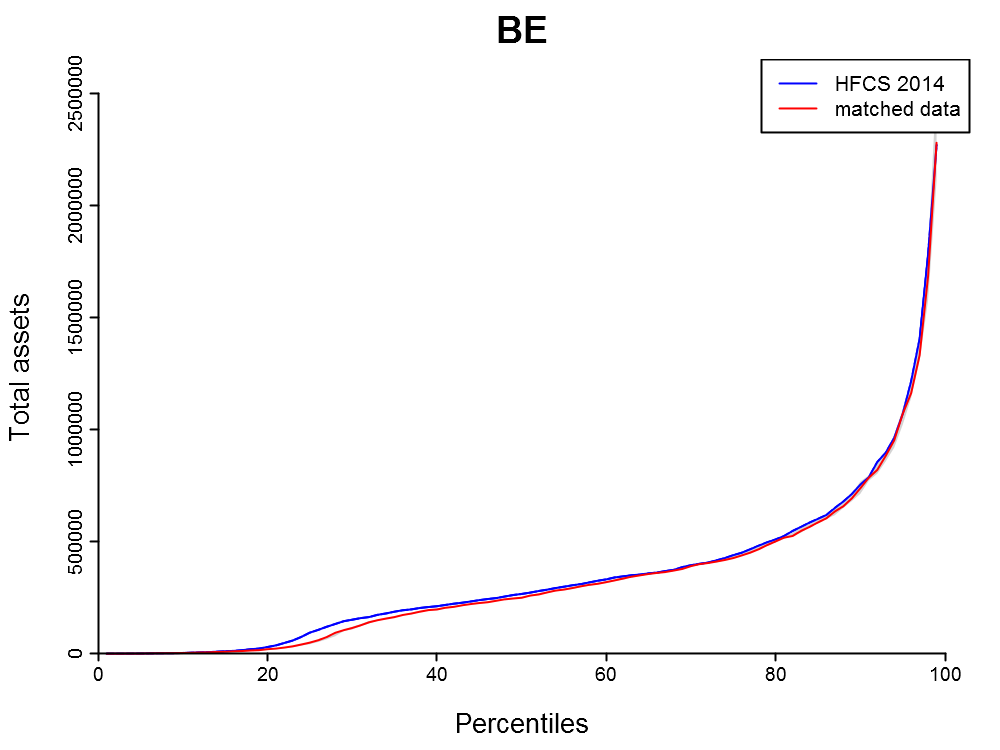
| 16:41, 14 February 2020 | CALIB perc wealth BE unc.png (file) |  |
33 KB | Comparison of the distribution of total assets in the original HFCS data and in the joint EU-SILC-HFCS dataset for Belgium, 2014. | 1 |
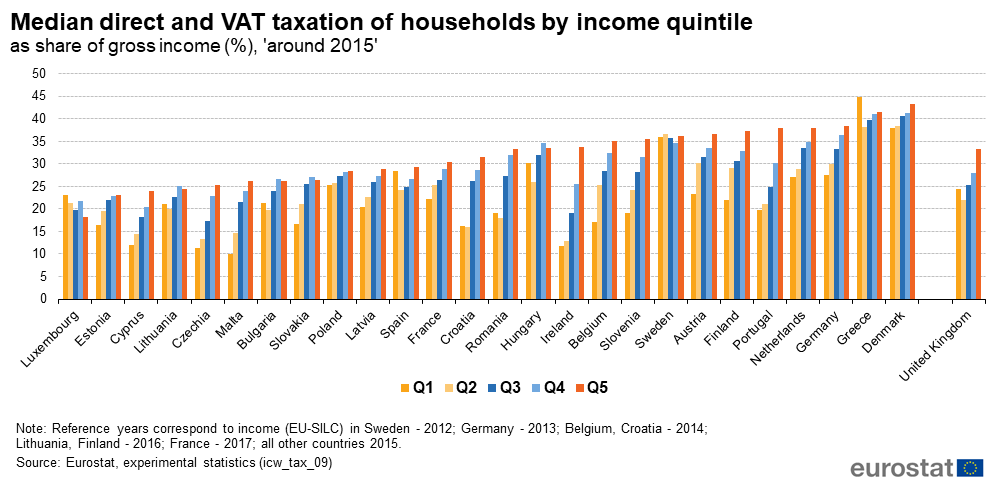
| 11:14, 7 September 2020 | Figure1 Median direct and VAT taxation by income quintile.png (file) |  |
65 KB | Correction of the title | 2 |
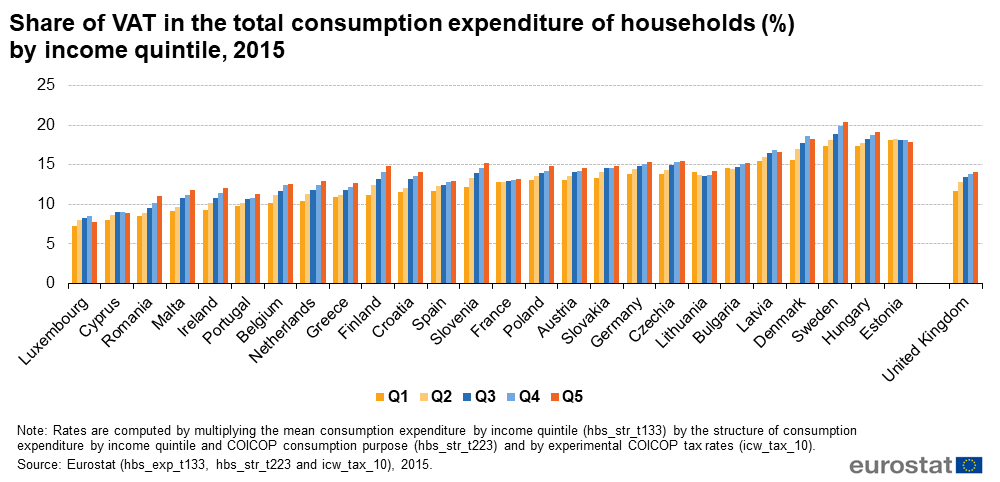
| 12:54, 7 September 2020 | Figure2 Average VAT rate out of consumption by income quintile.png (file) |  |
59 KB | Share of VAT in the overall consumption expenditure of households by level of income, 2015. | 1 |
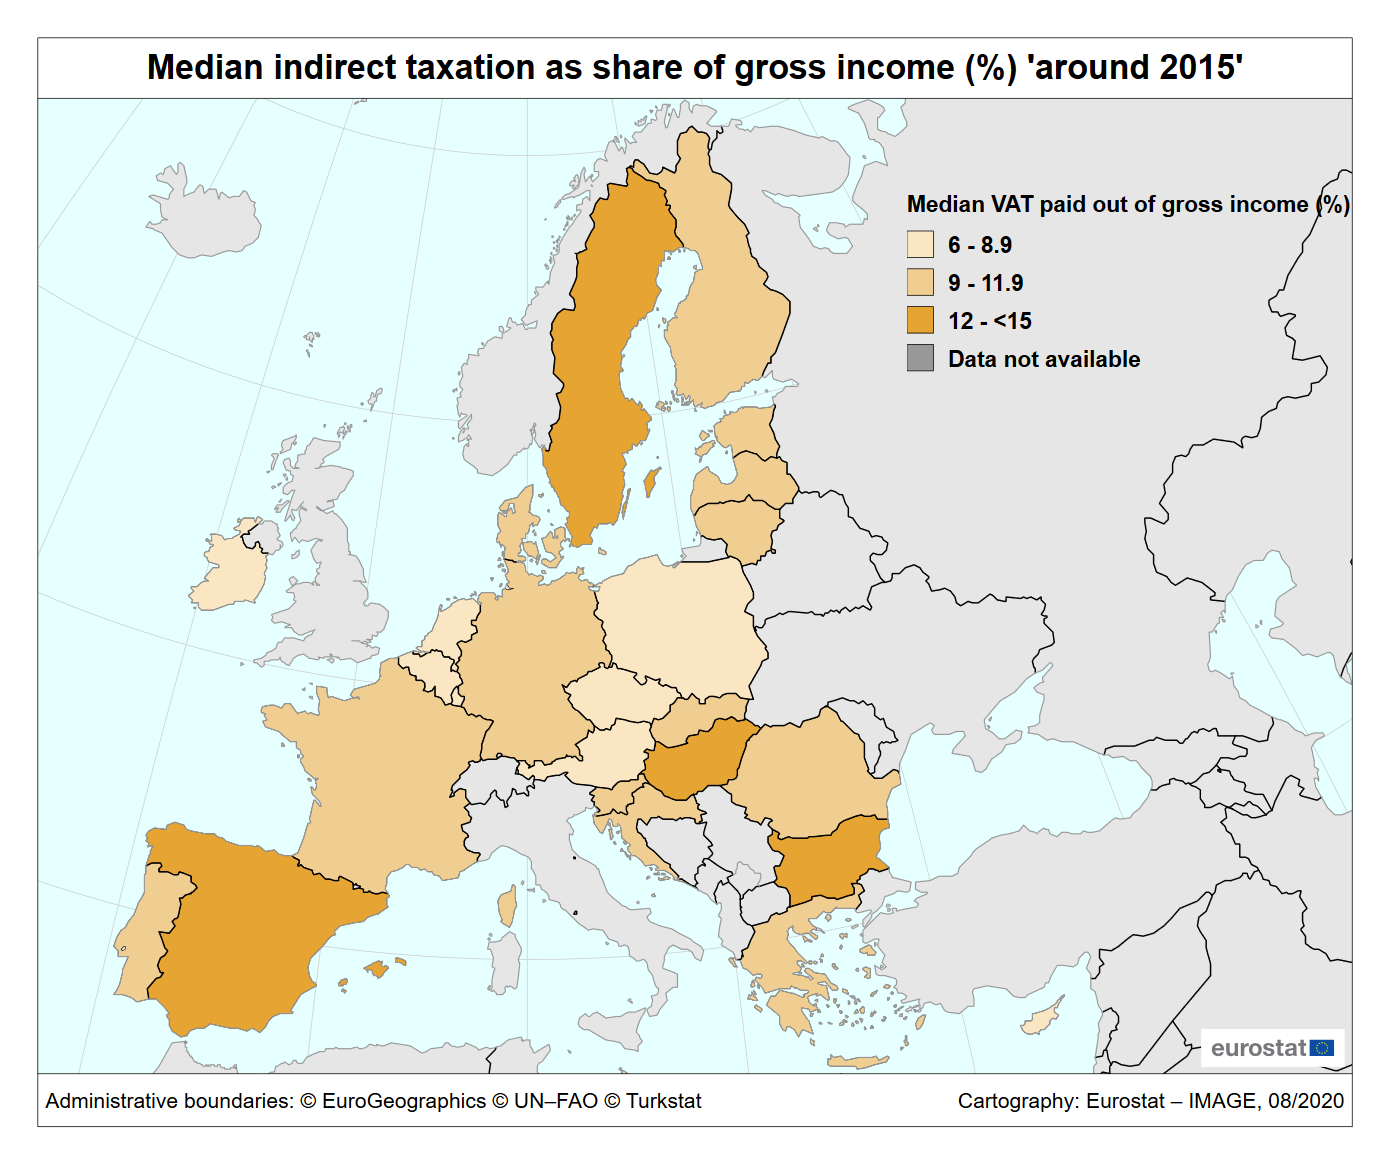
| 15:41, 7 September 2020 | Figure5 Median-VAT-out-of-gross-income map 2015.png (file) |  |
217 KB | Median amount of VAT paid by households as share of their gross income (%), around 2015. | 1 |
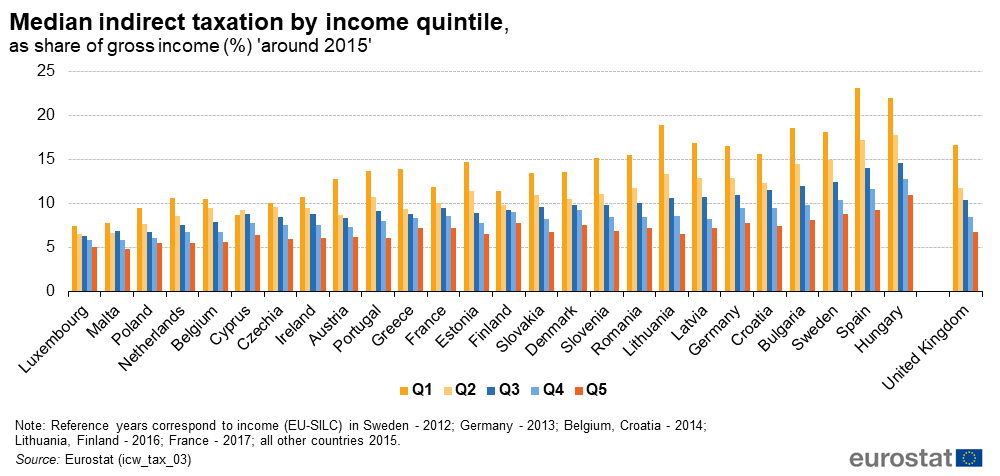
| 15:43, 7 September 2020 | Figure6 Median indirect taxation by income quintile 2015.png (file) |  |
65 KB | Median VAT paid by households as a percentage of their gross income by income quintile, 'around 2015'. | 1 |
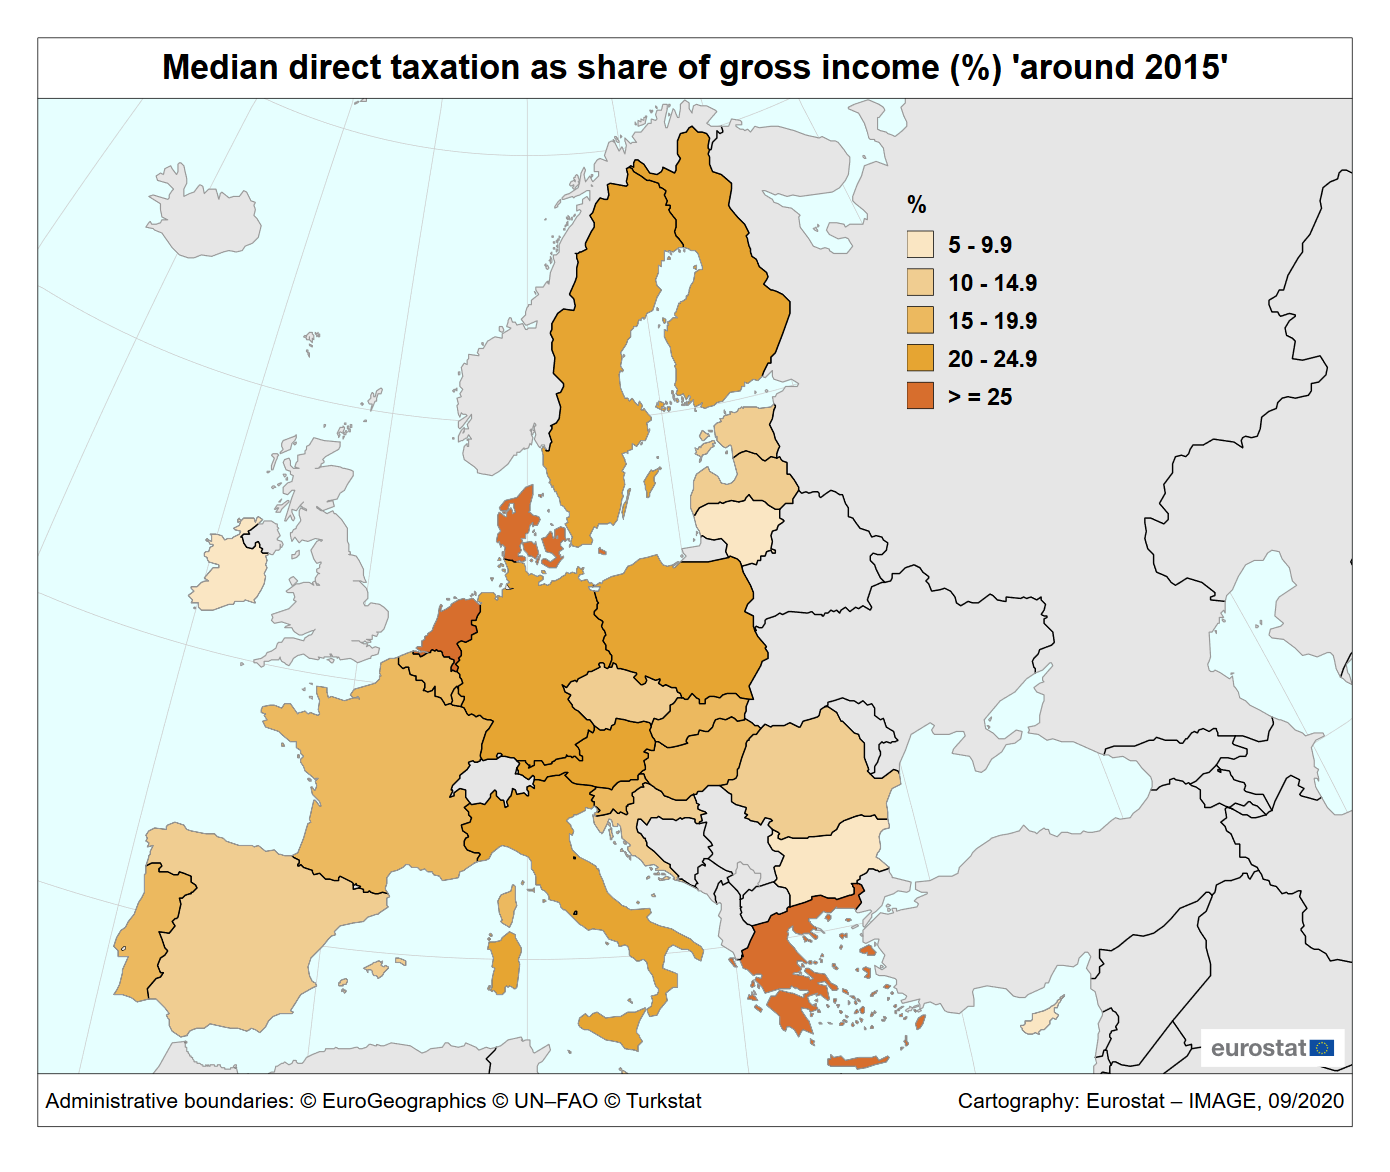
| 16:04, 7 September 2020 | Figure9 Median-direct-taxation-out-of-gross-income map 2015.png (file) |  |
215 KB | Median amount of direct taxes paid by households as share of their gross income (%), 2015. Source: Eurostat, experimental statistics (icw_tax_04). | 1 |
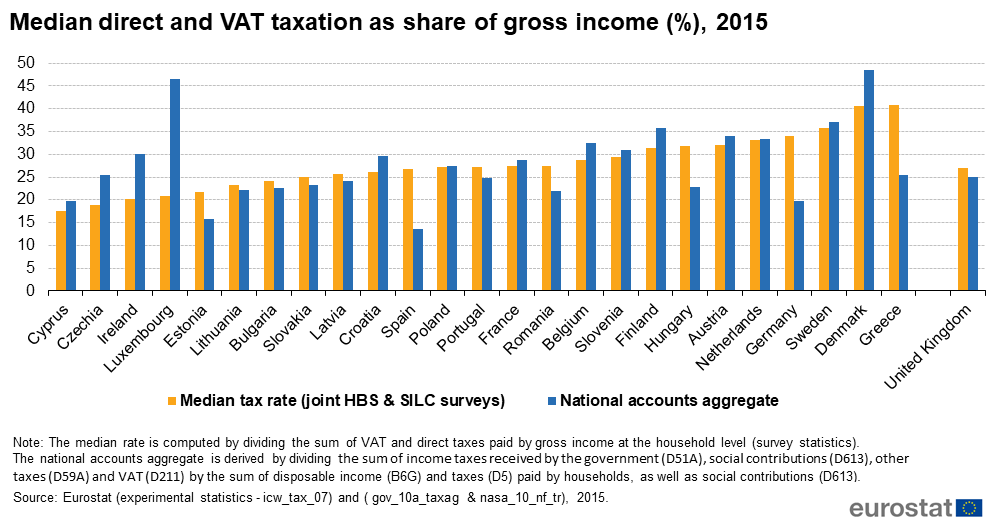
| 16:13, 7 September 2020 | Figure11 Median direct and VAT taxation out of gross income 2015.png (file) |  |
82 KB | Median amount of direct taxes plus VAT paid by households as share of their gross income (%). | 1 |
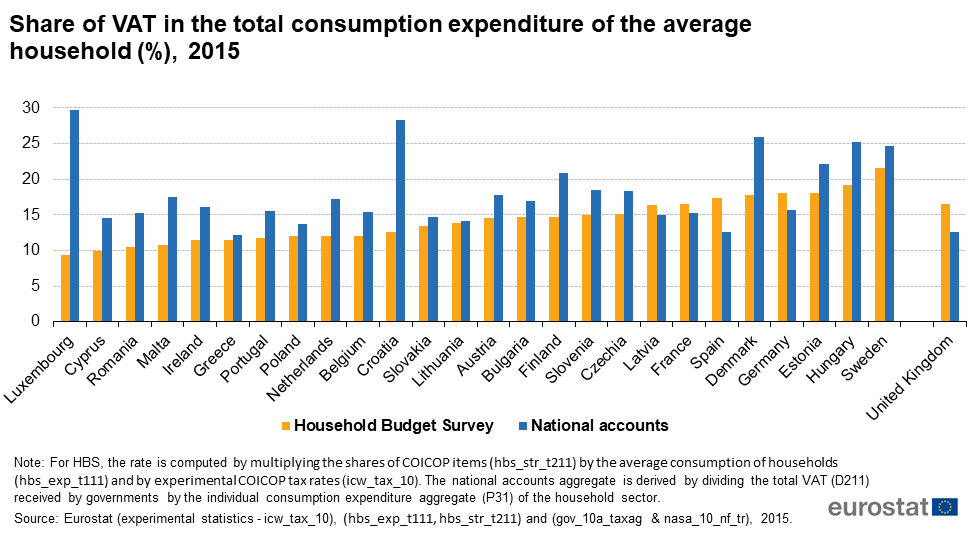
| 17:06, 10 September 2020 | Figure2 Average VAT rate out of consumption.png (file) |  |
80 KB | 2 | |
| 17:06, 10 September 2020 | Figure2 Average VAT rate out of consumption by income quintile 2015.png (file) |  |
69 KB | Title changed | 2 |
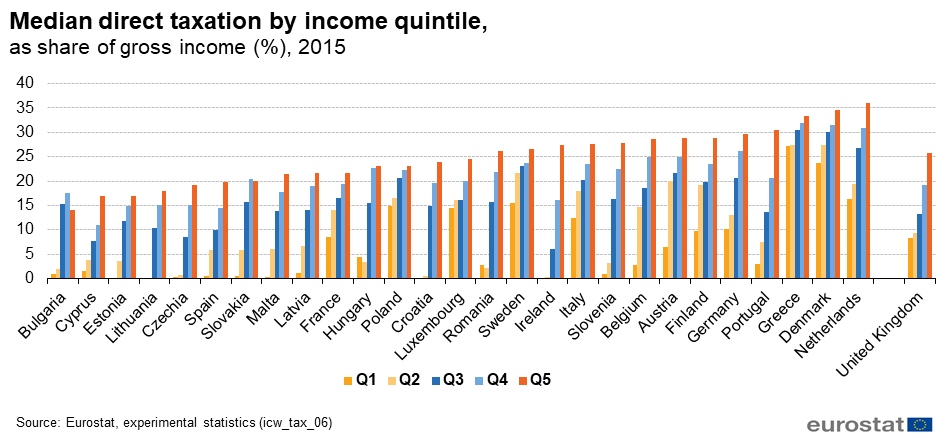
| 11:56, 22 September 2020 | Figure10 Median direct taxation by income quintile 2015.png (file) |  |
62 KB | Ordered by Q5 | 2 |
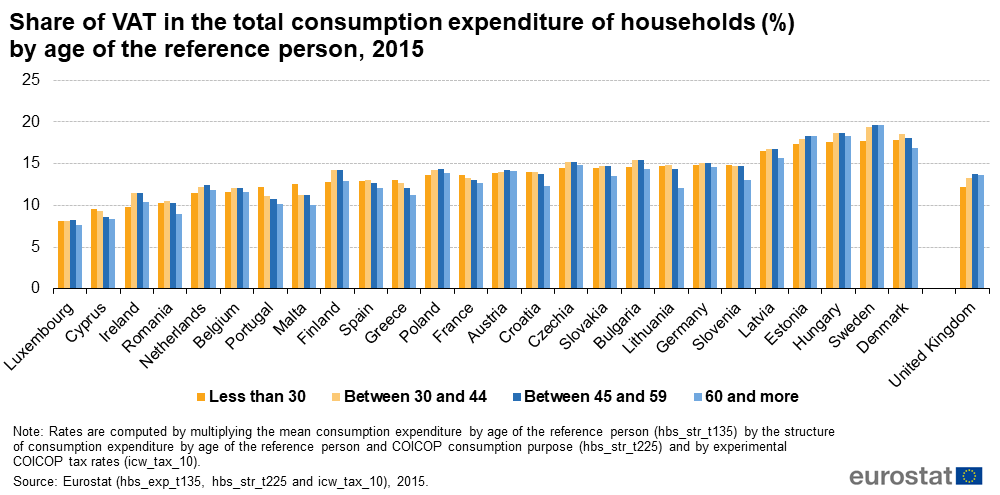
| 12:07, 22 September 2020 | Figure4 Average VAT rate out of consumption by age 2015.png (file) |  |
80 KB | Country order by Age class <30 | 3 |
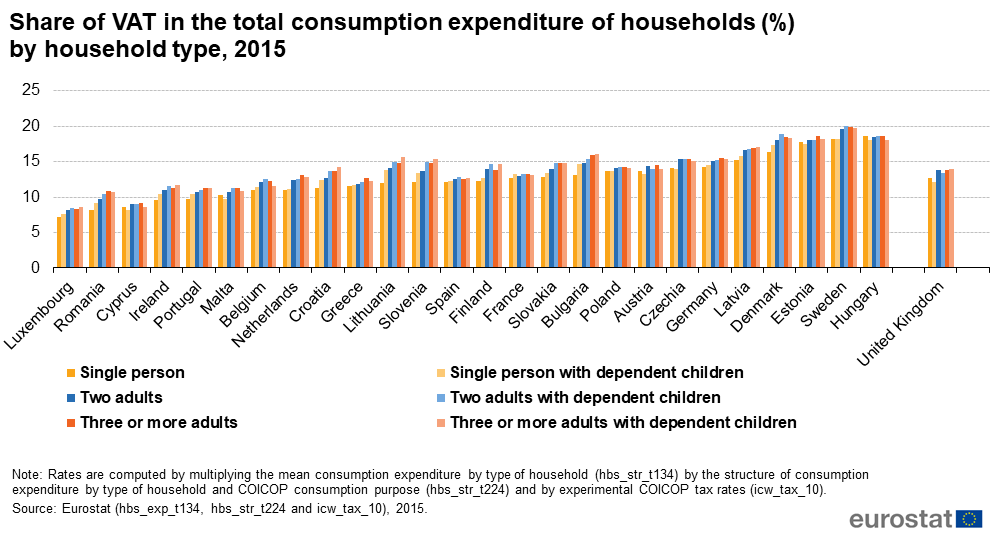
| 12:12, 22 September 2020 | Figure3 Average VAT rate out of consumption by household type 2015.png (file) |  |
77 KB | Ordered by single person households | 4 |
| 14:34, 7 October 2020 | Proportion of households at risk of asset-based vulnerability.png (file) |  |
66 KB | improved methodology and DK added | 6 |
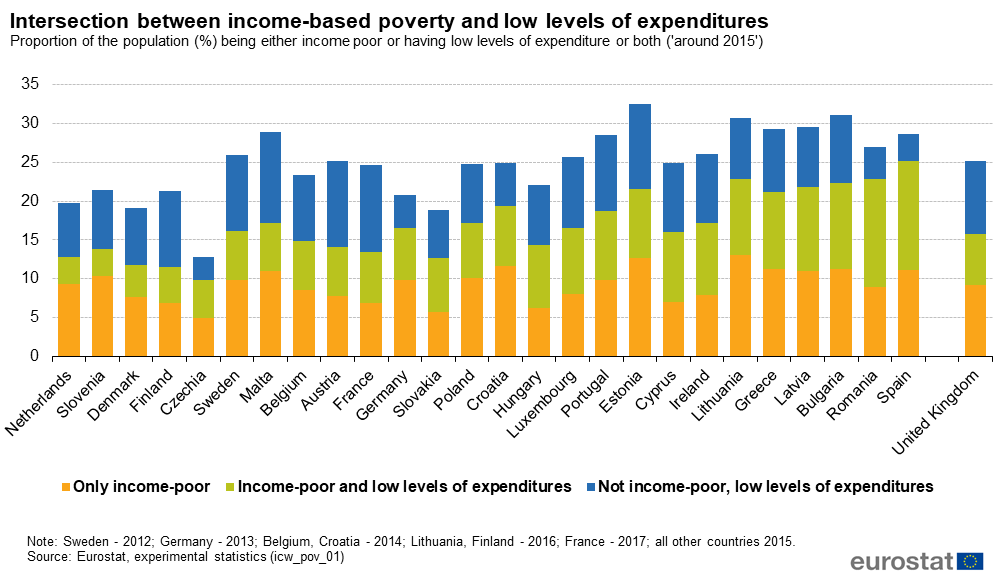
| 11:42, 12 October 2020 | Income-based poverty and low levels of expenditures.png (file) |  |
84 KB | 6 | |
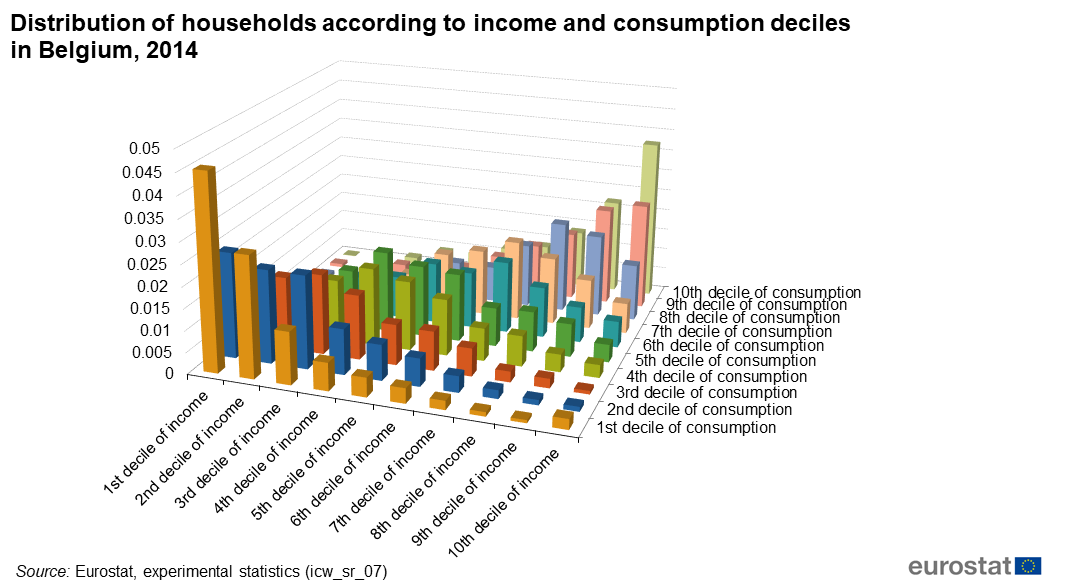
| 15:08, 12 October 2020 | Households by income and consumption deciles, BE 2014.png (file) |  |
112 KB | Improved methodology, June 2020. | 3 |
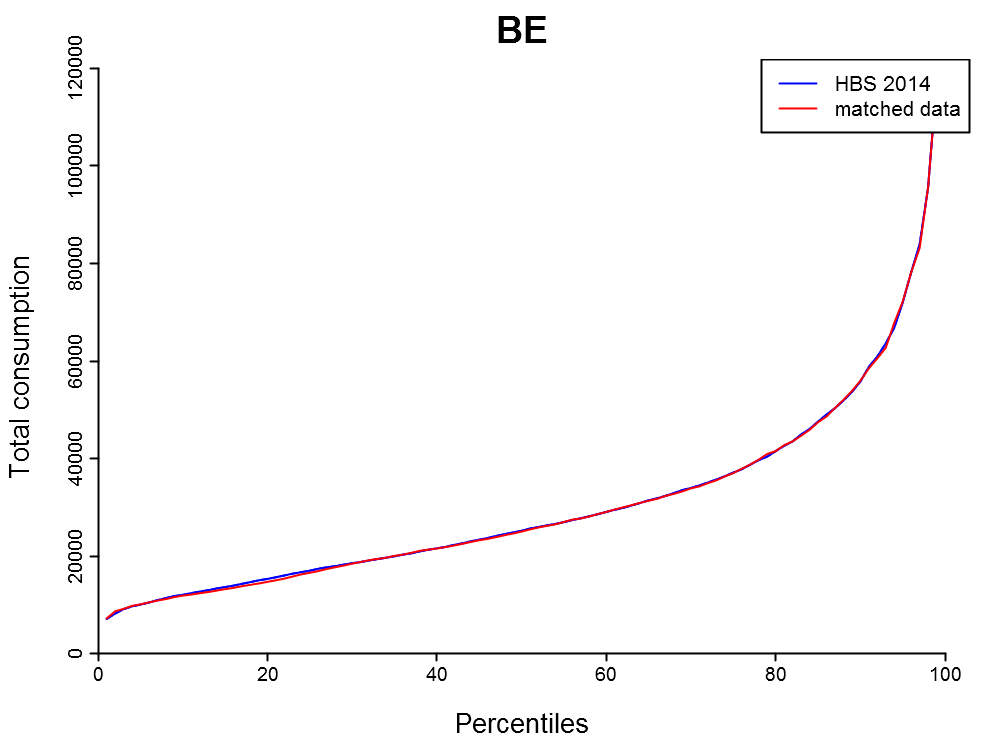
| 15:36, 12 October 2020 | CALIB perc consumption BE.png (file) |  |
29 KB | Improved methodology, June 2020. | 3 |
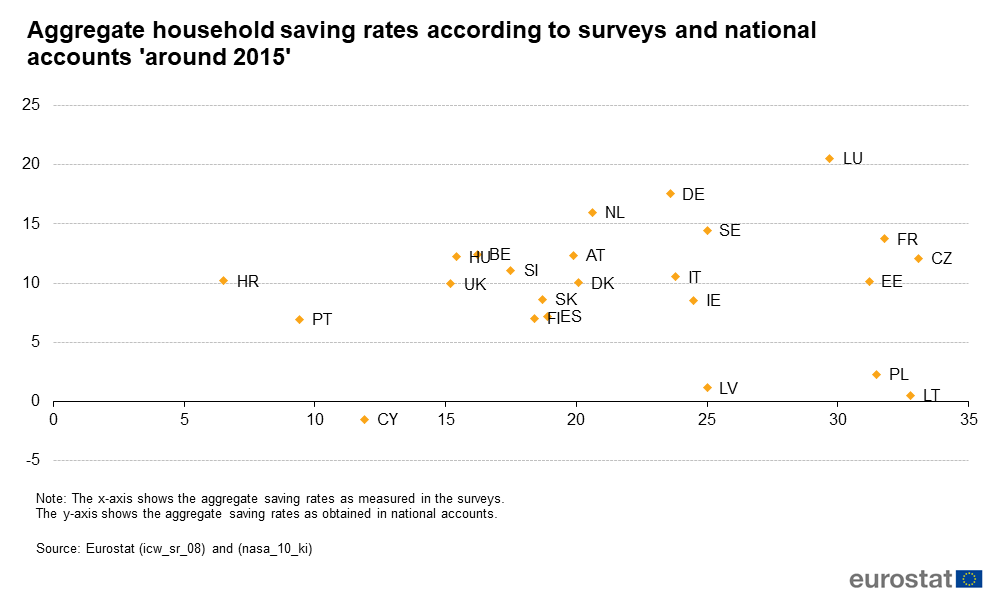
| 10:05, 13 October 2020 | Micro-macro household saving rates.png (file) |  |
35 KB | Improved micro-micro methodology. | 3 |
| 16:28, 31 March 2023 | Proportion of the population that suffered from monetary poverty or low levels of expenditures 'around 2015'.png (file) |  |
74 KB | 5 | |
| 16:30, 31 March 2023 | Households with expenditures higher than income 2015.png (file) |  |
75 KB | 5 | |
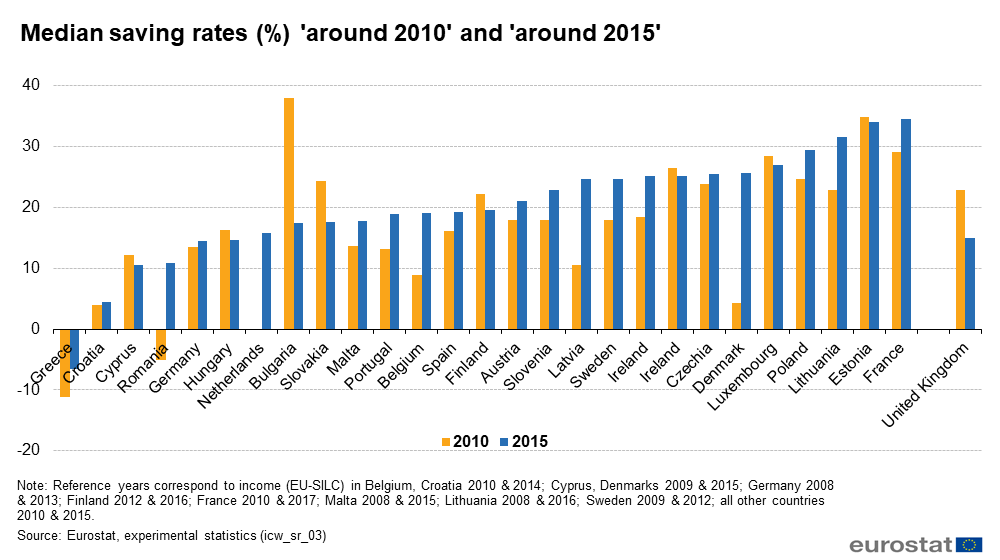
| 16:31, 31 March 2023 | Median saving rates of households.png (file) |  |
69 KB | 5 | |
| 16:32, 31 March 2023 | Gini coefficients for income, consumption, savings and wealth 2015.png (file) |  |
92 KB | 6 | |
| 16:35, 31 March 2023 | Dissaving households and low levels of expenditures 2015.png (file) |  |
78 KB | 7 | |
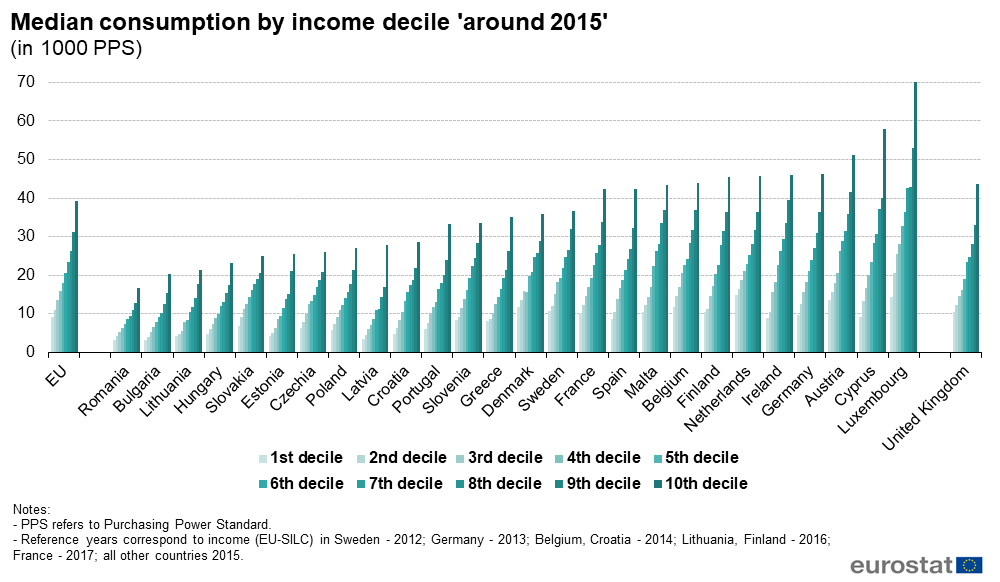
| 16:36, 31 March 2023 | Median consumption by income decile'.png (file) |  |
70 KB | 7 | |
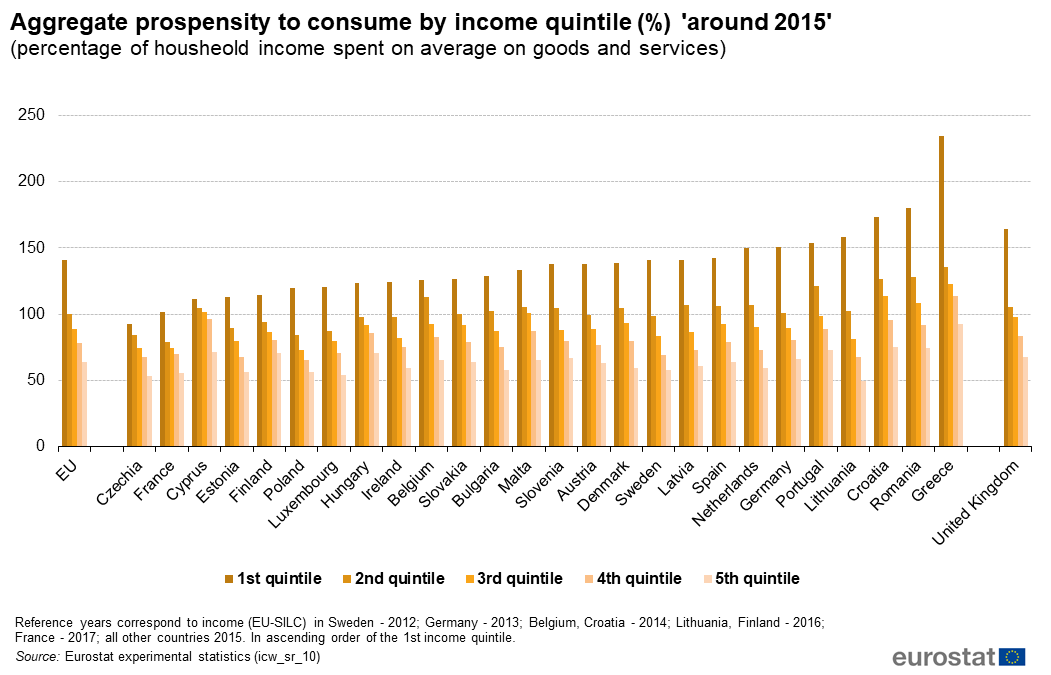
| 16:37, 31 March 2023 | Aggregate prospensity to consume by income quintile.png (file) |  |
86 KB | 5 | |
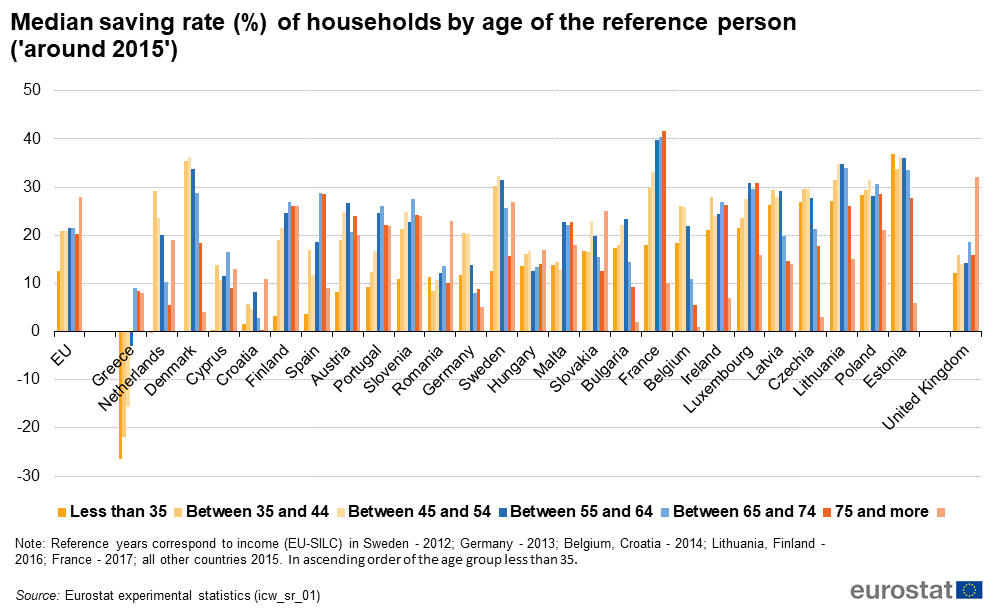
| 16:38, 31 March 2023 | Median saving rate by age of the hh rp.png (file) |  |
81 KB | 6 | |
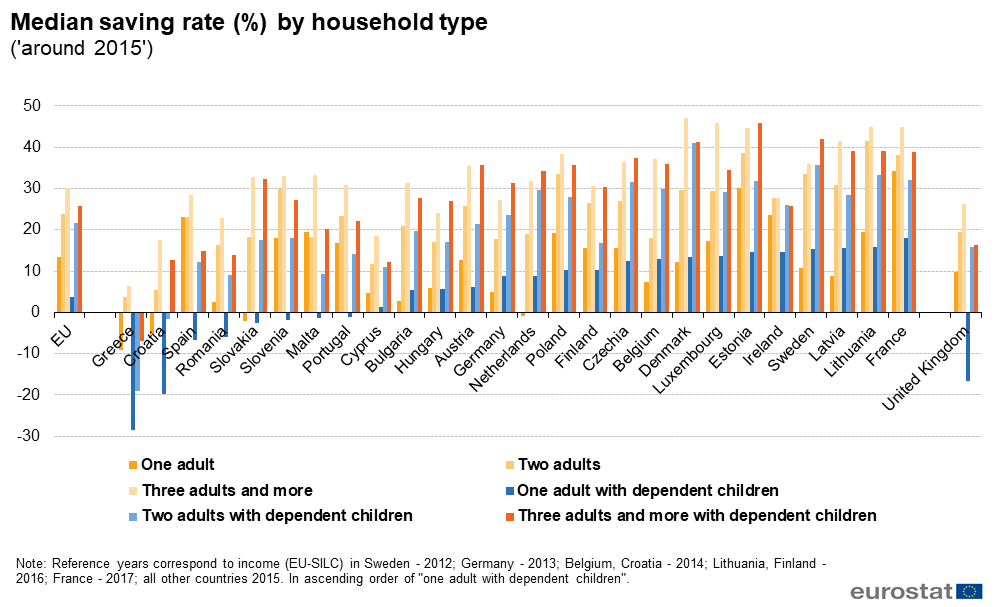
| 16:39, 31 March 2023 | Median saving rate by household type.png (file) |  |
78 KB | 7 | |
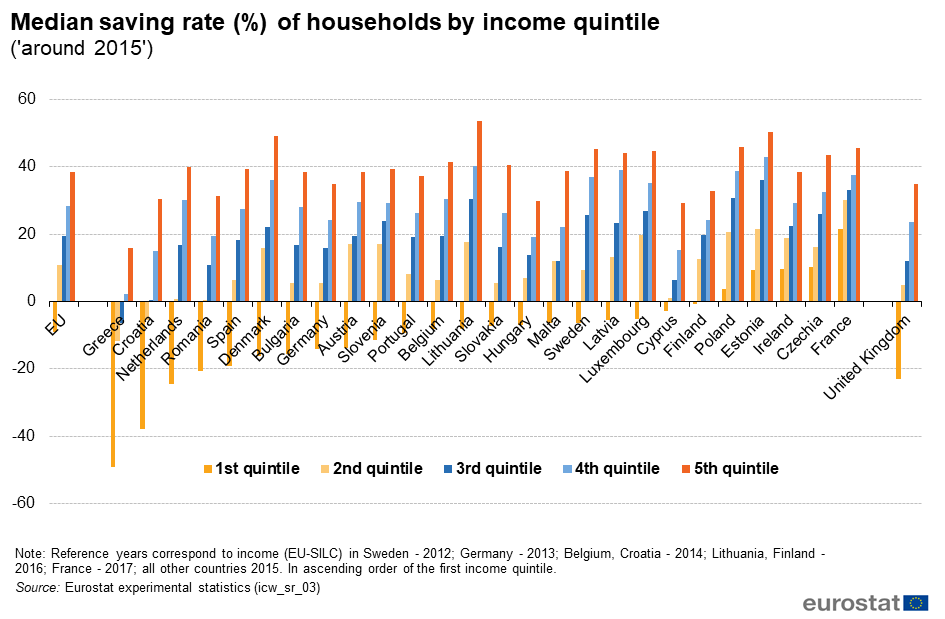
| 16:40, 31 March 2023 | Median saving rate of households by income quintile.png (file) |  |
72 KB | 5 | |
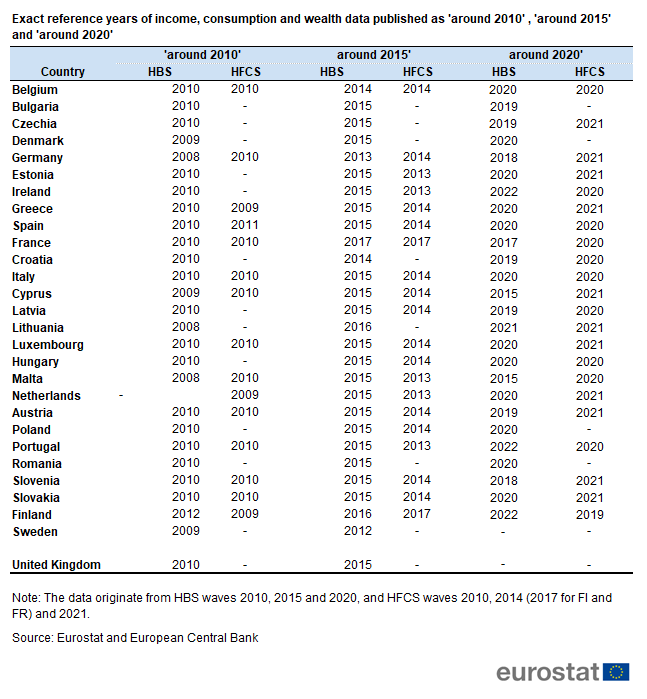
| 16:59, 7 June 2023 | Table1 HBS-HFCS reference years.png (file) |  |
52 KB | 7 |