Tutorials
Log in
Statistics Explained
menu
search
search
Navigation
Main page
Statistical themes
Glossary
Categories
Statistics 4 beginners
Tutorials
Help
Eurostat home
Education corner
Online publications
Regional yearbook
Sustainable development
Full list
Tools
User contributions
Logs
View user groups
Special pages
search
Navigation
Main page
Statistical themes
Glossary
Categories
Statistics 4 beginners
Tutorials
Help
Eurostat home
Education corner
Online publications
Regional yearbook
Sustainable development
Full list
Tools
User contributions
Logs
View user groups
Special pages
Navigation
Main page
Statistical themes
Glossary
Categories
Statistics 4 beginners
Tutorials
Help
Eurostat home
Education corner
Online publications
Regional yearbook
Sustainable development
Full list
Tools
User contributions
Logs
View user groups
Special pages
Uploads by Nparvado
This special page shows all uploaded files.
File list
Items per page:
20
50
100
250
500
Search for media name:
Username:
Include old versions of files
Go
First page
Previous page
Next page
Last page
Date
Name
Thumbnail
Size
Description
Versions
16:06, 18 September 2014
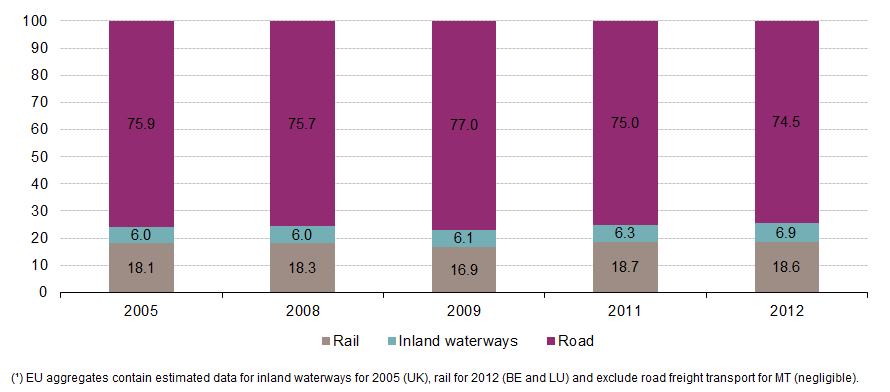
Freight transport in the EU-28, modal split of inland transport modes 2005 2012.png
(
file
)
24 KB
1
16:36, 18 September 2014
Modal split of inland transport table 1.png
(
file
)
79 KB
Reverted to version as of 14:28, 18 September 2014
3
16:41, 18 September 2014
Transport performance of inland modes 2005 2009.png
(
file
)
91 KB
1
16:49, 18 September 2014
Transport performance of inland modes 2005 - 2009.png
(
file
)
91 KB
1
16:50, 18 September 2014
Transport performance of inland modes 2005 - 2009, (continued).png
(
file
)
49 KB
1
16:58, 18 September 2014
International road transport performance, 2012.png
(
file
)
21 KB
3
17:03, 18 September 2014
International road freight transport, main foreign hauliers driving on national territory, 2012.png
(
file
)
64 KB
1
17:08, 18 September 2014
International road transport performance.png
(
file
)
26 KB
1
15:35, 25 September 2014
Freight transport in the EU-28, modal split of inland transport modes 2007 2012.png
(
file
)
24 KB
1
15:58, 25 September 2014
Modal split of inland transport, 2012.png
(
file
)
45 KB
2
16:01, 25 September 2014
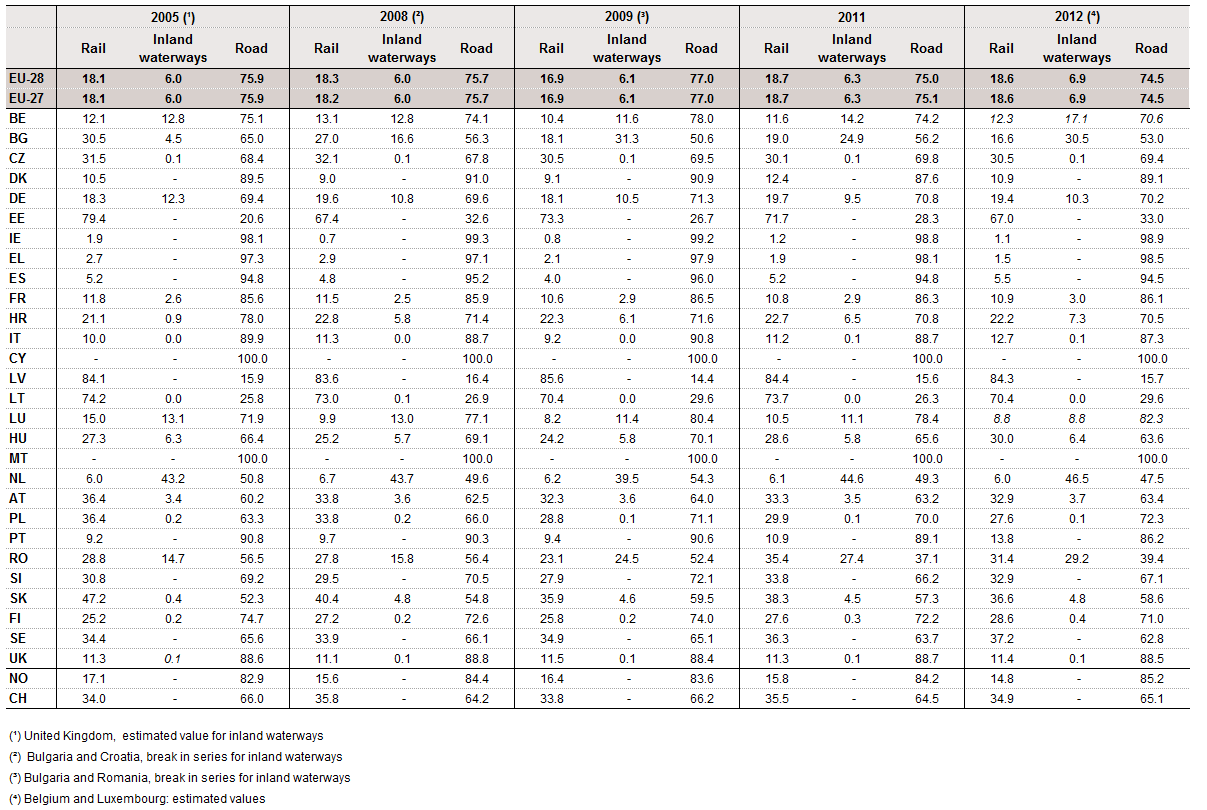
Modal split of inland transport - Table 1.png
(
file
)
77 KB
2
16:10, 25 September 2014
Modal split of inland transport, 2012 (% of total tkm).png
(
file
)
45 KB
1
16:12, 25 September 2014
Modal split of inland transport 2007-2012.png
(
file
)
77 KB
1
16:25, 25 September 2014
Table 1- Modal split of inland transport.png
(
file
)
77 KB
1
16:27, 25 September 2014
Table 1 Modal split of inland transport.png
(
file
)
77 KB
1
16:36, 25 September 2014
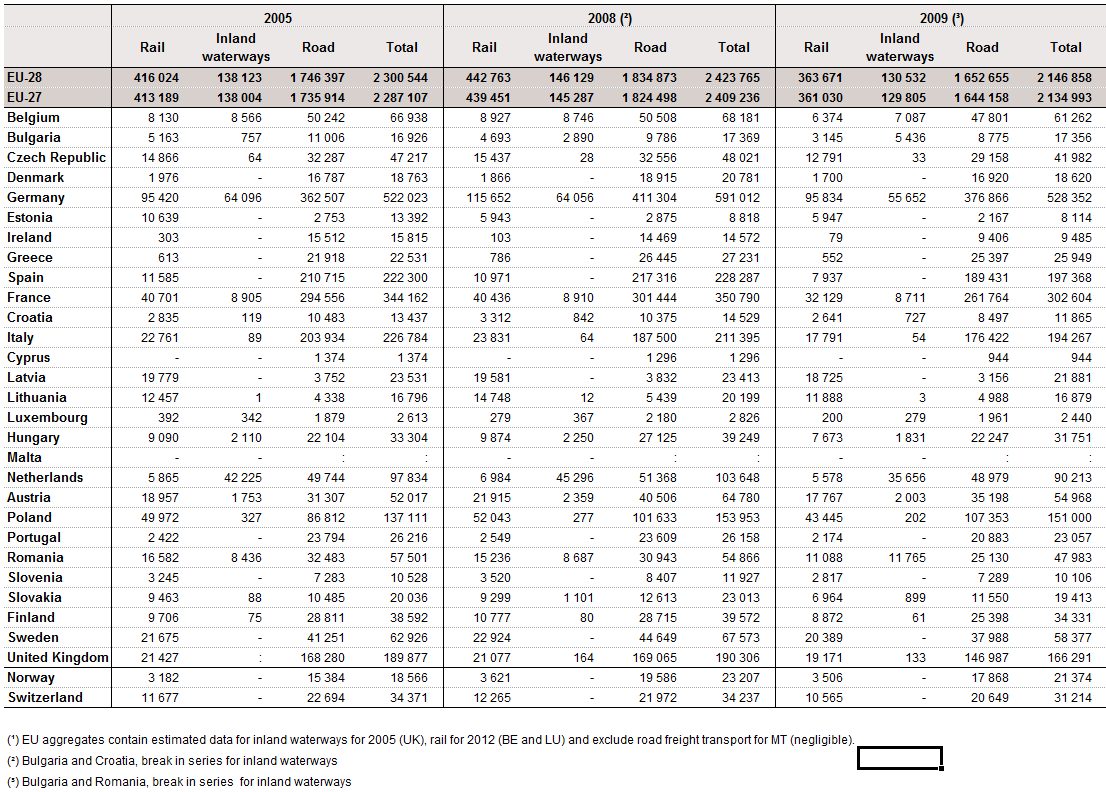
Table 2 Transport performance of inland modes.png
(
file
)
78 KB
1
16:36, 25 September 2014
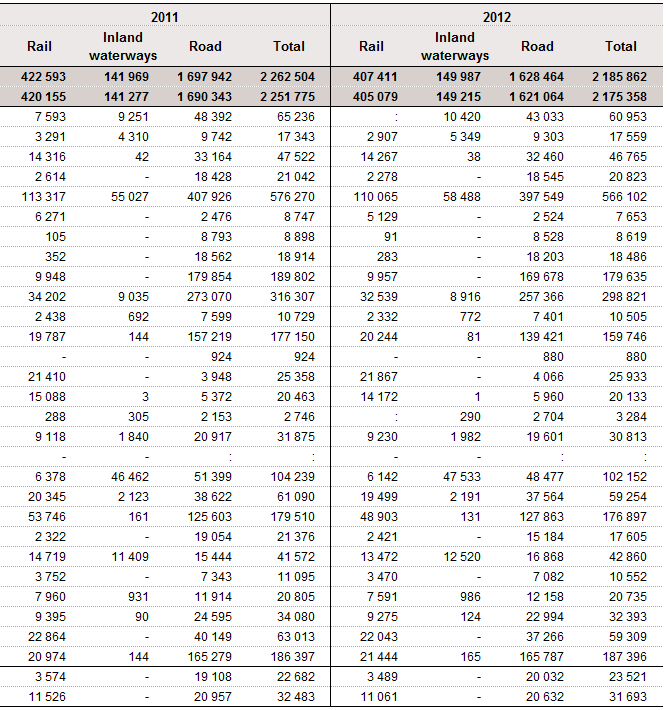
Table 2 Transport performance of inland modes (continued).png
(
file
)
77 KB
1
16:43, 25 September 2014
Table 4 International road freight transport main foreign hauliers driving on national territory.png
(
file
)
76 KB
1
11:07, 29 September 2014
2014 SE Modal split Datafile 290914.xlsx
(
file
)
77 KB
1
12:52, 28 October 2014
Table 5 Freight transport performance in the EU-28 (million tkm, ajusted for territoriality).png
(
file
)
13 KB
1
12:56, 28 October 2014
Table 5 Freight transport performance in the EU-28 (million tkm, adjusted for territoriality).png
(
file
)
13 KB
1
13:08, 28 October 2014
SE Modal split Datafile 28102014.xlsx
(
file
)
96 KB
3
13:09, 28 October 2014
SE Modalsplit Datafile 28102014.xlsx
(
file
)
96 KB
1
16:38, 10 November 2014
Figure 3 Freight transport in the EU-28 modal split based on five transport modes (% of total tonne-kilometres).png
(
file
)
21 KB
1
16:43, 10 November 2014
SE Modalsplit Datafile 10112014.xlsx
(
file
)
96 KB
1
17:15, 10 November 2014
SE Modalsplit Datafile 10112014 rev.xlsx
(
file
)
98 KB
1
12:43, 19 December 2014
Number of road traffic accident fatalities per million inhabitants, 2012.png
(
file
)
10 KB
1
12:46, 19 December 2014
Decrease in the total number of persons killed in road traffic accidents between 2008 and 2012 (%).png
(
file
)
9 KB
3
17:34, 19 December 2014
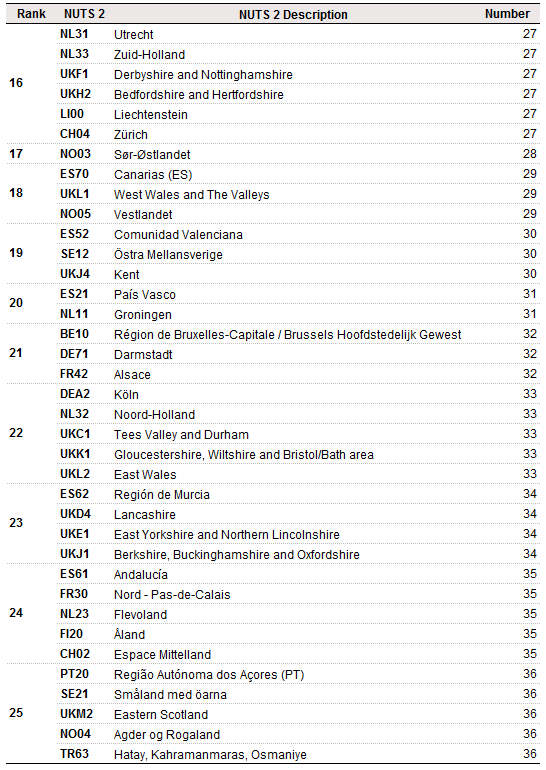
Ranking of the 25 NUTS 2 regions with the lowest number of road fatalities per million inhabitants in 2012.png
(
file
)
17 KB
1
17:35, 19 December 2014
Ranking of the 25 NUTS 2 regions with the lowest number of road fatalities per million inhabitants in 2012 (continued).png
(
file
)
23 KB
1
17:35, 19 December 2014
Ranking of the 25 NUTS 2 regions with the highest number of road fatalities per million inhabitants in 2012.png
(
file
)
18 KB
1
12:21, 15 January 2015
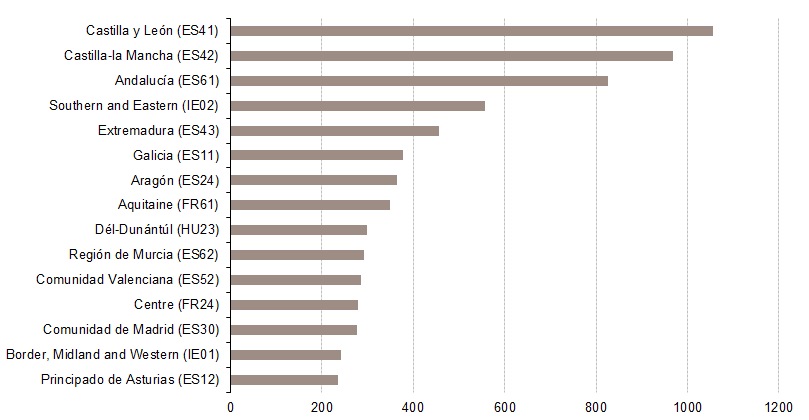
Regions with the most significant motorway expansion between 2000 and 2012 (kilometres).PNG
(
file
)
14 KB
1
12:22, 15 January 2015
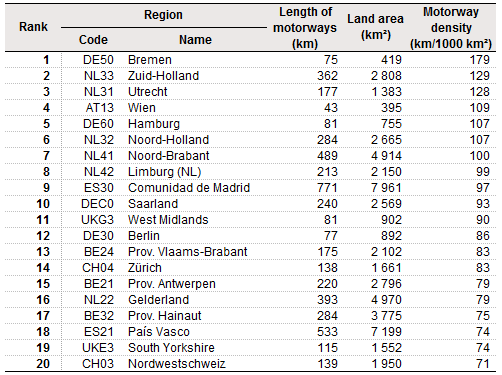
Regions with the highest motorway density in 2012(km 1000 km2).PNG
(
file
)
14 KB
1
12:40, 15 January 2015
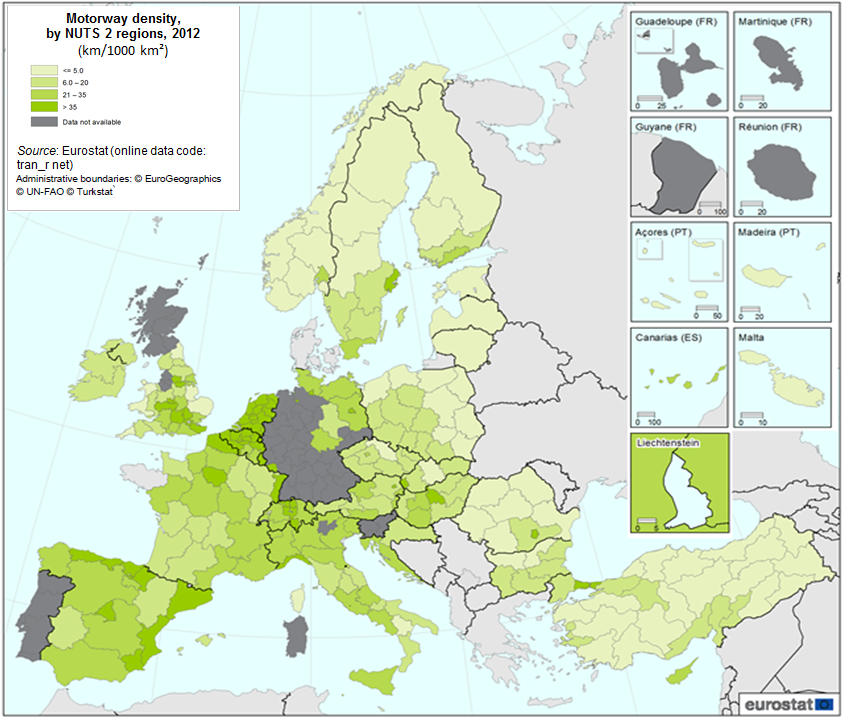
Motorway density (km 1000 km2) by regions, 2012.PNG
(
file
)
416 KB
1
11:57, 16 January 2015
Share of electrified lines in total railway network length, by country, 2012.PNG
(
file
)
7 KB
1
11:59, 16 January 2015
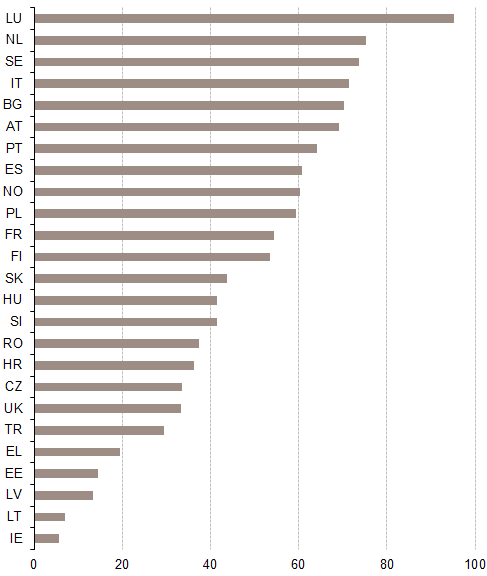
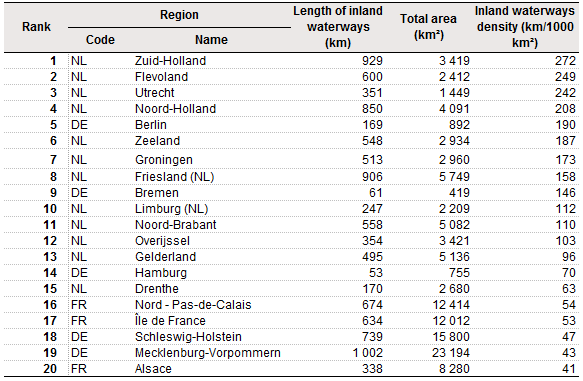
Regions with the highest inland waterways (navigable canals, rivers and lakes) density, 2012.PNG
(
file
)
14 KB
1
12:00, 16 January 2015
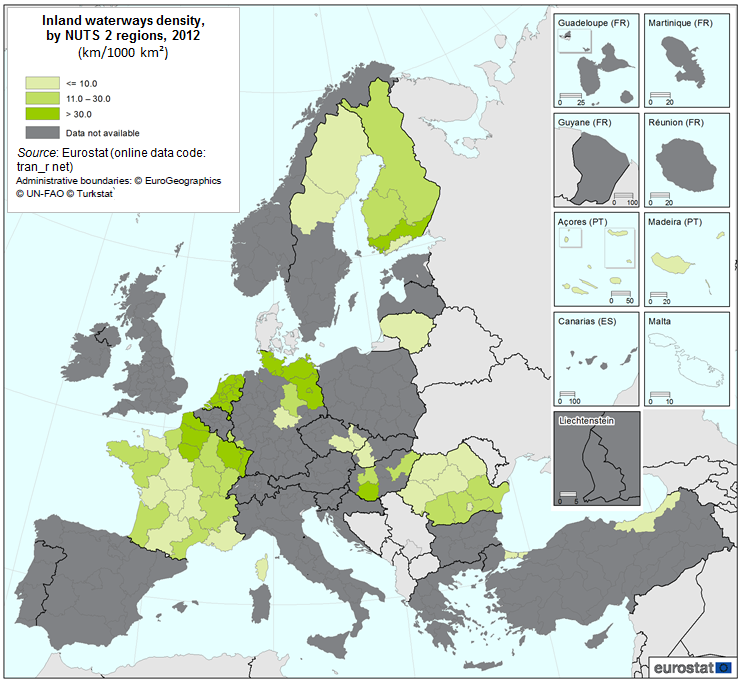
Inland waterways density by NUTS 2 regions 2012.PNG
(
file
)
248 KB
1
13:02, 21 January 2015
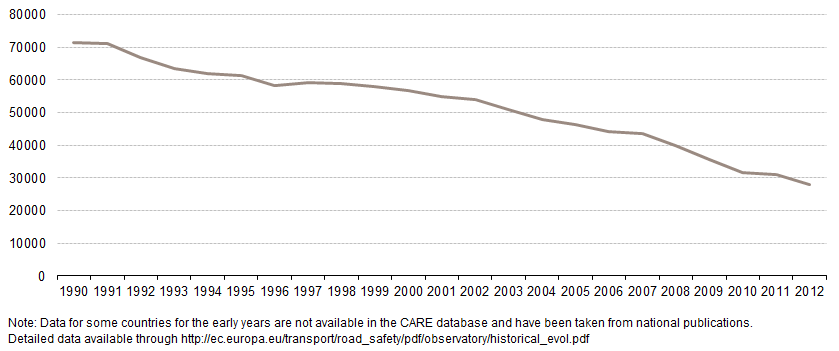
Total number of fatalities in road traffic accidents, EU-28.png
(
file
)
10 KB
3
14:56, 21 January 2015
Fig 1 Total number of fatalities in road traffic accidents, EU-28.png
(
file
)
10 KB
1
14:56, 21 January 2015
Fig 2 Decrease in the total number of persons killed in road traffic accidents between 2008 and 2012 (%).png
(
file
)
11 KB
1
14:57, 21 January 2015
Fig 3 Number of road traffic accident fatalities per million inhabitants, 2012.png
(
file
)
10 KB
1
14:57, 21 January 2015
Tab 1 Ranking of the 25 NUTS 2 regions with the lowest number of road fatalities per million inhabitants in 2012.png
(
file
)
17 KB
1
14:58, 21 January 2015
Tab 1 Ranking of the 25 NUTS 2 regions with the lowest number of road fatalities per million inhabitants in 2012 (continued).png
(
file
)
20 KB
1
14:58, 21 January 2015
Tab 2 Ranking of the 25 NUTS 2 regions with the highest number of road fatalities per million inhabitants in 2012.png
(
file
)
16 KB
1
12:45, 6 February 2015
Persons killed in railway accidents in the EU-28.PNG
(
file
)
6 KB
1
12:46, 6 February 2015
Number of rail accidents in the EU-28, 2007-2013.PNG
(
file
)
7 KB
1
12:48, 6 February 2015
Number of seriously injured persons in EU-28 rail accidents, by category of person.PNG
(
file
)
15 KB
1
14:18, 6 February 2015
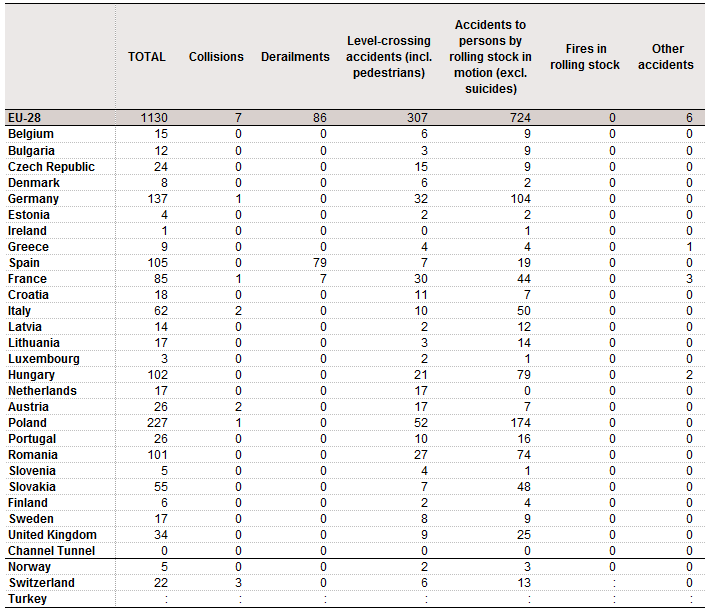
Number of persons killed in rail accidents, by type of accident, 2013.PNG
(
file
)
19 KB
1
14:19, 6 February 2015
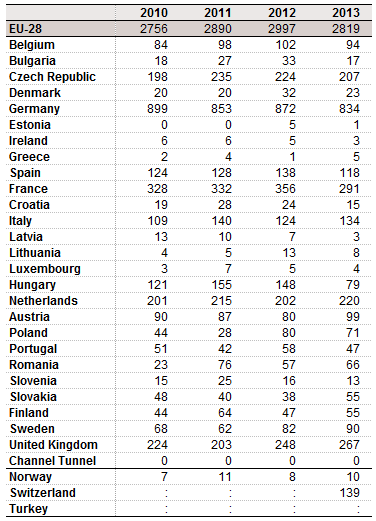
Suicides on railway premises.PNG
(
file
)
13 KB
1
11:49, 18 February 2015
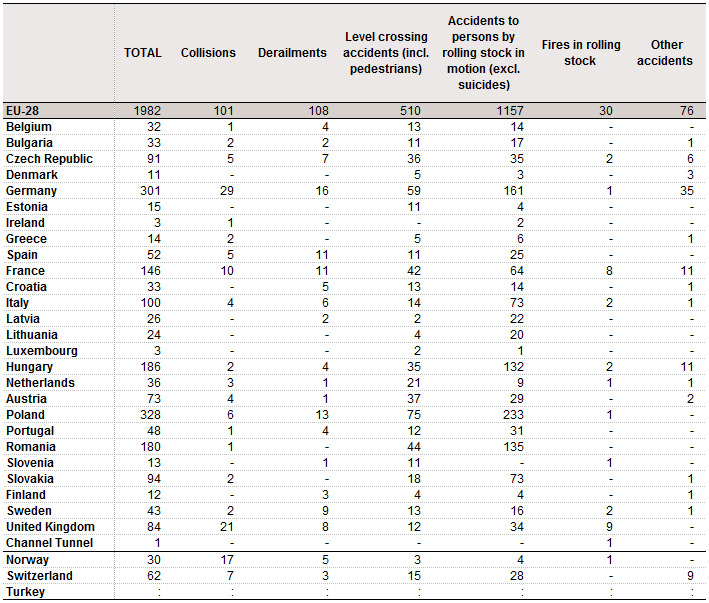
Number of rail accidents, by type of accident, 2013 (ERA data).PNG
(
file
)
36 KB
2
First page
Previous page
Next page
Last page
Special page
ISSN 2443-8219


.png)


.png)


.png)

.png)
.png)
.png)

.png)

.png)

.PNG)
.PNG)
_by_regions,_2012.PNG)

_density,_2012.PNG)


.png)


.png)


.PNG)