Tutorials
Log in
Statistics Explained
menu
search
search
Navigation
Main page
Statistical themes
Glossary
Categories
Statistics 4 beginners
Tutorials
Help
Eurostat home
Education corner
Online publications
Regional yearbook
Sustainable development
Full list
Tools
User contributions
Logs
View user groups
Special pages
search
Navigation
Main page
Statistical themes
Glossary
Categories
Statistics 4 beginners
Tutorials
Help
Eurostat home
Education corner
Online publications
Regional yearbook
Sustainable development
Full list
Tools
User contributions
Logs
View user groups
Special pages
Navigation
Main page
Statistical themes
Glossary
Categories
Statistics 4 beginners
Tutorials
Help
Eurostat home
Education corner
Online publications
Regional yearbook
Sustainable development
Full list
Tools
User contributions
Logs
View user groups
Special pages
Uploads by Marrare
This special page shows all uploaded files.
File list
Items per page:
20
50
100
250
500
Search for media name:
Username:
Include old versions of files
Go
First page
Previous page
Next page
Last page
Date
Name
Thumbnail
Size
Description
Versions
12:13, 27 March 2015
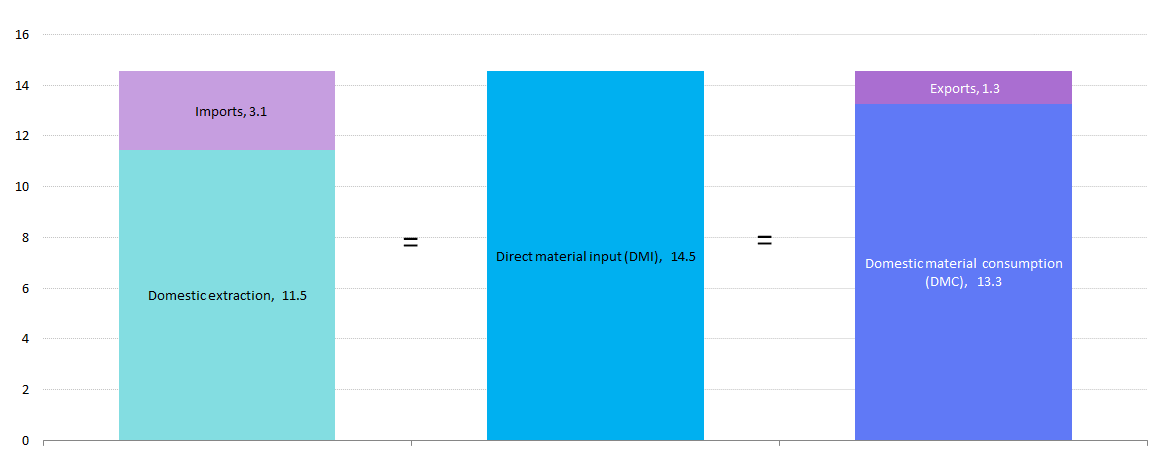
Materials available to EU-27 economies and how they are used, 2013 (tonnes per capita).png
(
file
)
16 KB
Fig1.png
3
12:16, 27 March 2015
Development of domestic extraction, physical imports and physical exports, EU-27 2000-2013 (Index 2000=100).png
(
file
)
19 KB
Fig2.png
2
12:17, 27 March 2015
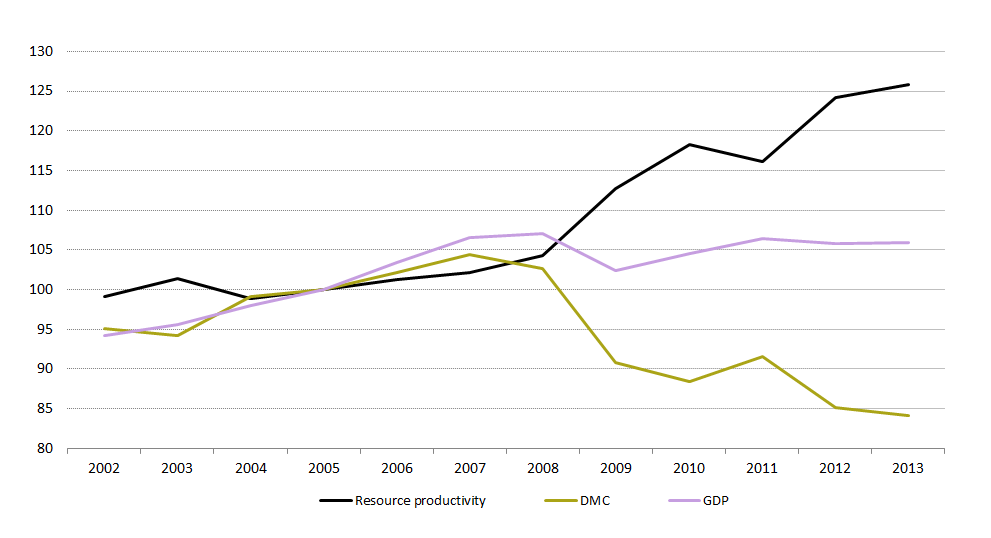
Resource productivity in comparison to GDP and DMC, EU-27, 2000-13 (Index 2000=100).png
(
file
)
22 KB
Fig3.png
2
12:18, 27 March 2015
Domestic material consumption (DMC) by main material categories, EU-27, 2013 (tonnes per capita).png
(
file
)
12 KB
Fig4.png
5
12:19, 27 March 2015
DMC by main material category EU-27 2000-2013.png
(
file
)
35 KB
Fig5.png
2
12:19, 27 March 2015
DMC by country and main material category 2013.png
(
file
)
51 KB
Fig6.png
2
12:21, 27 March 2015
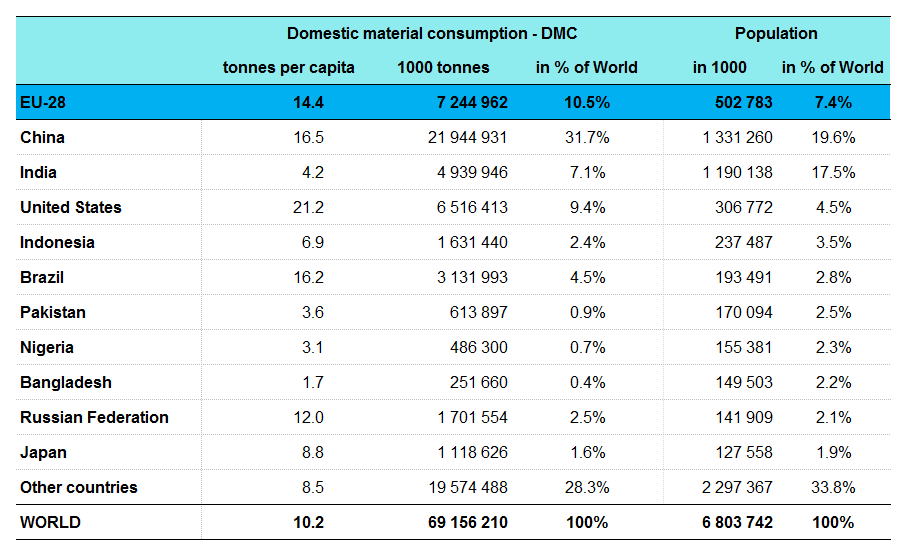
Material consumption in the EU compared to selected non-EU countries 2009.png
(
file
)
24 KB
Tab2.png
2
12:21, 27 March 2015
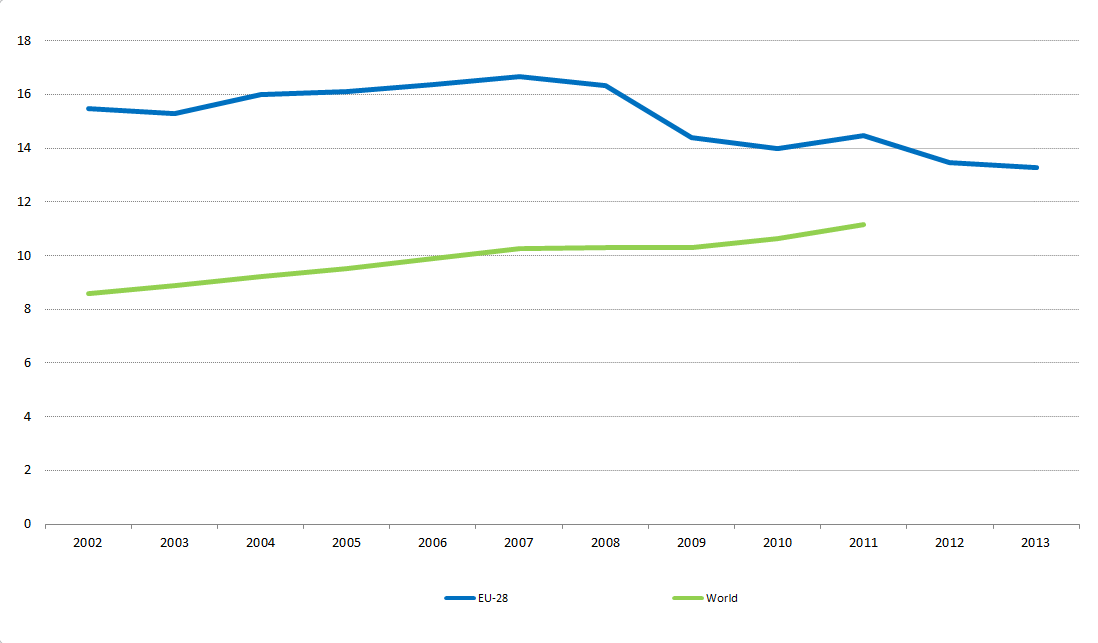
Material consumption EU-27 and world, 2000-2013.png
(
file
)
13 KB
Fig7.png
2
16:06, 27 March 2015
DMC average annual change rates 2000-2013 by main material categories and countries.png
(
file
)
25 KB
Tab1.png
3
17:30, 27 March 2015
1 Materials available to EU-28 economies and how they are used, 2013 (tonnes per capita).png
(
file
)
16 KB
1
17:36, 27 March 2015
2 Development of domestic extraction, imports and exports per capita, EU-28, 2002-13 (index 2005=100).png
(
file
)
19 KB
1
17:47, 27 March 2015
3 Resource productivity in comparison to GDP (¹) and DMC, EU-28, 2002-13 (Index 2005=100).png
(
file
)
22 KB
1
17:50, 27 March 2015
4 Domestic material consumption (DMC) by main material categories, EU-28, 2013 (tonnes per capita).png
(
file
)
12 KB
1
17:53, 27 March 2015
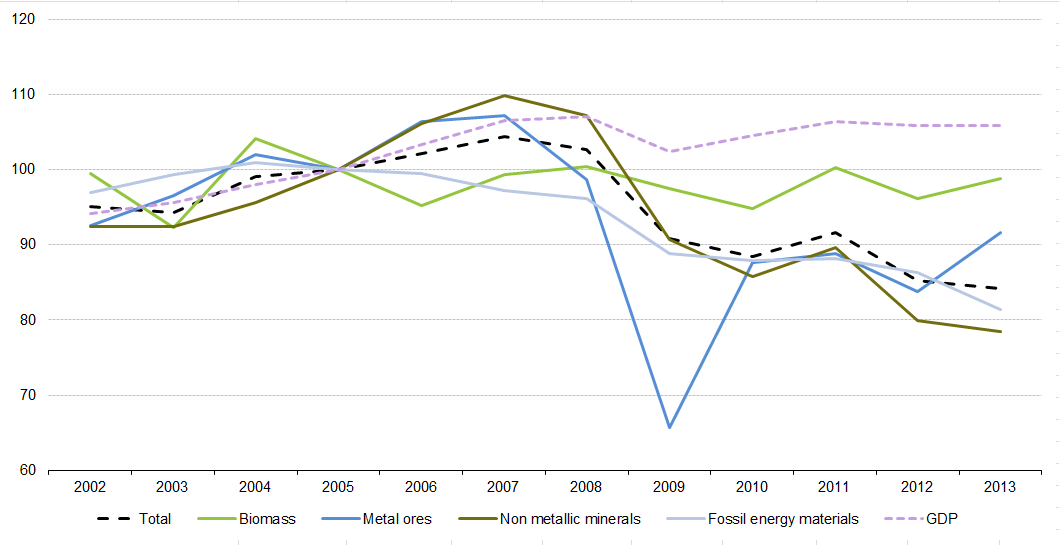
5 DMC by main material category, EU-28, 2002-2013 (Index 2005=100).png
(
file
)
35 KB
1
17:55, 27 March 2015
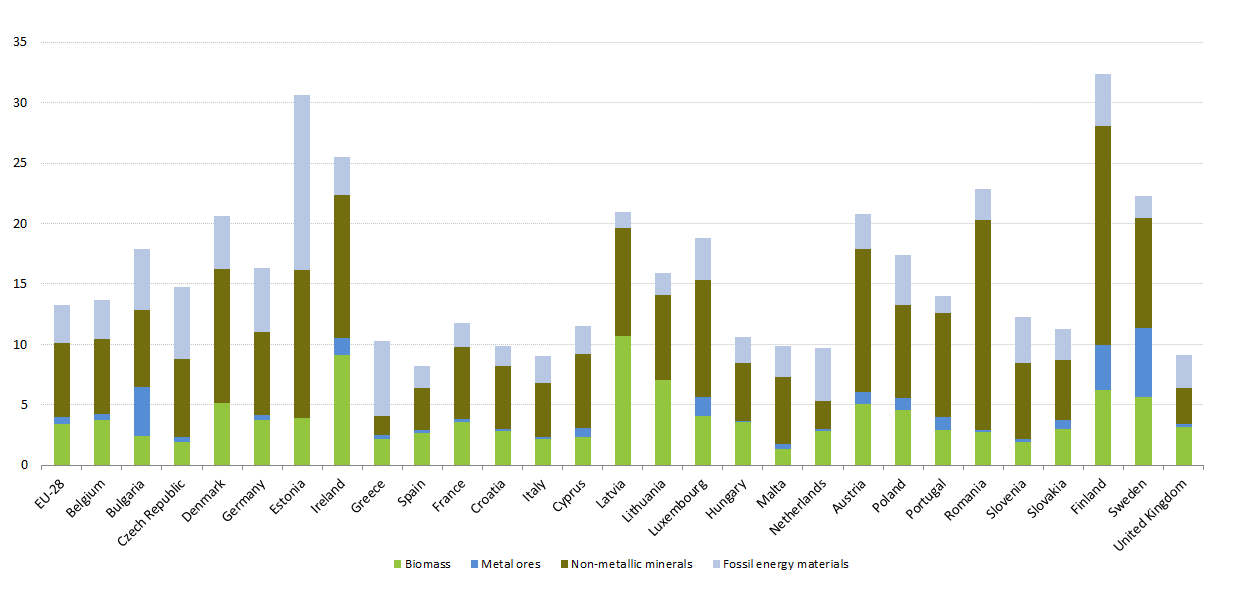
6 DMC by country and main material category, 2013 (tonnes per capita).png
(
file
)
51 KB
1
18:01, 27 March 2015
7 Material consumption EU-28 and world, 2002-2013 (tonnes per capita).png
(
file
)
13 KB
1
18:04, 27 March 2015
Tab2 Material consumption in the EU compared to selected non-EU countries 2009.png
(
file
)
24 KB
1
18:22, 27 March 2015
Tab1 DMC - average annual change rates 2002-2013 by main material categories and countries (%).png
(
file
)
25 KB
2
18:24, 27 March 2015
Tab1new DMC - average annual change rates 2002-2013 by main material categories and countries (%).png
(
file
)
25 KB
1
19:43, 27 March 2015
1 Resource productivity in comparison to GDP (¹) and DMC, EU-28, 2002-13 (Index 2005=100).png
(
file
)
20 KB
1
19:44, 27 March 2015
2 Resource productivity (¹), cross-country comparison, 2013.png
(
file
)
18 KB
1
19:45, 27 March 2015
Tab1 Resource productivity (¹), GDP and DMC, by countries, 2013.png
(
file
)
38 KB
1
19:45, 27 March 2015
Tab2 Resource productivity by country, 2002-13 (Index 2005=100).png
(
file
)
38 KB
1
21:27, 27 March 2015
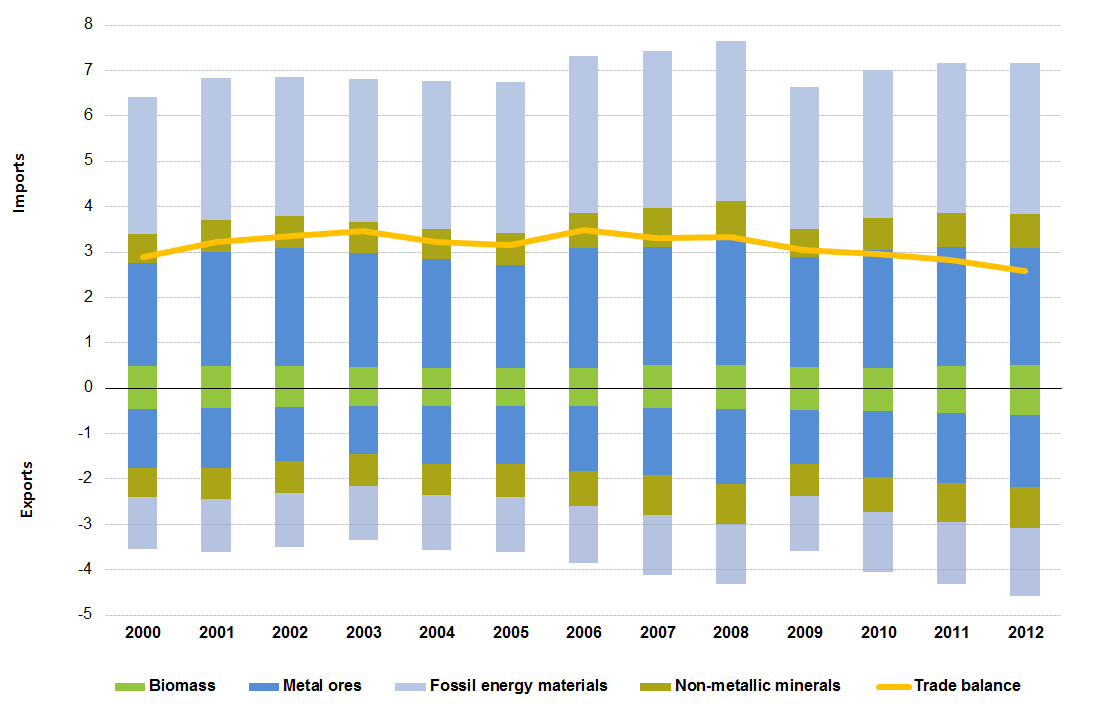
Fig5 Physical imports and exports of goods in raw material equivalents by main material category, EU-27, 2000-2012 (tonnes per capita).png
(
file
)
46 KB
1
21:28, 27 March 2015
Tab1 Import dependency by main material category, EU-28, 2002-2013 (% of extra-EU imports in total materials made available to EU-28 economy).png
(
file
)
9 KB
1
21:29, 27 March 2015
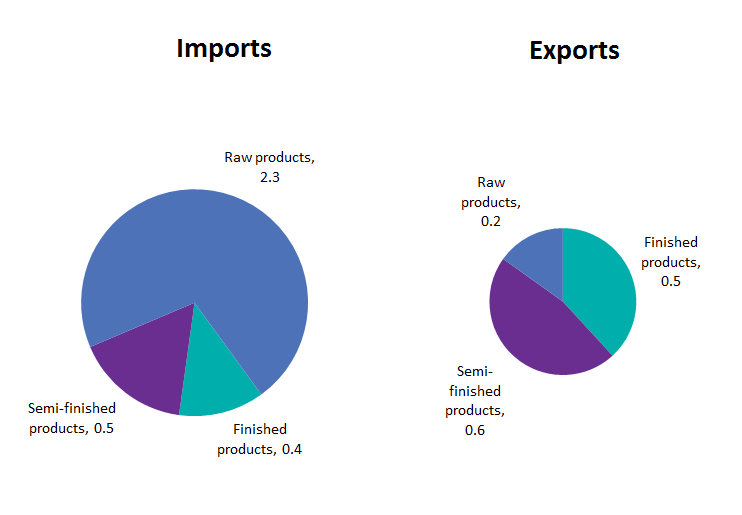
4 Extra EU imports and exports by stage of manufacturing, EU-28, 2012 (tonnes per capita).png
(
file
)
15 KB
1
21:29, 27 March 2015
3 Physical trade balance (imports minus exports) by country, 2013 (tonnes per capita).png
(
file
)
36 KB
1
21:29, 27 March 2015
2 Physical imports and exports by main material category, EU-28, 2013 (tonnes per capita).png
(
file
)
16 KB
1
21:30, 27 March 2015
1 Physical imports and exports of goods by main material category, EU-28, 2002-2013 (tonnes per capita).png
(
file
)
34 KB
1
13:41, 7 April 2015
Tab1new2 DMC - average annual change rates 2002-2013 by main material categories and countries (%).png
(
file
)
26 KB
1
15:36, 8 April 2015
Tab2new Material consumption in the EU compared to selected non-EU countries 2009.png
(
file
)
27 KB
1
16:25, 8 April 2015
Physical imports and exports of goods by main material category, EU-28, 2002-2013 (tonnes per capita).png
(
file
)
34 KB
1
16:28, 8 April 2015
Physical imports and exports by main material category, EU-28, 2013 (tonnes per capita).png
(
file
)
16 KB
1
16:30, 8 April 2015
Extra EU imports and exports by stage of manufacturing, EU-28, 2012 (tonnes per capita).png
(
file
)
15 KB
1
16:31, 8 April 2015
Import dependency by main material category, EU-28, 2002-2013 (% of extra-EU imports in total materials made available to EU-28 economy).png
(
file
)
9 KB
1
16:32, 8 April 2015
Physical imports and exports of goods in raw material equivalents by main material category, EU-27, 2000-2012 (tonnes per capita).png
(
file
)
46 KB
1
16:38, 8 April 2015
Resource productivity in comparison to GDP (¹) and DMC, EU-28, 2002-13 (Index 2005=100).png
(
file
)
20 KB
1
16:43, 8 April 2015
Resource productivity (¹), GDP and DMC, by country, 2013.png
(
file
)
38 KB
1
14:41, 9 April 2015
New Resource productivity (¹), cross-country comparison, 2013.png
(
file
)
19 KB
1
14:45, 9 April 2015
Resource productivity (¹), cross-country comparison, 2013.png
(
file
)
19 KB
5
14:59, 9 April 2015
Material flow accounts April2015.xlsx
(
file
)
87 KB
1
15:05, 9 April 2015
Resource productivity (¹), cross-country comparison, 2013 new.png
(
file
)
19 KB
1
15:13, 9 April 2015
Physical imports and exports April2015.xlsx
(
file
)
88 KB
1
15:18, 9 April 2015
Resource productivity April2015.xlsx
(
file
)
63 KB
1
21:27, 25 April 2015
Materials available to EU-28 economies and how they are used, 2013 (tonnes per capita).png
(
file
)
16 KB
2
21:29, 25 April 2015
Development of domestic extraction, physical imports and physical exports, EU-28 2002-2013 (Index 2002=100).png
(
file
)
20 KB
1
21:30, 25 April 2015
Resource productivity in comparison to GDP and DMC, EU-28, 2002-2013 (Index 2002=100).png
(
file
)
20 KB
1
21:31, 25 April 2015
Domestic material consumption (DMC) by main material categories, EU-28, 2013 (tonnes per capita).png
(
file
)
12 KB
1
21:31, 25 April 2015
DMC by main material category, EU-28, 2002-2013 (Index 2002=100).png
(
file
)
38 KB
1
21:33, 25 April 2015
DMC by country and main material category, 2013 (tonnes per capita).png
(
file
)
51 KB
1
First page
Previous page
Next page
Last page
Special page
ISSN 2443-8219
.png)
.png)
.png)
_by_main_material_categories,_EU-27,_2013_(tonnes_per_capita).png)


.png)
.png)
_and_DMC,_EU-28,_2002-13_(Index_2005%3D100).png)
_by_main_material_categories,_EU-28,_2013_(tonnes_per_capita).png)
.png)
.png)
.png)

.png)
.png)
_and_DMC,_EU-28,_2002-13_(Index_2005%3D100).png)
,_cross-country_comparison,_2013.png)
,_GDP_and_DMC,_by_countries,_2013.png)
.png)
.png)
.png)
_by_country,_2013_(tonnes_per_capita).png)
.png)
.png)
.png)

.png)
.png)
.png)
.png)
_and_DMC,_EU-28,_2002-13_(Index_2005%3D100).png)
,_GDP_and_DMC,_by_country,_2013.png)
,_cross-country_comparison,_2013.png)
,_cross-country_comparison,_2013.png)
,_cross-country_comparison,_2013_new.png)
.png)
.png)
.png)
_by_main_material_categories,_EU-28,_2013_(tonnes_per_capita).png)
.png)
.png)
.png)
.png)