Tutorials
Log in
Statistics Explained
menu
search
search
Navigation
Main page
Statistical themes
Glossary
Categories
Statistics 4 beginners
Tutorials
Help
Eurostat home
Education corner
Online publications
Regional yearbook
Sustainable development
Full list
Tools
User contributions
Logs
View user groups
Special pages
search
Navigation
Main page
Statistical themes
Glossary
Categories
Statistics 4 beginners
Tutorials
Help
Eurostat home
Education corner
Online publications
Regional yearbook
Sustainable development
Full list
Tools
User contributions
Logs
View user groups
Special pages
Navigation
Main page
Statistical themes
Glossary
Categories
Statistics 4 beginners
Tutorials
Help
Eurostat home
Education corner
Online publications
Regional yearbook
Sustainable development
Full list
Tools
User contributions
Logs
View user groups
Special pages
Uploads by Marcumc
This special page shows all uploaded files.
File list
Items per page:
20
50
100
250
500
Search for media name:
Username:
Include old versions of files
Go
First page
Previous page
Next page
Last page
Date
Name
Thumbnail
Size
Description
Versions
12:13, 5 October 2010
Population change, net migration (including corrections) and natural populationchange, EU-27(million).PNG
(
file
)
4 KB
2
12:16, 5 October 2010
Population change by component, EU-27, 1990-2009.png
(
file
)
10 KB
1
12:21, 5 October 2010
Population on 1 January, EU-27, 1960-2010.png
(
file
)
4 KB
1
13:31, 5 October 2010
Population on 1 January, EU-27, 1960-2010.PNG
(
file
)
4 KB
1
13:34, 5 October 2010
Population change by component, EU-27, 1961-2009.PNG
(
file
)
10 KB
1
13:45, 5 October 2010
Live births and deaths in EU-27, 1961-2009.PNG
(
file
)
5 KB
1
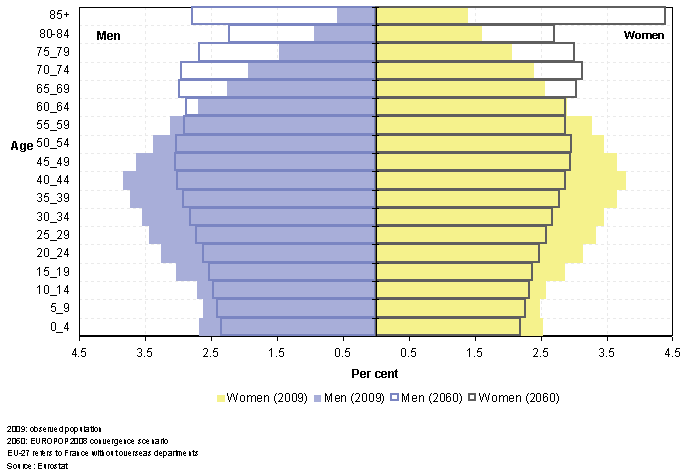
19:22, 6 October 2010
Population pyramids, EU-27, 2009 and 2060.PNG
(
file
)
7 KB
1
19:31, 6 October 2010
Population pyramids, EU-27, 1990 and 2009.PNG
(
file
)
7 KB
2
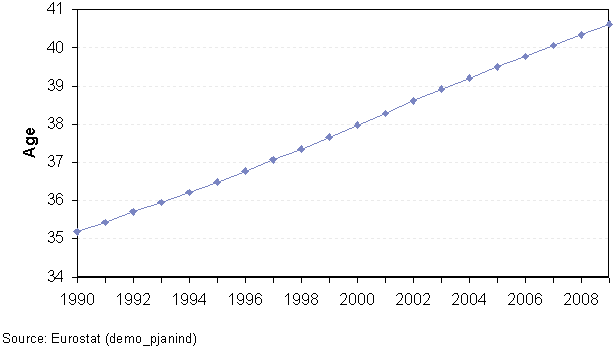
19:55, 6 October 2010
Median age of population, EU-27, 1990-2009.PNG
(
file
)
4 KB
1
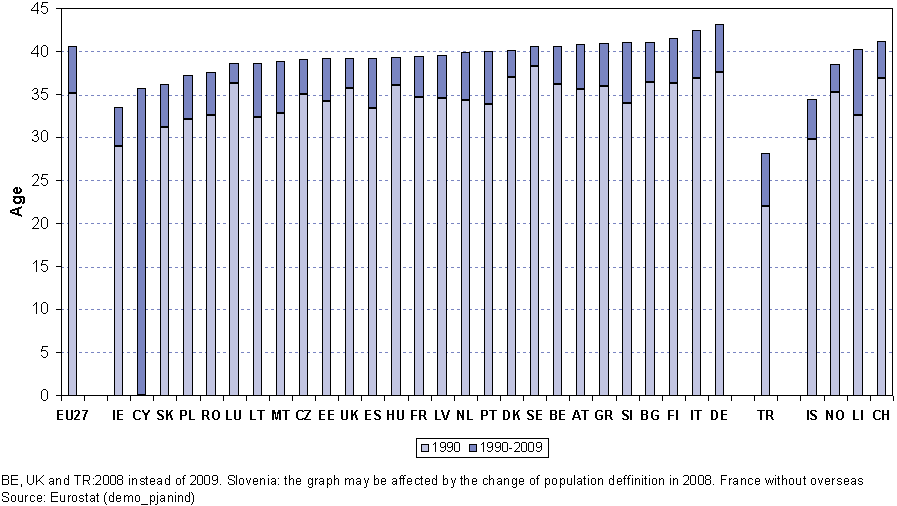
19:56, 6 October 2010
Median age of population at national level, evolution between 1990 and 2009.PNG
(
file
)
11 KB
1
19:59, 6 October 2010
Population Pyramids, EU-27, 2009 and 2060.PNG
(
file
)
8 KB
1
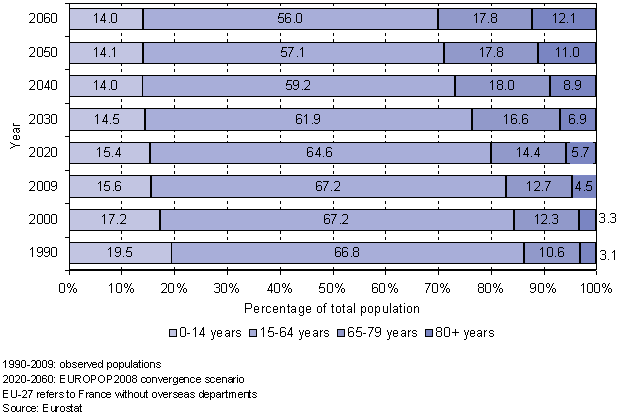
20:00, 6 October 2010
Population age structure by major age groups, EU-27, 2009-2060.PNG
(
file
)
7 KB
1
11:12, 13 October 2010
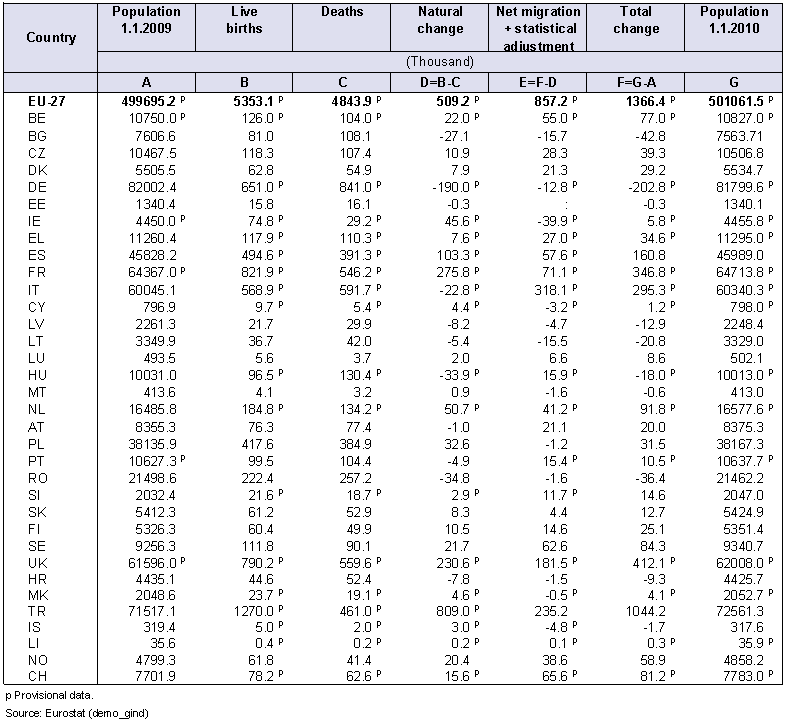
Demographic balance in 2009.PNG
(
file
)
22 KB
2
11:14, 13 October 2010
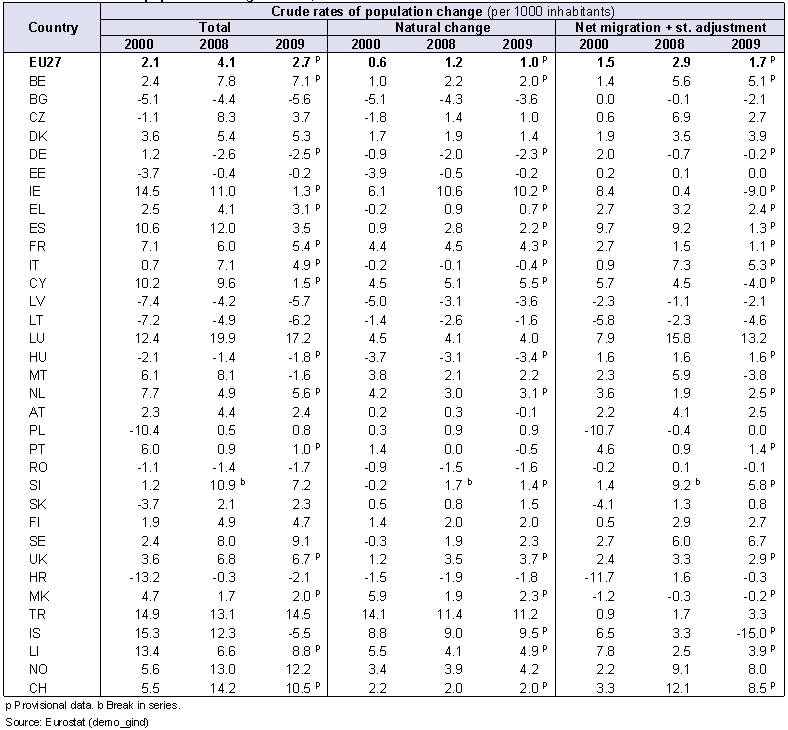
Crude rates of population change in 2000, 2008 and 2009.png
(
file
)
20 KB
2
18:16, 13 October 2010
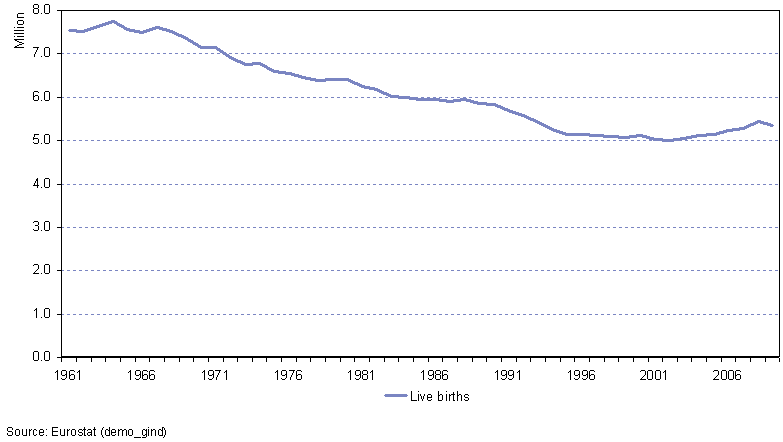
Number of live births in EU-27, 1961-2009.PNG
(
file
)
4 KB
1
18:17, 13 October 2010
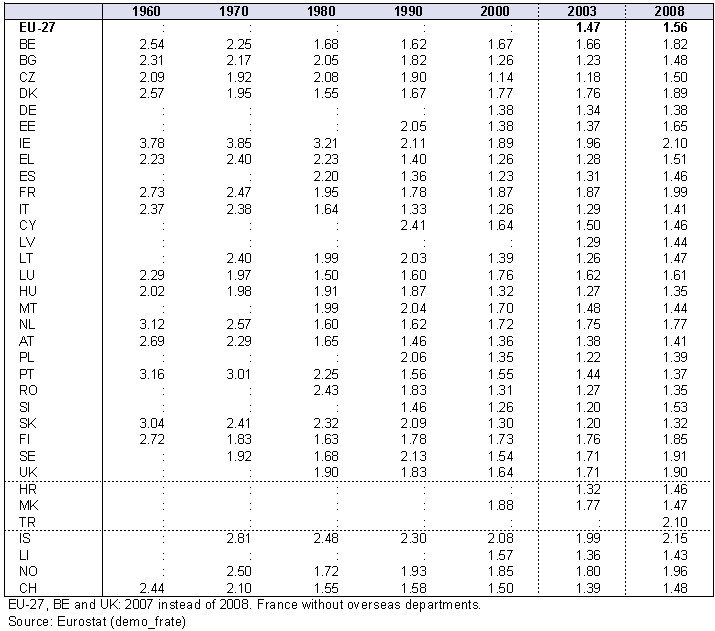
Total fertility rate, EU-27 MS, EFTA and CC, time series selected years.PNG
(
file
)
15 KB
1
18:19, 13 October 2010
Total fertility rate (children per woman).PNG
(
file
)
15 KB
1
18:21, 13 October 2010
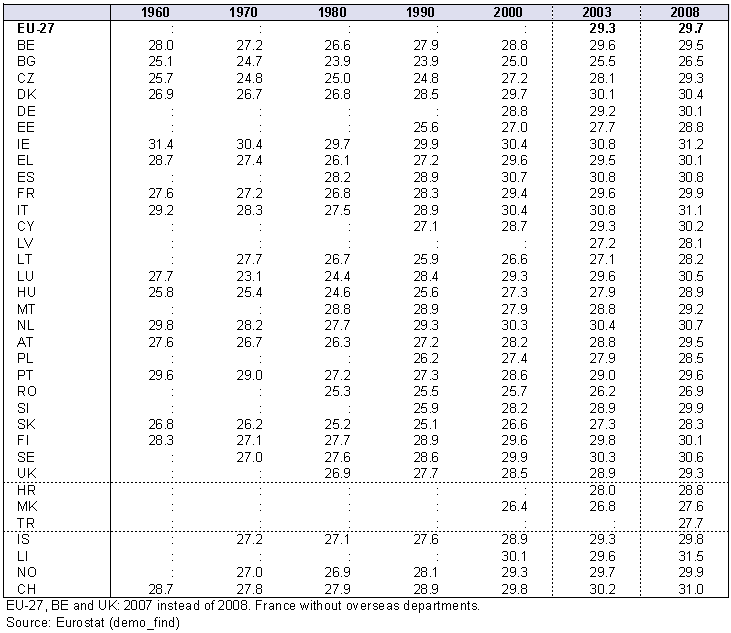
Mean age of women at childbearing.PNG
(
file
)
15 KB
1
19:17, 14 October 2010
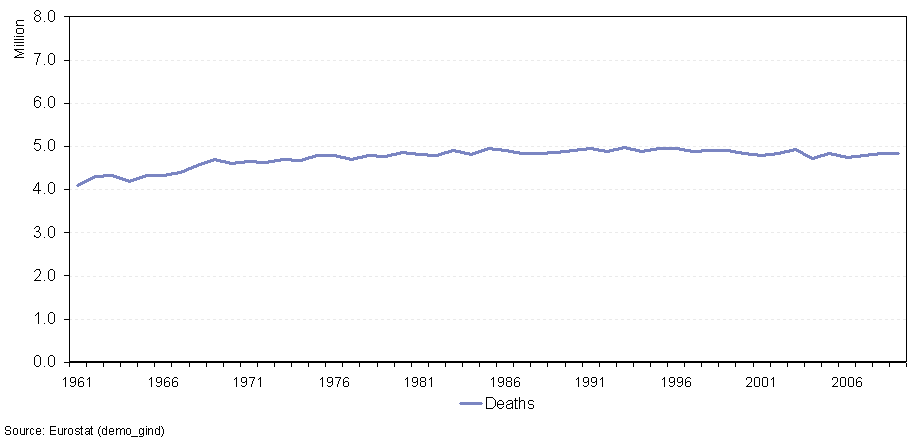
Number of deaths in EU-27, 1961-2009 (million).png
(
file
)
4 KB
1
19:18, 14 October 2010
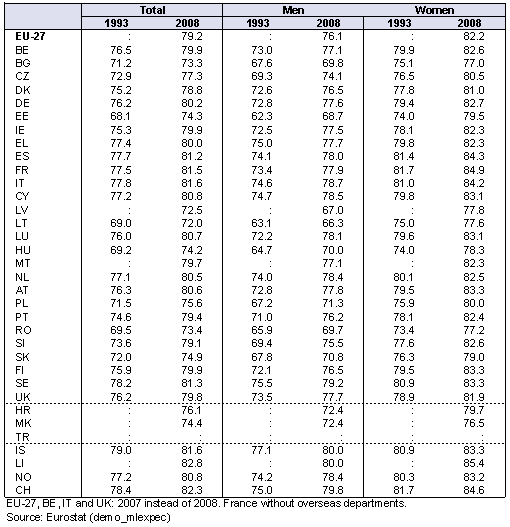
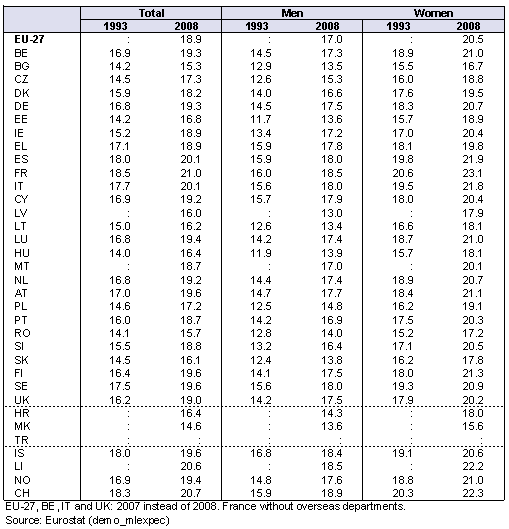
Life expectancy at birth by sex, 1993 and 2008 (years).png
(
file
)
11 KB
1
19:18, 14 October 2010
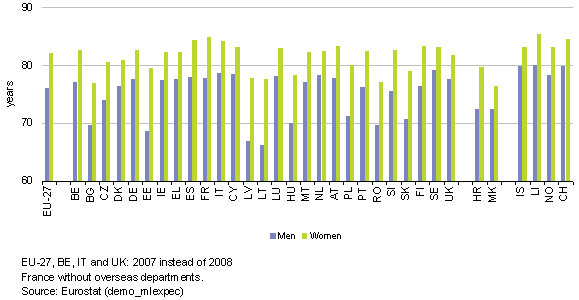
Life expectancy at birth by sex, 2008 (years).png
(
file
)
4 KB
1
19:49, 14 October 2010
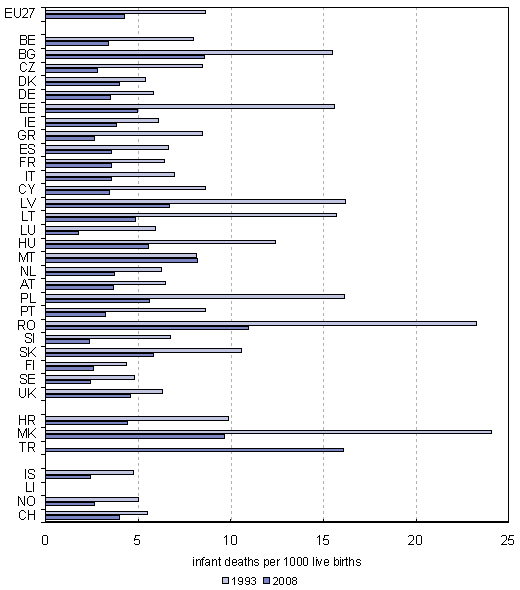
Infant mortality rate, 1993 and 2008.png
(
file
)
6 KB
1
15:00, 15 October 2010
Mean age of women at childbirth.PNG
(
file
)
15 KB
1
17:26, 15 October 2010
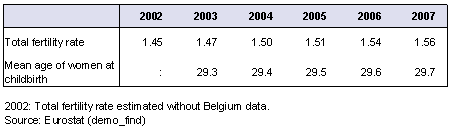
Fertility indicators, EU-27, 2002-2007.PNG
(
file
)
2 KB
4
17:27, 15 October 2010
Fertility indicators in EU-27, 2002-2007.PNG
(
file
)
2 KB
1
17:56, 15 October 2010
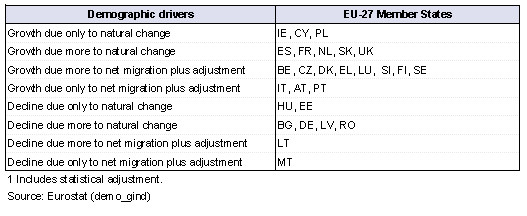
EU-27 Member States by contribution of natural and net migration1 to population growth decline in 2009.PNG
(
file
)
4 KB
2
17:58, 15 October 2010
EU-27 Member States by the contribution of natural and net migration plus adjustment to population growth decline in 2009.PNG
(
file
)
4 KB
1
18:09, 15 October 2010
Life expectancy at age 65 by sex, 1993 and 2008 (years).PNG
(
file
)
11 KB
2
13:40, 18 October 2010
Live births outside marriage, as share of total live births (%).PNG
(
file
)
10 KB
1
13:44, 18 October 2010
Between 1990 and 2009.PNG
(
file
)
7 KB
5
20:24, 28 October 2010
World population by continent, 2010.png
(
file
)
7 KB
1
20:33, 28 October 2010
Population (1), (1960=100).png
(
file
)
4 KB
1
20:45, 28 October 2010
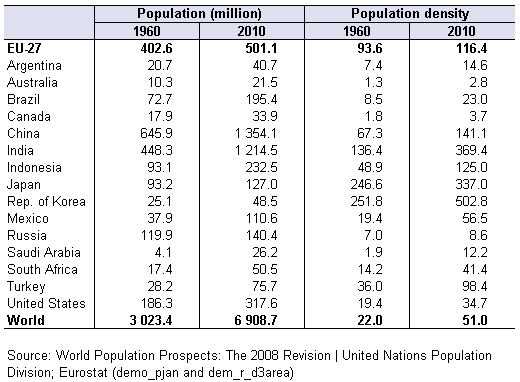
Population and population density in the World, in EU-27 and other emerging economies, 1960 and 2010.png
(
file
)
8 KB
1
20:49, 28 October 2010
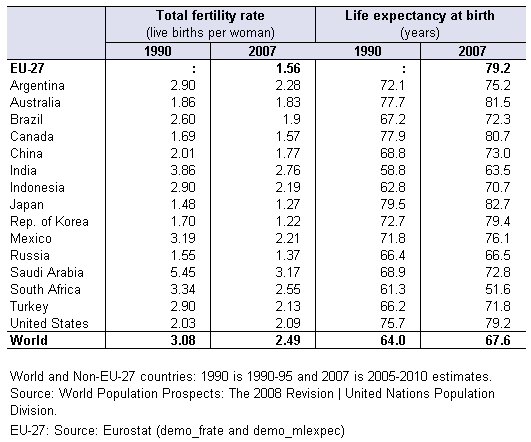
Fertility and mortality in the World, in EU-27 and other emerging economies, 1990 and 2007.png
(
file
)
9 KB
1
20:53, 28 October 2010
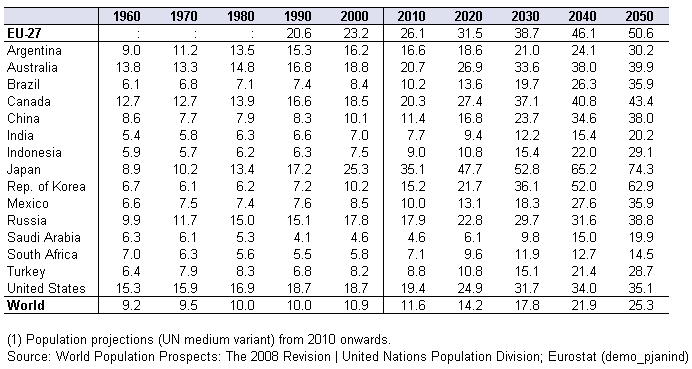
Old-age dependency ratio (1), World, EU-27 and other emerging economies 1960-2050.png
(
file
)
12 KB
1
20:58, 28 October 2010
Population and population density in the World, in EU-27 and other major countries, 1960 and 2010.png
(
file
)
8 KB
1
21:01, 28 October 2010
Population and population density in the World, in EU-27 and major countries, 1960 and 2010.png
(
file
)
8 KB
1
21:01, 28 October 2010
Fertility and mortality in the World, in the EU-27 and major countries, 1990 and 2007.png
(
file
)
9 KB
1
21:02, 28 October 2010
Old-age dependency ratio (1), World, EU-27 and major countries 1960-2050.png
(
file
)
12 KB
1
18:43, 29 October 2010
Population age structure by major age groups, 1990 and 2009.PNG
(
file
)
13 KB
4
18:51, 29 October 2010
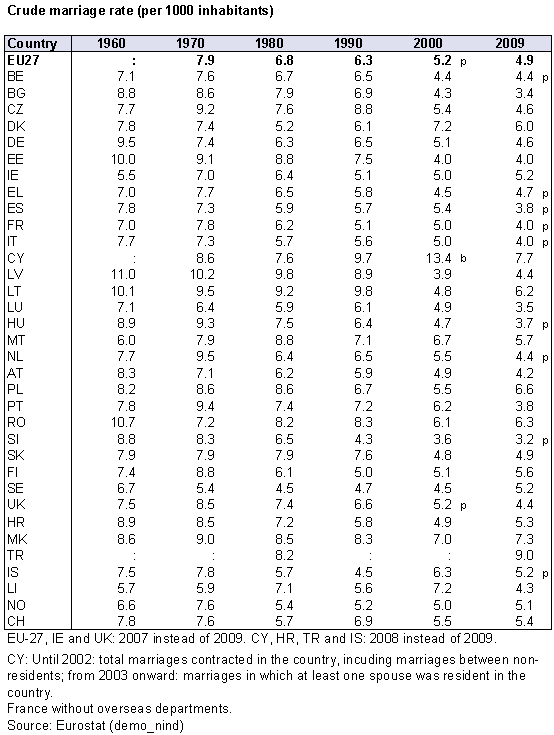
Crude marriage rate (per 1000 inhabitants).PNG
(
file
)
14 KB
2
18:52, 29 October 2010
Crude divorce rate (per 1000 inhabitants).PNG
(
file
)
12 KB
2
19:38, 29 October 2010
Population age structure indicators, 2009.PNG
(
file
)
13 KB
3
20:01, 29 October 2010
Recent observations on life expectancy at birth in EU-27.png
(
file
)
3 KB
2
20:22, 29 October 2010
Life expectancy at birth - Gender gap, 2008 (years).png
(
file
)
4 KB
1
20:35, 29 October 2010
Crude marriage and divorce rates in EU-27.PNG
(
file
)
3 KB
1
20:53, 29 October 2010
Live births outside marriage, 2008.PNG
(
file
)
5 KB
1
14:11, 17 October 2011
Population and population change 2012.xls
(
file
)
140 KB
1
14:28, 17 October 2011
Population, EU-27 (1) (at 1 January, million).png
(
file
)
2 KB
3
14:34, 17 October 2011
Births and deaths, EU-27 (million).png
(
file
)
3 KB
3
First page
Previous page
Next page
Last page
Special page
ISSN 2443-8219
_and_natural_populationchange,_EU-27(million).PNG)


.PNG)

.png)
.png)
.png)


.PNG)
.PNG)


,_(1960%3D100).png)


,_World,_EU-27_and_other_emerging_economies_1960-2050.png)


,_World,_EU-27_and_major_countries_1960-2050.png)

.PNG)
.PNG)


.png)


_(at_1_January,_million).png)
.png)