Tutorials
Log in
Statistics Explained
menu
search
search
Navigation
Main page
Statistical themes
Glossary
Categories
Statistics 4 beginners
Tutorials
Help
Eurostat home
Education corner
Online publications
Regional yearbook
Sustainable development
Full list
Tools
User contributions
Logs
View user groups
Special pages
search
Navigation
Main page
Statistical themes
Glossary
Categories
Statistics 4 beginners
Tutorials
Help
Eurostat home
Education corner
Online publications
Regional yearbook
Sustainable development
Full list
Tools
User contributions
Logs
View user groups
Special pages
Navigation
Main page
Statistical themes
Glossary
Categories
Statistics 4 beginners
Tutorials
Help
Eurostat home
Education corner
Online publications
Regional yearbook
Sustainable development
Full list
Tools
User contributions
Logs
View user groups
Special pages
Uploads by ChristianeG
This special page shows all uploaded files.
File list
Items per page:
20
50
100
250
500
Search for media name:
Username:
Include old versions of files
Go
First page
Previous page
Next page
Last page
Date
Name
Thumbnail
Size
Description
Versions
10:07, 15 June 2017
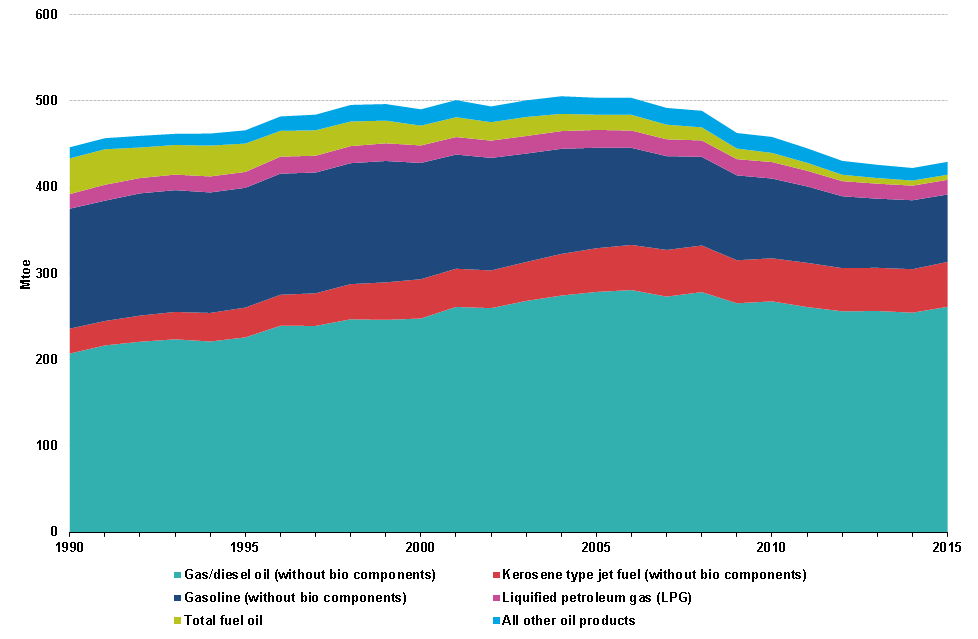
Consumption of oil EU-28, 1990-2015, Mtoe.png
(
file
)
21 KB
1
10:07, 15 June 2017
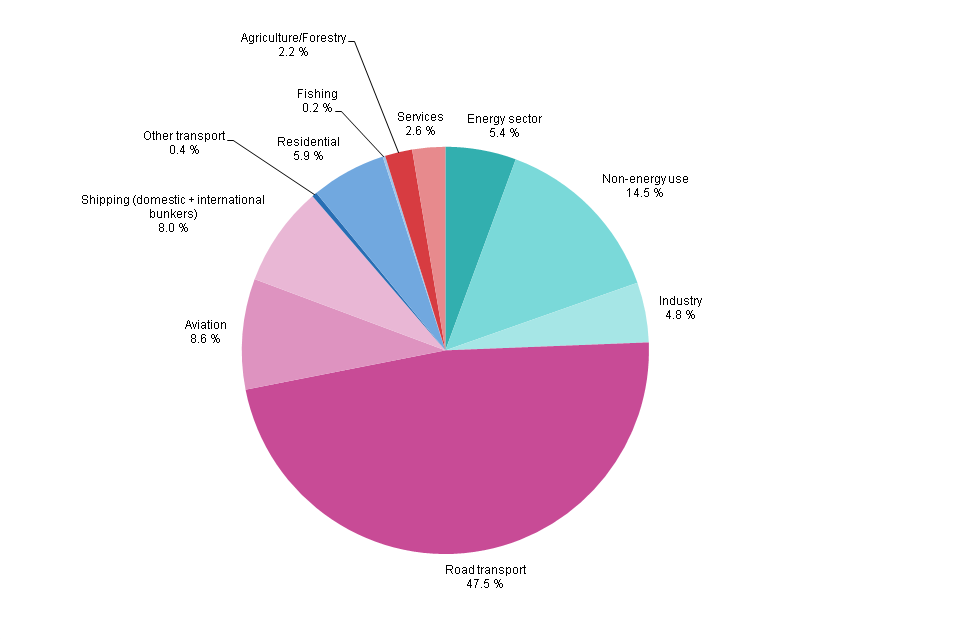
Consumption of oil EU-28, 2015, percentage.png
(
file
)
25 KB
1
10:08, 15 June 2017
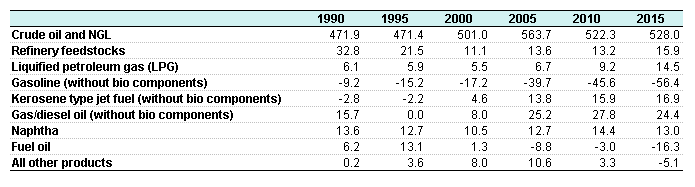
Imports of selected oil products into EU-28, 1990-2015, Mtoe.png
(
file
)
9 KB
1
10:09, 15 June 2017
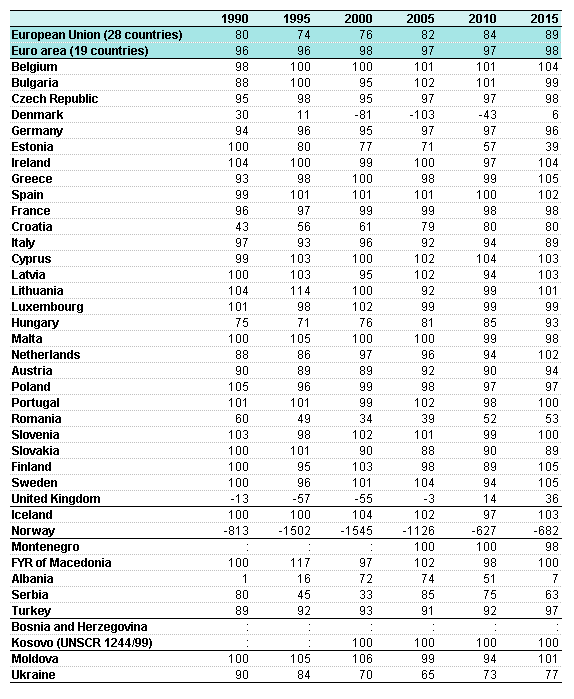
Oil import dependency, 1990-2015, percentage.png
(
file
)
24 KB
1
10:09, 15 June 2017
Primary production of Crude oil, 1990-2015, Mtoe.png
(
file
)
35 KB
1
10:10, 15 June 2017
Sectoral oil dependency, 1990-2015, percentage.png
(
file
)
7 KB
1
10:10, 15 June 2017
Use of fuels in transport, EU-28, 1990-2015, ktoe.png
(
file
)
25 KB
1
10:12, 15 June 2017
EU-28 net imports of crude oil by country of origin, 2000-2015, Mt.png
(
file
)
20 KB
2
08:56, 20 June 2017
Imports of selected energy products, EU-28, 1990-2015, ktoe F2.png
(
file
)
31 KB
1
08:57, 20 June 2017
Exports of selected energy products, EU-28, 1990-2015, ktoe F3.png
(
file
)
50 KB
1
08:57, 20 June 2017
Gross inland energy consumption, EU-28, 1990-2015, ktoe F4.png
(
file
)
23 KB
1
08:57, 20 June 2017
Gross inland energy consumption, EU-28, 1990-2015, ktoe F5.png
(
file
)
34 KB
1
08:58, 20 June 2017
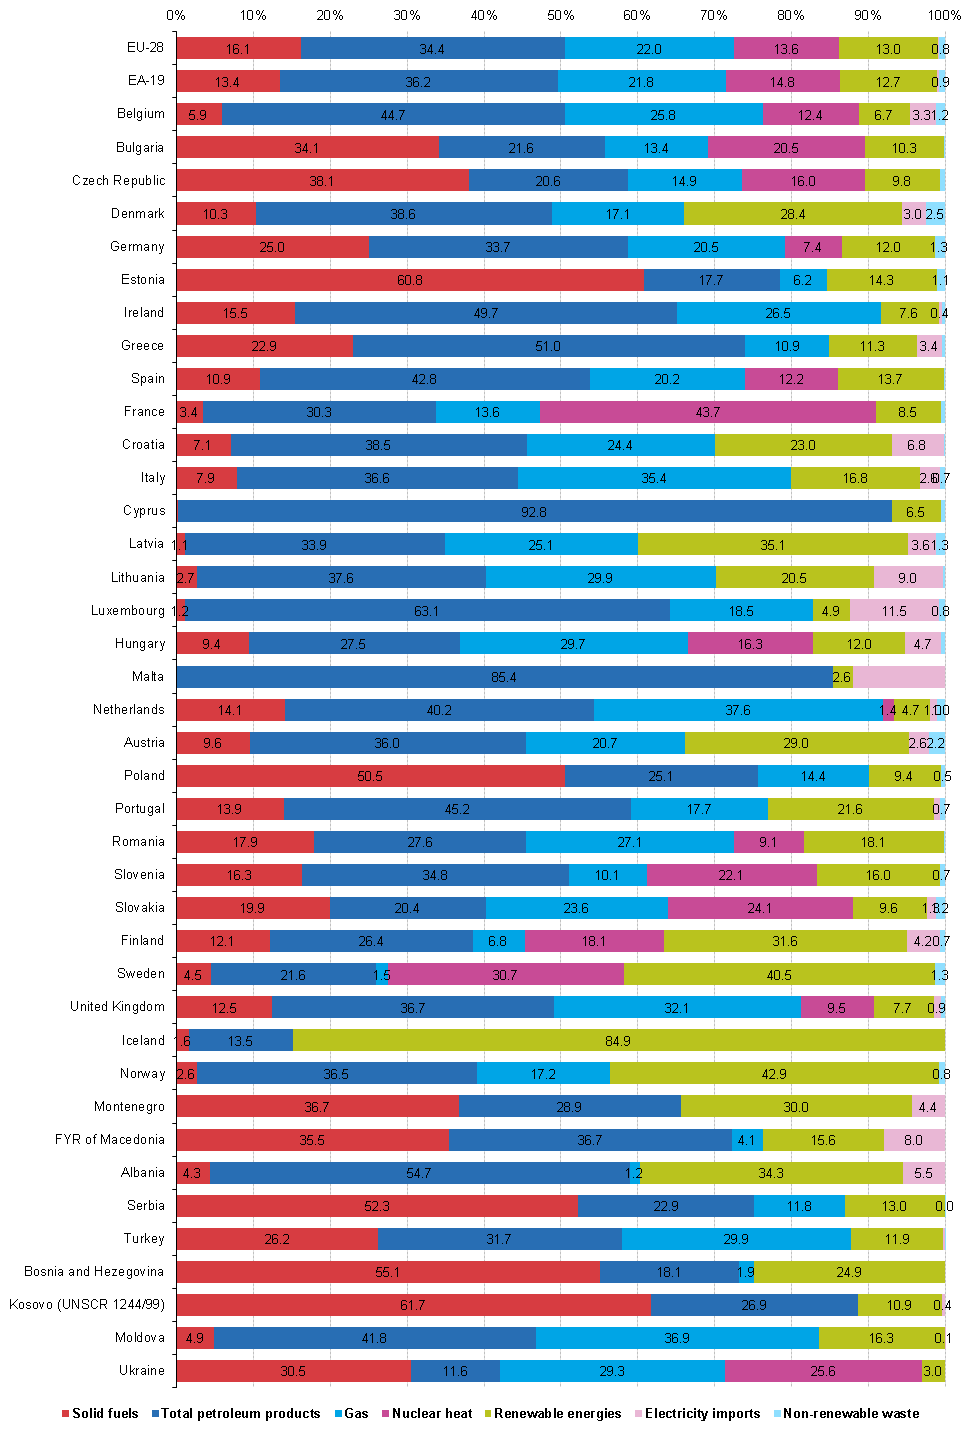
National shares of fuels in gross inland energy consumption, 2015, percentage F6.png
(
file
)
71 KB
1
08:58, 20 June 2017
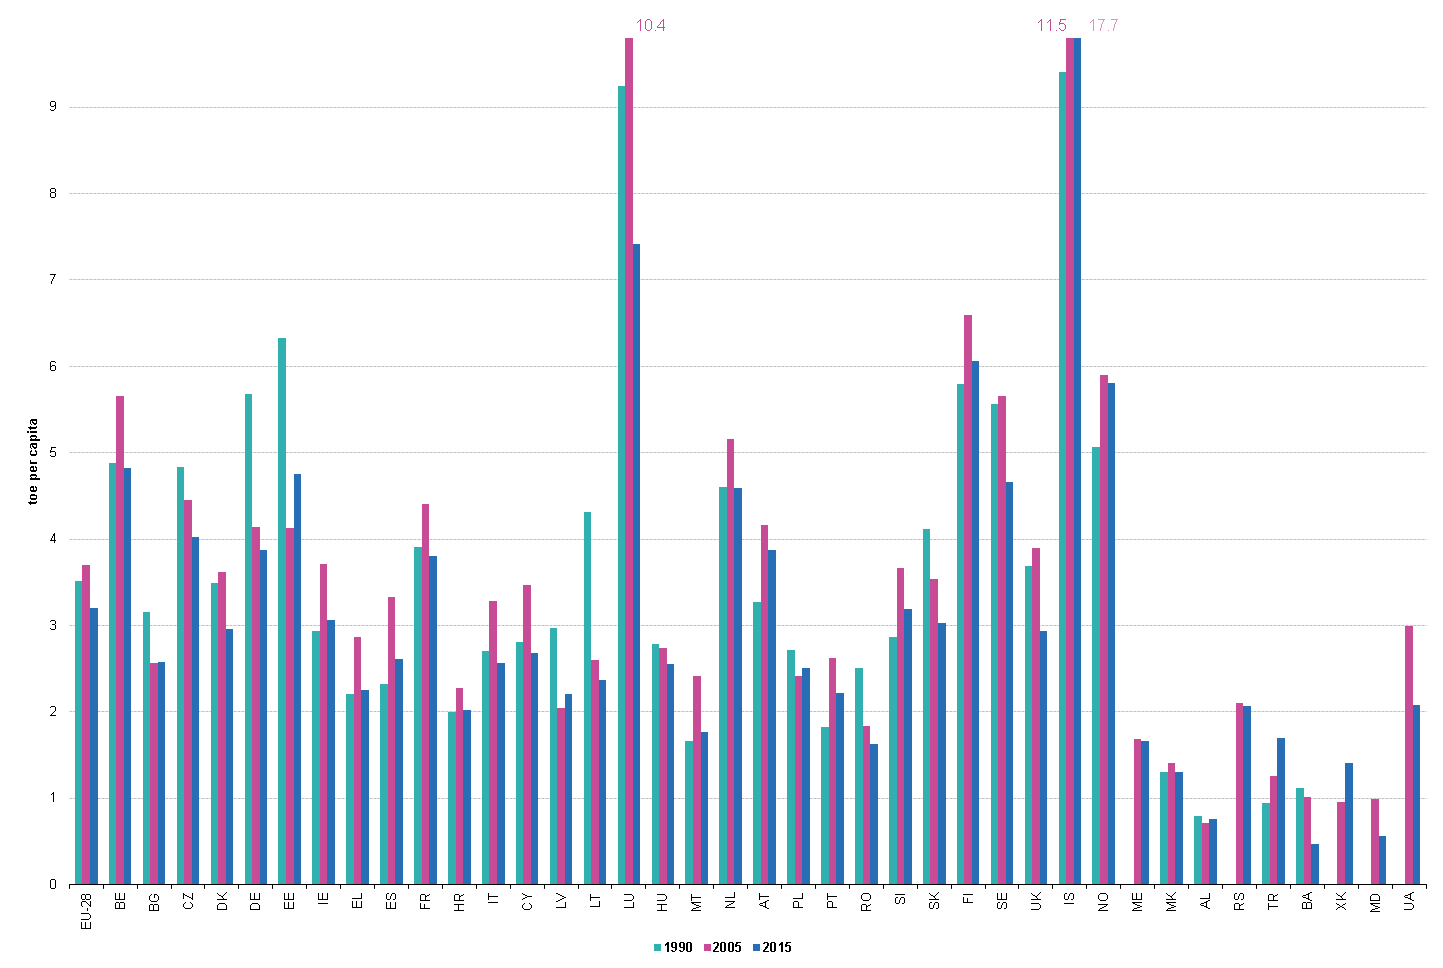
Gross inland energy consumption per capita,1990-2005-2015, toe per capita F7.png
(
file
)
100 KB
1
08:59, 20 June 2017
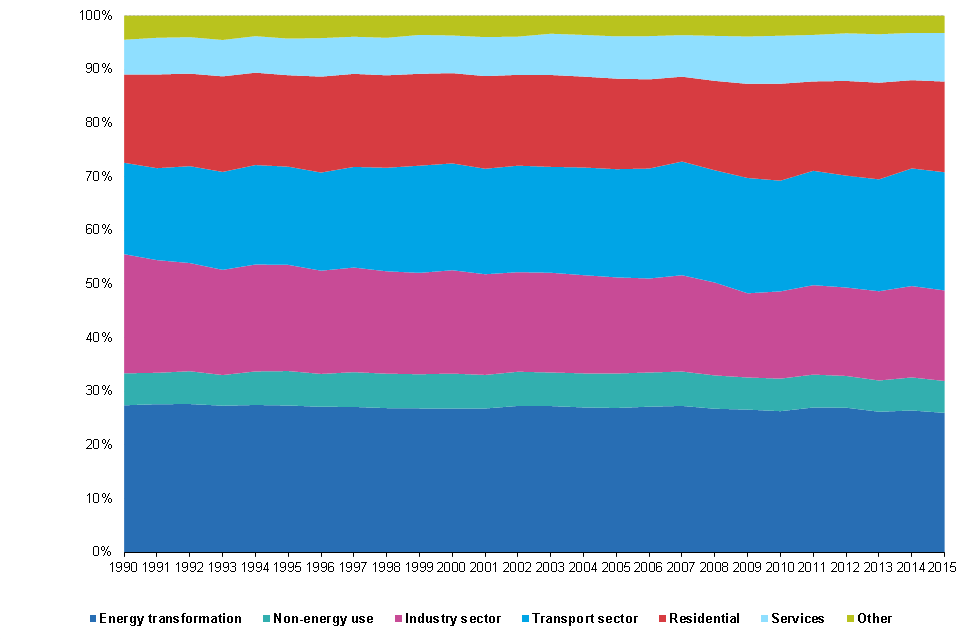
Structural shares of energy use in main categories of energy balances, EU-28, 1990-2015, percentage F8.png
(
file
)
18 KB
1
08:59, 20 June 2017
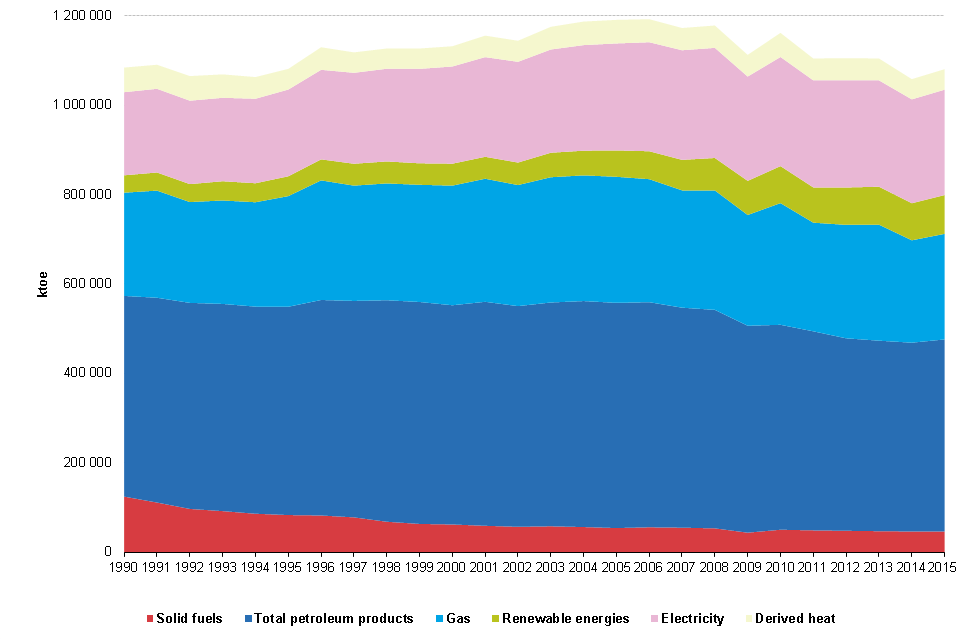
Final energy consumption by fuel, EU-28, 1990-2015, ktoe F9.png
(
file
)
21 KB
1
08:59, 20 June 2017
Final energy consumption by sector, EU-28, 1990-2015, ktoe F10.png
(
file
)
21 KB
1
09:00, 20 June 2017
Non-energy consumption by fuel, EU-28, 1990-2015, ktoe F11.png
(
file
)
16 KB
1
09:00, 20 June 2017
Energy dependency by fuel, EU-28, 1990-1995-2000-2010-2015, ktoe F12.png
(
file
)
32 KB
1
09:02, 20 June 2017
Energy intensity of the economy, 2005-2010-2015, kgoe 1 000 EUR GDP F13.png
(
file
)
72 KB
1
11:02, 20 June 2017
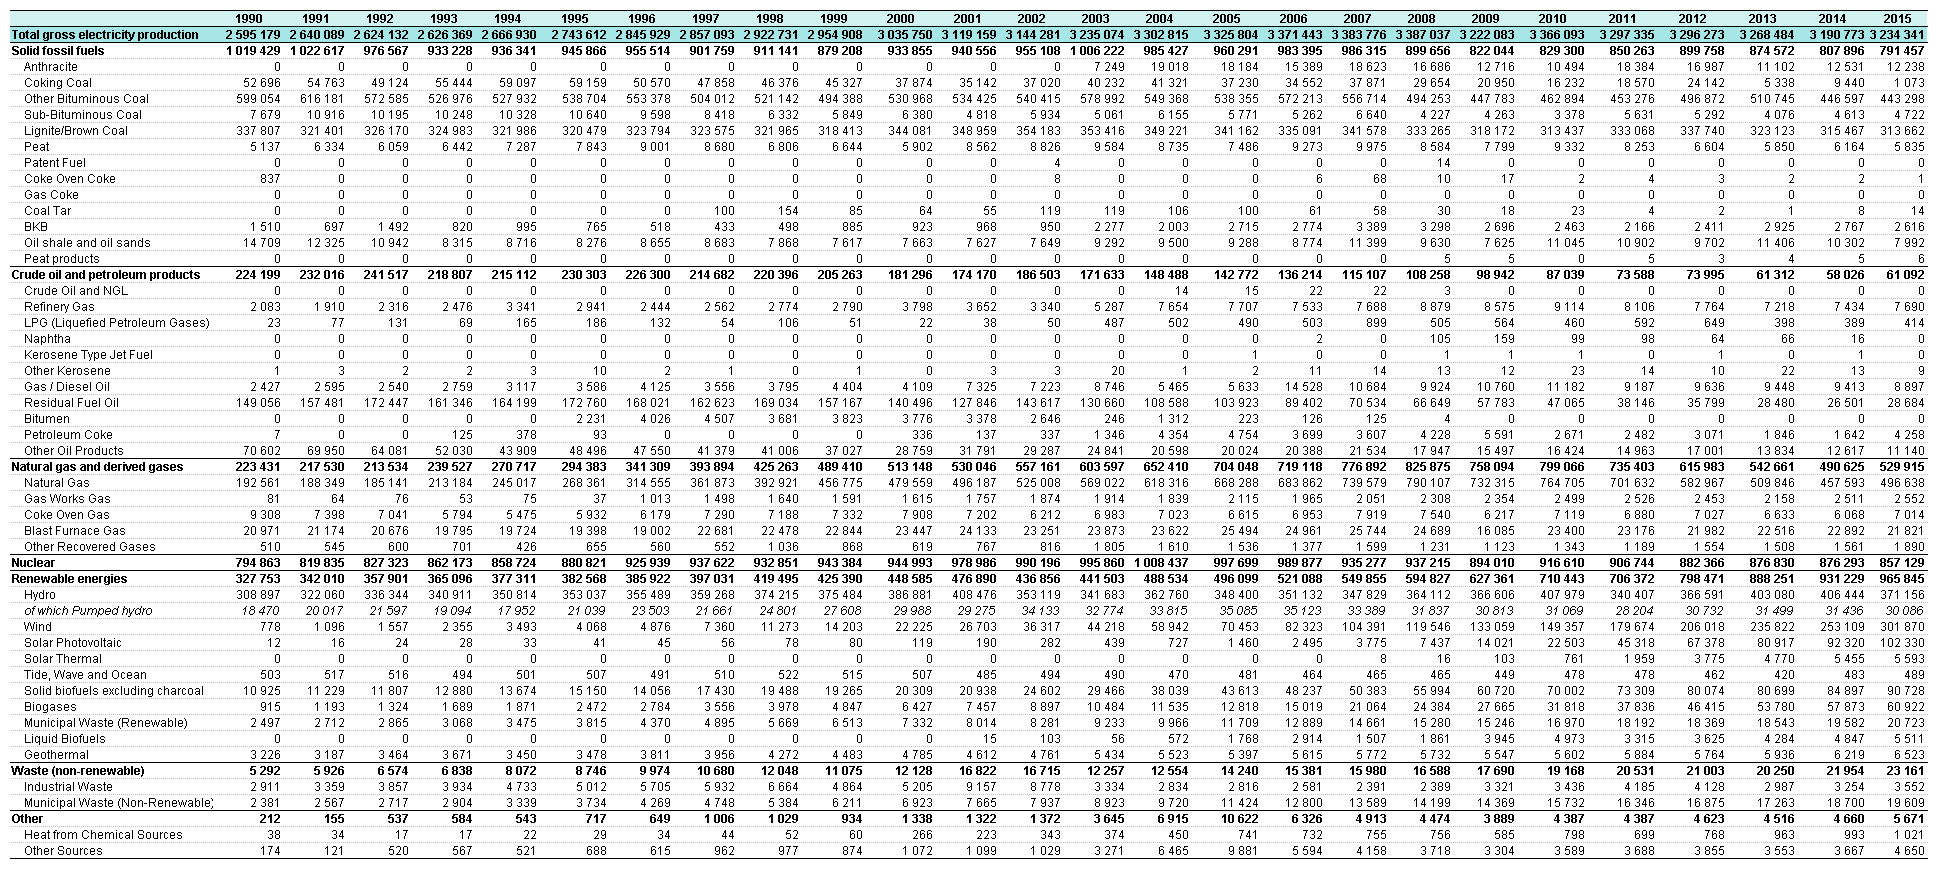
Gross electricity production by fuel, GWh, EU-28, 1990-2014-T1.png
(
file
)
133 KB
1
11:06, 20 June 2017
Gross electricity production by fuel, GWh, EU-28, 1990-2015-T1.png
(
file
)
133 KB
1
11:06, 20 June 2017
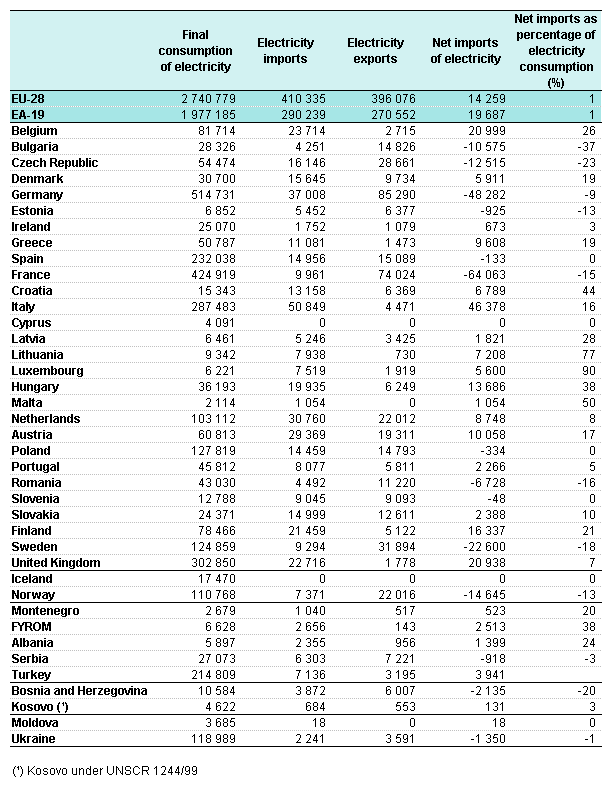
Electricity consumption and trade, 2015 T3.png
(
file
)
31 KB
1
11:07, 20 June 2017
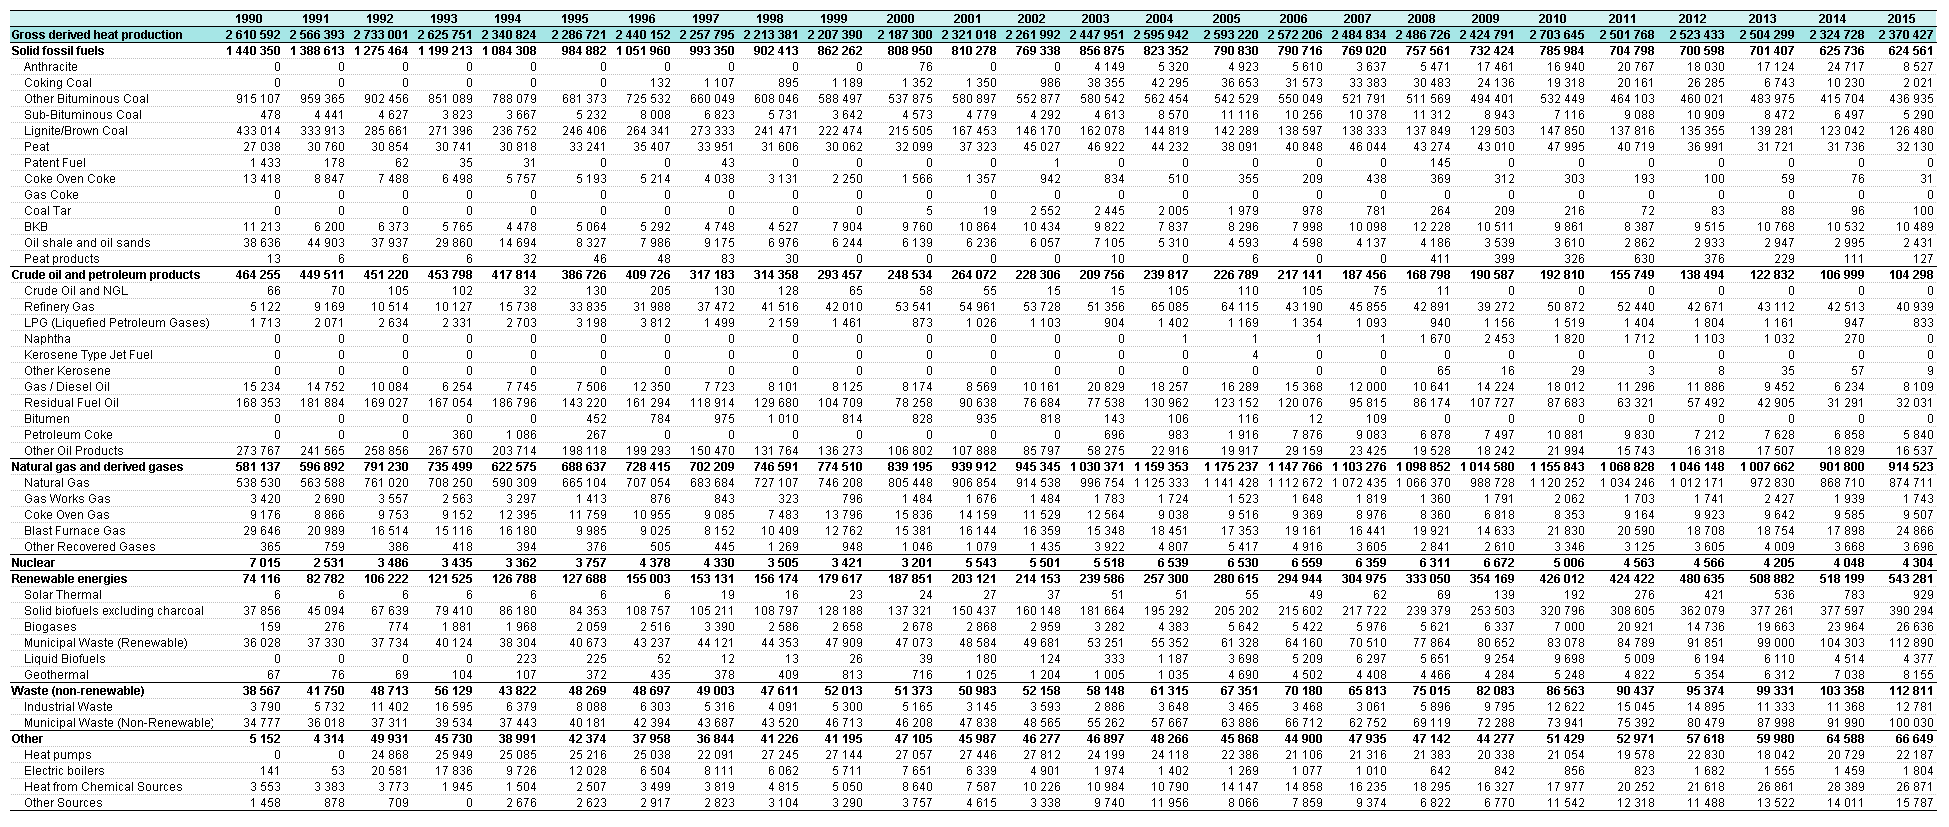
Gross derived heat production by fuel, TJ, EU-28, 1990-2015 T4.png
(
file
)
131 KB
1
11:07, 20 June 2017
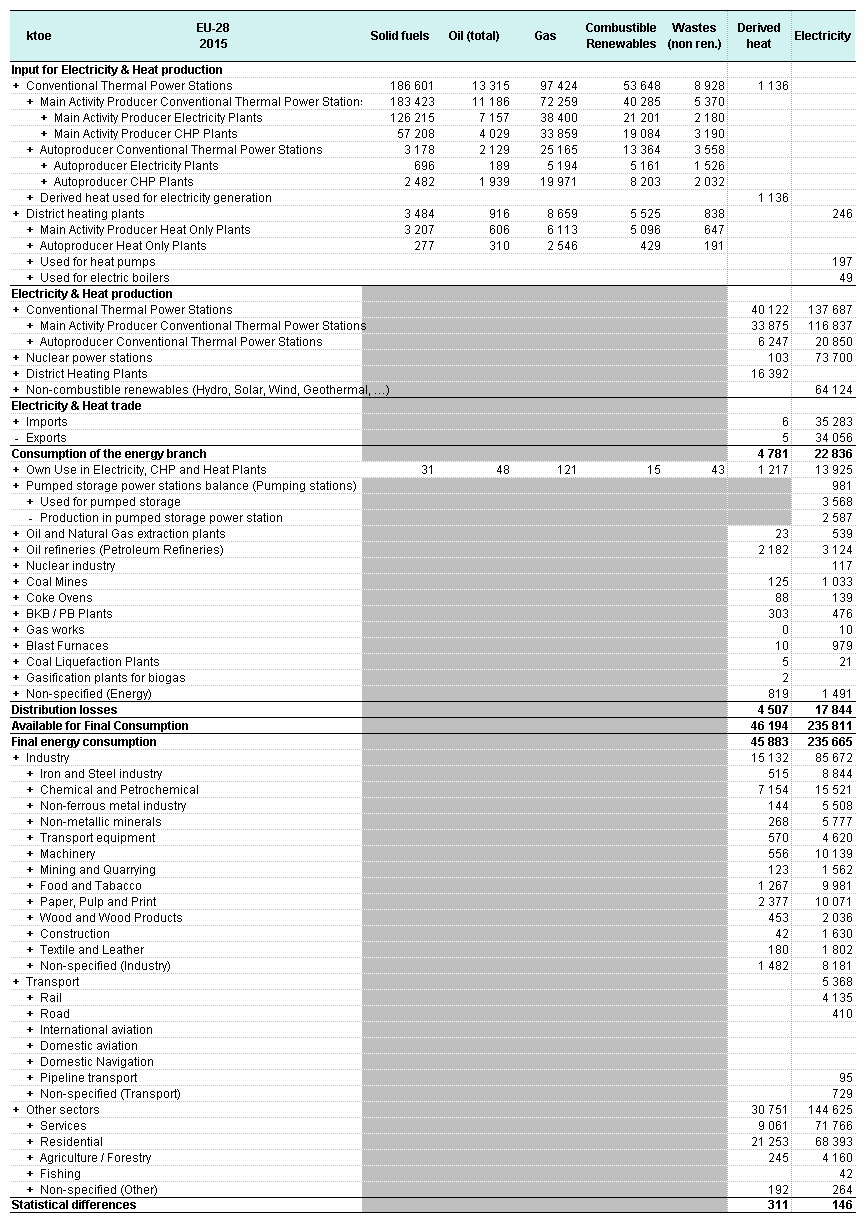
Simplified balance for electricity and derived heat, ktoe, EU-28, 2015 T5.png
(
file
)
60 KB
1
11:08, 20 June 2017
Gross electricity production by fuel, GWh, EU-28, 1990-2015 F1.png
(
file
)
31 KB
1
11:08, 20 June 2017
Gross electricity production by fuel, GWh, EU-28, 1990-2015 F2.png
(
file
)
22 KB
1
11:08, 20 June 2017
Gross derived heat production by fuel, GWh, EU-28, 1990-2015 F3.png
(
file
)
30 KB
1
11:09, 20 June 2017
Gross derived heat production by fuel, GWh, EU-28, 1990-2015 F4.png
(
file
)
27 KB
1
11:09, 20 June 2017
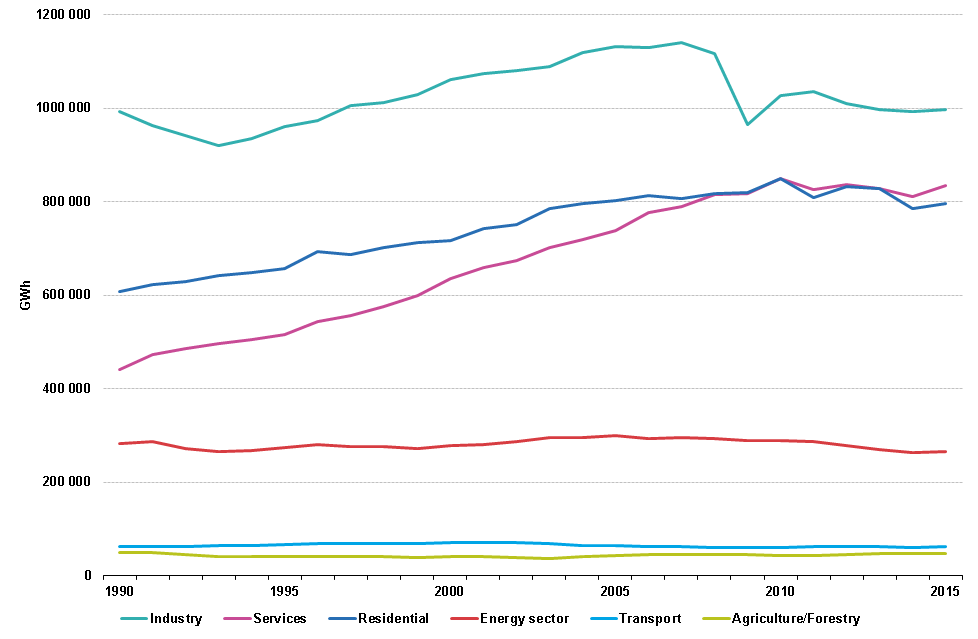
Consumption of electricity by sector, GWh, EU-28, 1990-2015 F5.png
(
file
)
21 KB
1
11:09, 20 June 2017
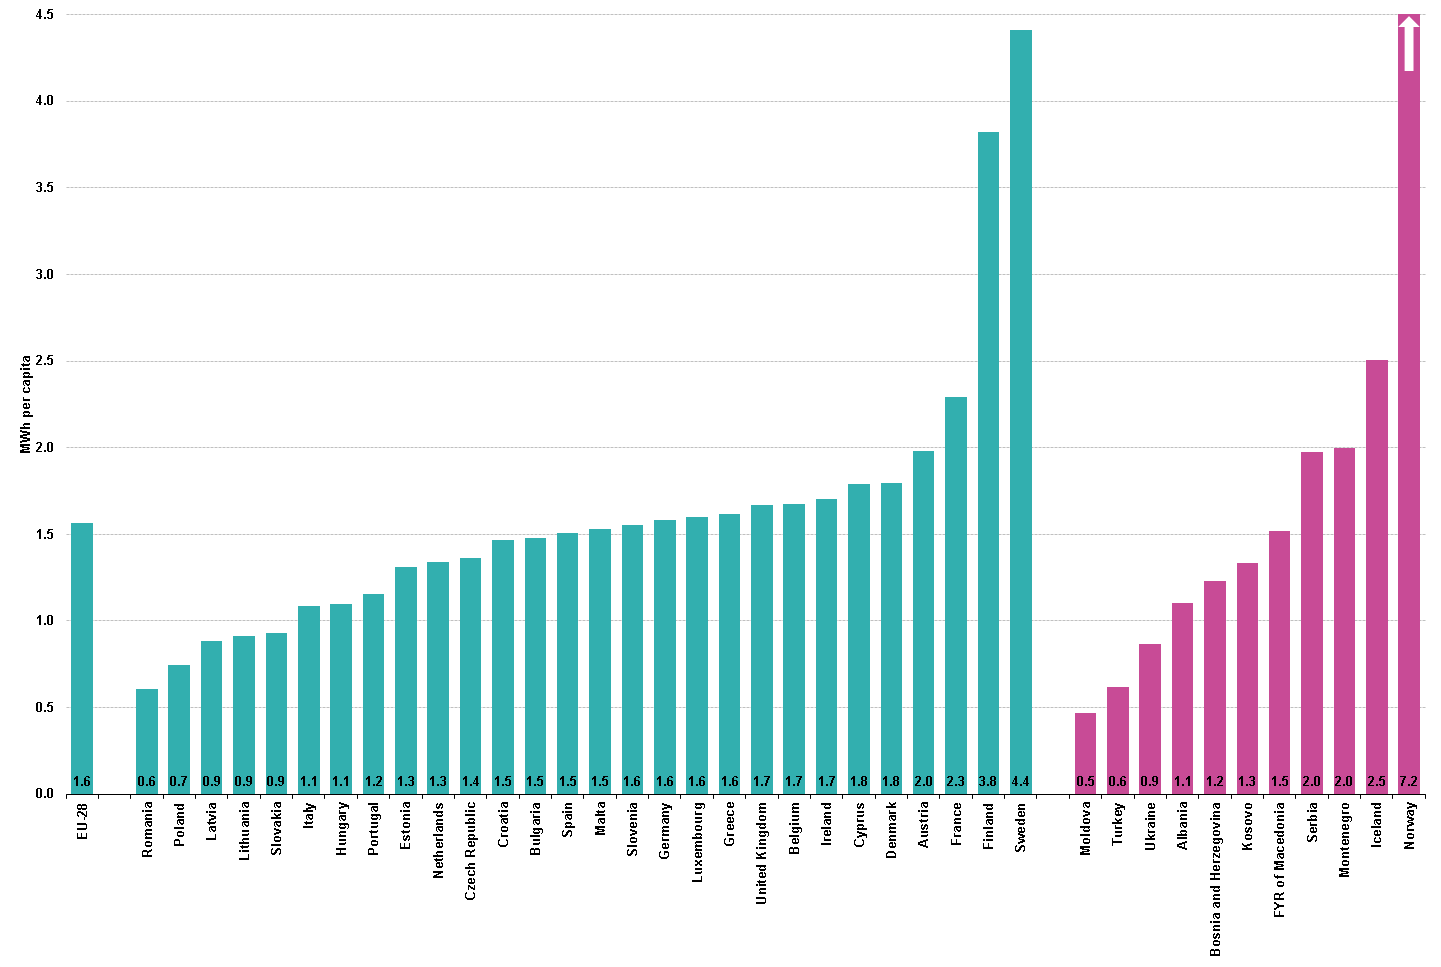
Households consumption of electricity per capita, MWh per capita, 2015 F6.png
(
file
)
60 KB
1
11:10, 20 June 2017
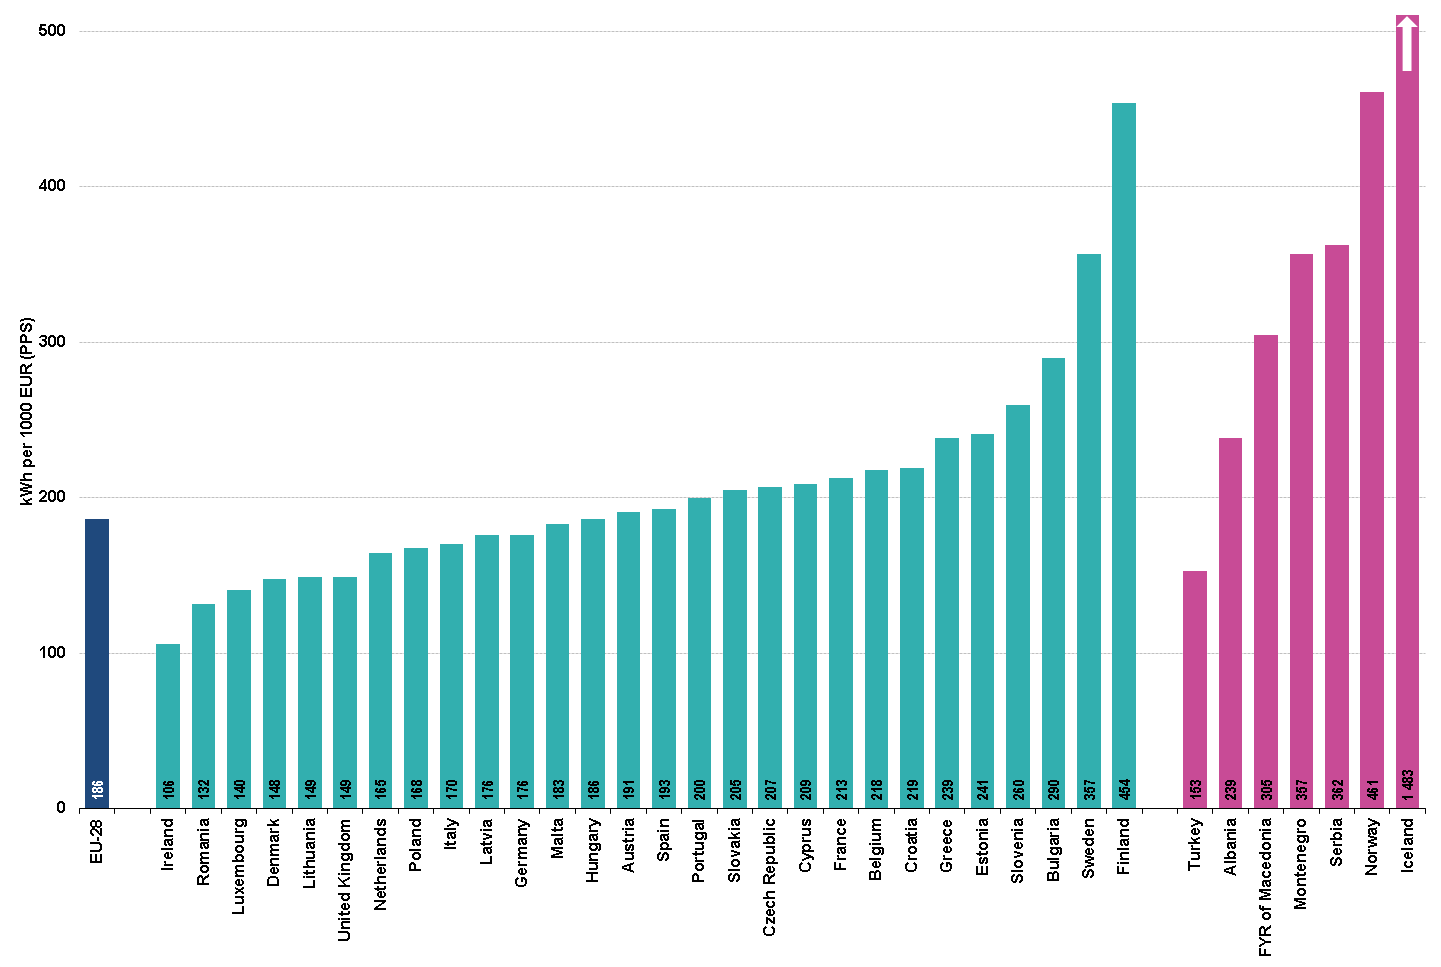
Final consumption of electricity per GDP (PPS), kWh per 1000 EUR (PPS), 2015 F7.png
(
file
)
69 KB
1
13:40, 20 June 2017
Municipal waste treatment, EU-27, (kg per capita) Rev.png
(
file
)
22 KB
1
13:41, 20 June 2017
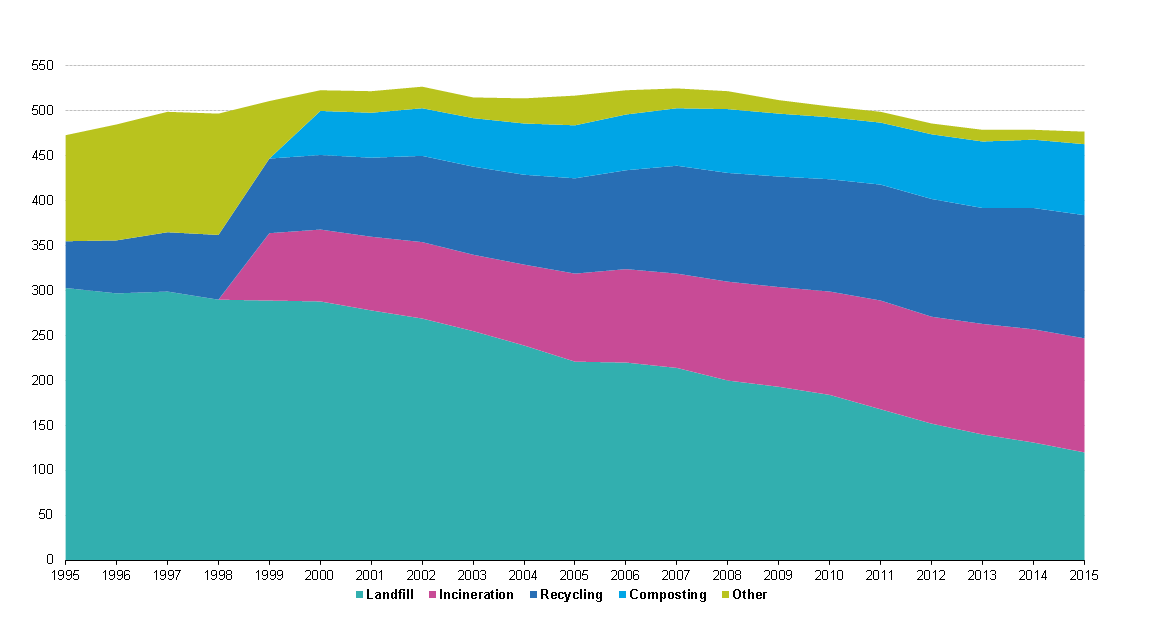
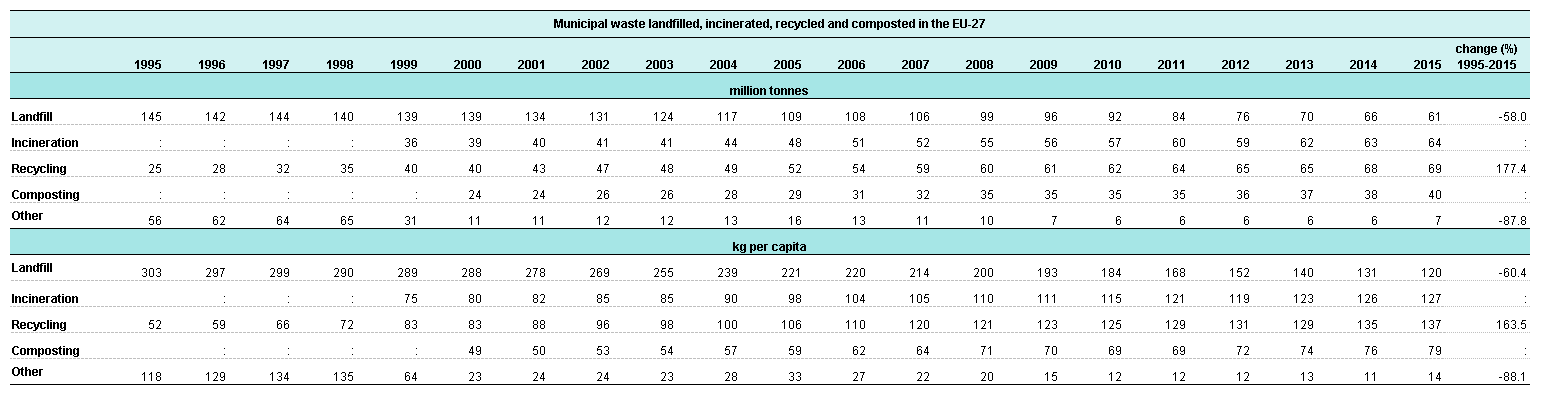
Municipal waste landfilled, incinerated, recycled and composted in the EU-27, 1995 to 2015 Rev.png
(
file
)
19 KB
1
11:01, 15 July 2017
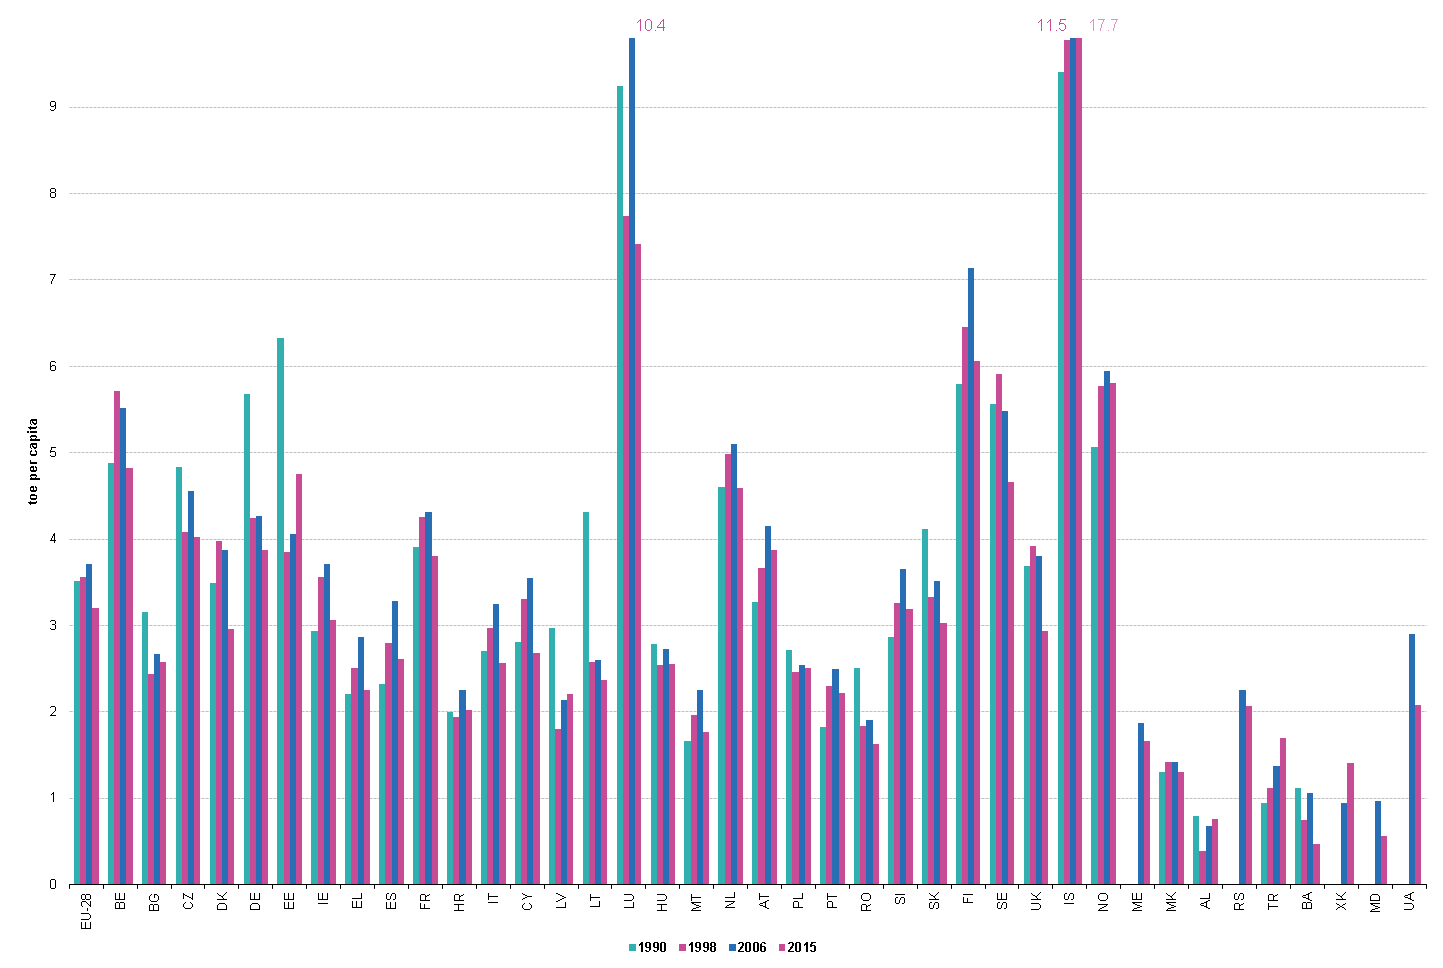
Gross inland energy consumption per capita,1990-1998-2006-2015, toe per capita.png
(
file
)
122 KB
1
09:32, 16 July 2017
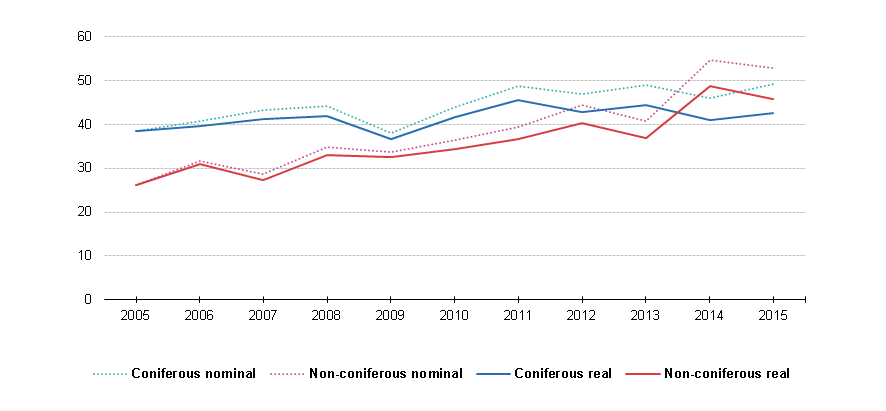
Price of wood in chips or particles sold, EU-28, 2005-2015.png
(
file
)
16 KB
1
08:20, 18 July 2017
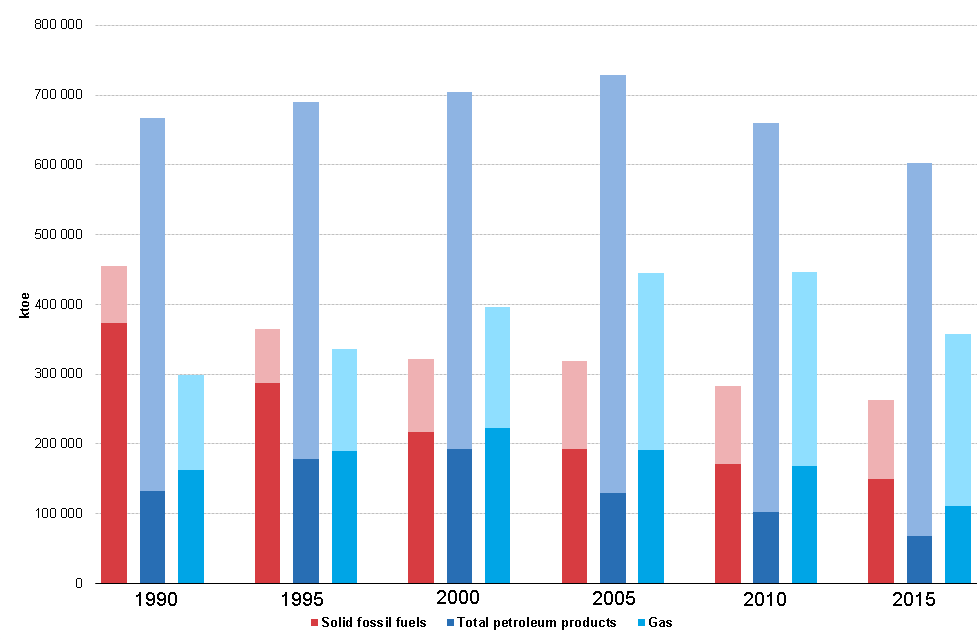
Energy dependency by fuel, EU-28, 1990-1995-2000-2010-2015, ktoe.png
(
file
)
32 KB
1
07:47, 21 July 2017
Packaging waste.xlsx
(
file
)
154 KB
4
07:51, 21 July 2017
Waste statistics.xlsx
(
file
)
160 KB
1
09:18, 24 July 2017
Gross derived heat production by fuel, TJ, EU-28, 1990-2015 F3.png
(
file
)
29 KB
1
09:18, 24 July 2017
Gross derived heat production by fuel, TJ, EU-28, 1990-2015 F4.png
(
file
)
29 KB
1
11:30, 24 July 2017
Map1 Energy consumption per capita, 2015.png
(
file
)
488 KB
1
11:30, 24 July 2017
Map2 Energy consumption per GDP, 2015.png
(
file
)
489 KB
1
12:16, 27 July 2017
Electricity-and-heat-statistics.xlsx
(
file
)
250 KB
4
12:16, 27 July 2017
Maximum electrical capacity, MW, EU-28, 1990-2015 T2.png
(
file
)
38 KB
1
07:25, 10 August 2017
Gross inland consumption of renewable energy, EU-28, 2005 and 2015.png
(
file
)
33 KB
1
08:30, 10 August 2017
Wood imports from China by products, 2000-2015.png
(
file
)
24 KB
1
08:30, 10 August 2017
Wood imports from FLEGT tropical countries by products, 2000-2015.png
(
file
)
28 KB
1
08:31, 10 August 2017
Wood imports from world minus EU-28, China and non-FLEGT tropical countries (combined) by products, 2000-2015.png
(
file
)
34 KB
1
08:32, 10 August 2017
Sawnwood production, 2000-2015.png
(
file
)
40 KB
2
First page
Previous page
Next page
Last page
Special page
ISSN 2443-8219


,_kWh_per_1000_EUR_(PPS),_2015_F7.png)
_Rev.png)


_by_products,_2000-2015.png)
