Tutorials
Log in
Statistics Explained
menu
search
search
Navigation
Main page
Statistical themes
Glossary
Categories
Statistics 4 beginners
Tutorials
Help
Eurostat home
Education corner
Online publications
Regional yearbook
Sustainable development
Full list
Tools
User contributions
Logs
View user groups
Special pages
search
Navigation
Main page
Statistical themes
Glossary
Categories
Statistics 4 beginners
Tutorials
Help
Eurostat home
Education corner
Online publications
Regional yearbook
Sustainable development
Full list
Tools
User contributions
Logs
View user groups
Special pages
Navigation
Main page
Statistical themes
Glossary
Categories
Statistics 4 beginners
Tutorials
Help
Eurostat home
Education corner
Online publications
Regional yearbook
Sustainable development
Full list
Tools
User contributions
Logs
View user groups
Special pages
Uploads by Bleysim
This special page shows all uploaded files.
File list
Items per page:
20
50
100
250
500
Search for media name:
Username:
Include old versions of files
Go
First page
Previous page
Next page
Last page
Date
Name
Thumbnail
Size
Description
Versions
16:29, 26 August 2013
Figure 2 Number of holdings by main type of farming CZ 2010.PNG
(
file
)
28 KB
1
16:32, 26 August 2013
Figure 3 Standard output by main type of farming CZ 2010.PNG
(
file
)
28 KB
1
17:04, 26 August 2013
Figure 2 Number of holdings by main type of farming Netherlands 2010.PNG
(
file
)
25 KB
2
17:05, 26 August 2013
Figure 3 Standard output by main type of farming Netherlands 2010.PNG
(
file
)
21 KB
2
11:03, 28 August 2013
Figure 2 Number of holdings by main type of farming NO 2010.PNG
(
file
)
25 KB
1
11:04, 28 August 2013
Figure 3 Standard output by main type of farming NO 2010.PNG
(
file
)
24 KB
1
11:05, 28 August 2013
Figure 4 Utilised Agricultural Area by land use NO 2000 and 2010.PNG
(
file
)
10 KB
1
11:06, 28 August 2013
Figure 1 Number of holdings and Utilised Agriculture Area (UAA) by UAA size classes NO 2010.PNG
(
file
)
12 KB
1
12:06, 28 August 2013
Table 3 Economic size of the farm by standard output size classes NO 2007 and 2010.PNG
(
file
)
26 KB
Reverted to version as of 15:05, 12 April 2013
1
11:51, 9 September 2013
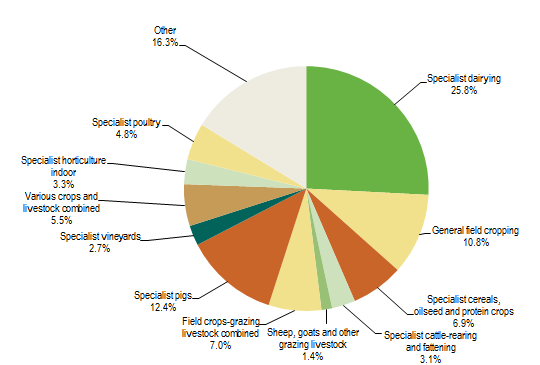
Figure 2 Number of holdings by main type of farming SI 2010.PNG
(
file
)
40 KB
1
11:52, 9 September 2013
Figure 3 Standard output by main type of farming SI 2010.PNG
(
file
)
38 KB
1
12:08, 9 September 2013
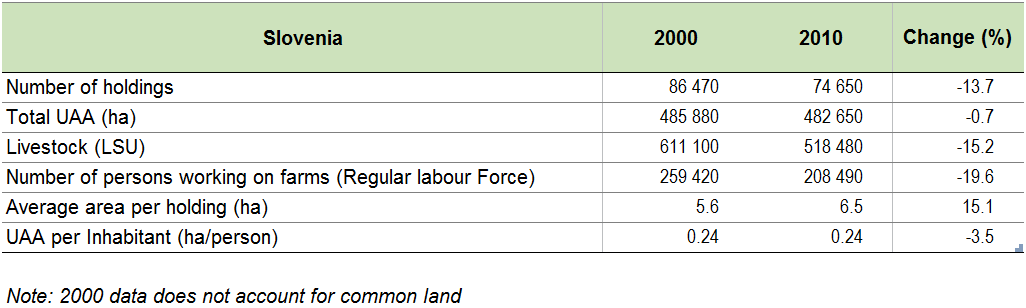
Table1 Farm Structure key indicators SI 2000 2010.PNG
(
file
)
25 KB
1
12:08, 9 September 2013
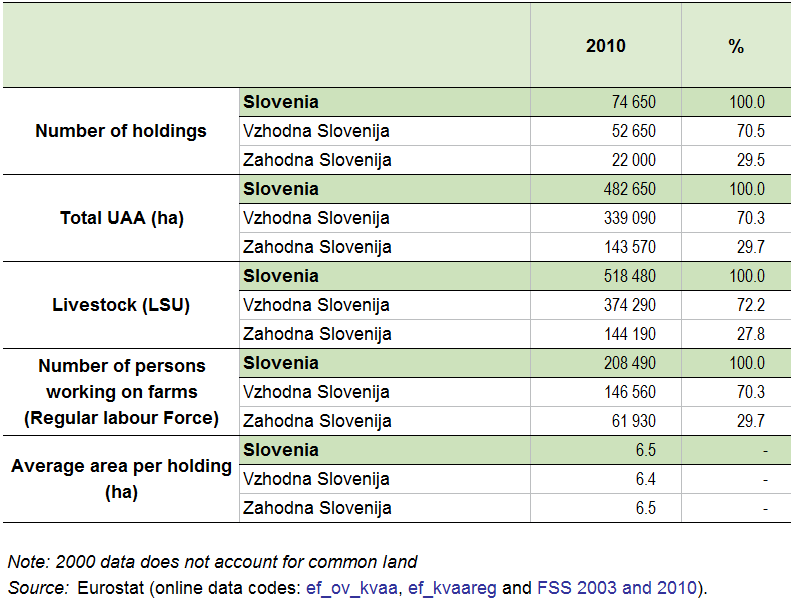
Table 2 Farm structure key indicators by NUTS 2 regions SI 2000 and 2010.PNG
(
file
)
40 KB
1
12:08, 9 September 2013
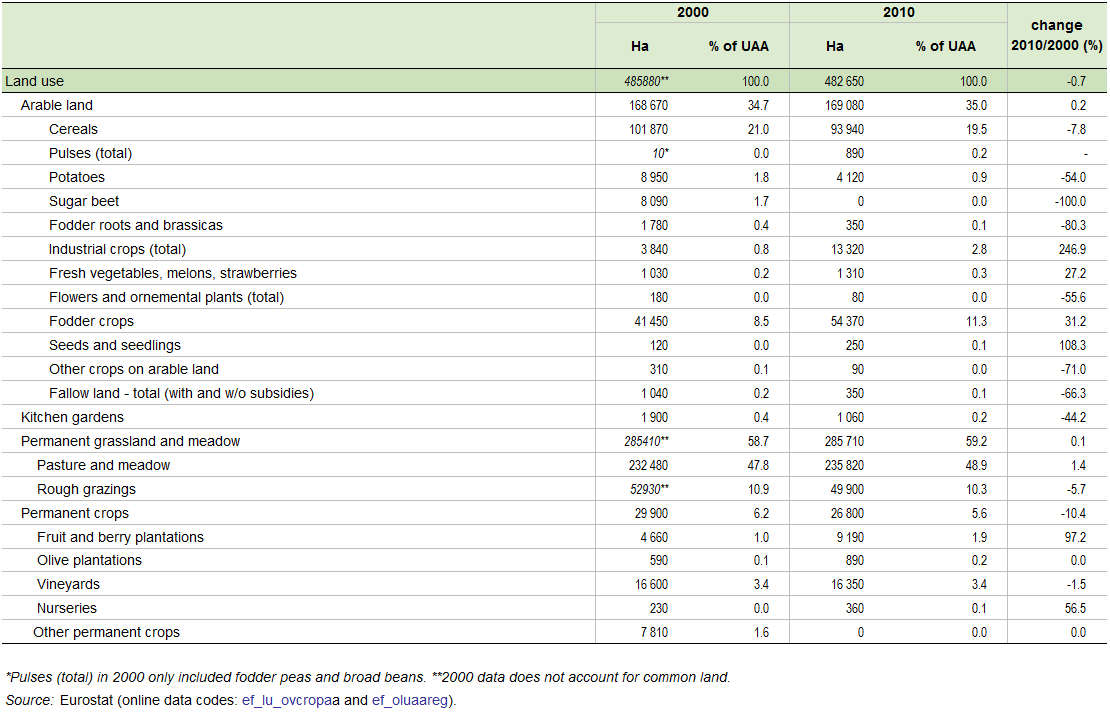
Table 4 Utilised Agricultural Area by land use SI 2000 and 2010.PNG
(
file
)
53 KB
1
13:37, 23 September 2013
Figure Number of holdings by main type of farming DE 2010.PNG
(
file
)
31 KB
1
13:38, 23 September 2013
Figure Standard output by main type of farming DE 2010.PNG
(
file
)
33 KB
1
13:38, 23 September 2013
Figure Livestock by main types DE 2000 and 2010.PNG
(
file
)
8 KB
1
13:39, 23 September 2013
Table Agricultural labour force DE 2000 and 2010.PNG
(
file
)
13 KB
1
11:27, 24 September 2013
DE agricultural census 2010.xls
(
file
)
188 KB
2
11:36, 24 September 2013
Figure 5 Livestock by main types CZ 2000 and 2010.PNG
(
file
)
9 KB
1
11:39, 24 September 2013
Figure 5 Livestock by main types NO 2000 and 2010.PNG
(
file
)
10 KB
1
11:42, 24 September 2013
Figure 5 Livestock by main types SI 2000 and 2010.PNG
(
file
)
11 KB
2
11:47, 24 September 2013
SI agricultural census 2010.xls
(
file
)
286 KB
3
12:04, 24 September 2013
CZ agricultural census 2010.xls
(
file
)
326 KB
3
12:05, 24 September 2013
NO agricultural census 2010.xls
(
file
)
295 KB
3
11:11, 25 September 2013
Figure 5 Livestock by main types Netherlands 2000 and 2010.PNG
(
file
)
11 KB
3
11:13, 25 September 2013
Table 11 Organic farming number of holdings and utilised agricultural area Netherlands 2010.PNG
(
file
)
5 KB
2
11:19, 25 September 2013
NL agricultural census 2010.xls
(
file
)
283 KB
2
13:35, 21 November 2013
Figure Number of holdings by main type of farming AT 2010.PNG
(
file
)
22 KB
3
13:35, 21 November 2013
Figure Standard output by main type of farming AT 2010.PNG
(
file
)
29 KB
2
13:35, 21 November 2013
Figure Livestock by main types AT 2000 and 2010.PNG
(
file
)
9 KB
2
15:55, 21 November 2013
Table Utilised agricultural area by type of tenure by NUTS 2 regions DE 2010.PNG
(
file
)
36 KB
3
15:26, 22 November 2013
Figure Number of holdings by main type of farming FR 2010.PNG
(
file
)
23 KB
2
15:27, 22 November 2013
Figure Standard output by main type of farming FR 2010.PNG
(
file
)
24 KB
2
15:27, 22 November 2013
Figure Livestock by main types FR 2000 and 2010.PNG
(
file
)
9 KB
3
15:29, 22 November 2013
Table Utilised Agricultural Area by land use FR 2000 and 2010.PNG
(
file
)
51 KB
3
16:23, 22 November 2013
Table Organic farming number of holdings and utilised agricultural area AT 2010.PNG
(
file
)
5 KB
2
16:31, 22 November 2013
AT agricultural census 2010.xls
(
file
)
212 KB
3
17:03, 22 November 2013
Figure Number of holdings by main type of farming IE 2010.PNG
(
file
)
19 KB
2
17:04, 22 November 2013
Figure Standard output by main type of farming IE 2010.PNG
(
file
)
18 KB
2
17:04, 22 November 2013
Figure Livestock by main types IE 2000 and 2010.PNG
(
file
)
10 KB
2
17:04, 22 November 2013
Table Utilised agricultural area by type of tenure by NUTS 2 regions IE 2010.PNG
(
file
)
10 KB
2
11:15, 26 November 2013
Table 6 Agricultural labour force CZ 2000 and 2010.PNG
(
file
)
14 KB
2
15:34, 26 November 2013
IE agricultural census 2010.xls
(
file
)
231 KB
2
18:25, 31 January 2014
Figure Number of holdings and Utilised Agriculture Area (UAA) by UAA size classes FR 2010.PNG
(
file
)
14 KB
5
14:35, 10 March 2014
Figure Number of holdings by main type of farming HU 2010.PNG
(
file
)
25 KB
2
14:35, 10 March 2014
Figure Standard output by main type of farming HU 2010.PNG
(
file
)
32 KB
1
14:39, 10 March 2014
Figure Livestock by main types HU 2000 and 2010.PNG
(
file
)
11 KB
3
18:39, 10 March 2014
HU agricultural census 2010.xls
(
file
)
224 KB
2
17:17, 28 June 2021
List of selected cities & component LAUs.xlsx
(
file
)
106 KB
1
First page
Previous page
Next page
Last page
Special page
ISSN 2443-8219


_by_UAA_size_classes_NO_2010.PNG)


_by_UAA_size_classes_FR_2010.PNG)


