Tutorials
Log in
Statistics Explained
menu
search
search
Navigation
Main page
Statistical themes
Glossary
Categories
Statistics 4 beginners
Tutorials
Help
Eurostat home
Education corner
Online publications
Regional yearbook
Sustainable development
Full list
Tools
User contributions
Logs
View user groups
Special pages
search
Navigation
Main page
Statistical themes
Glossary
Categories
Statistics 4 beginners
Tutorials
Help
Eurostat home
Education corner
Online publications
Regional yearbook
Sustainable development
Full list
Tools
User contributions
Logs
View user groups
Special pages
Navigation
Main page
Statistical themes
Glossary
Categories
Statistics 4 beginners
Tutorials
Help
Eurostat home
Education corner
Online publications
Regional yearbook
Sustainable development
Full list
Tools
User contributions
Logs
View user groups
Special pages
Uploads by Agafilu
This special page shows all uploaded files.
File list
Items per page:
20
50
100
250
500
Search for media name:
Username:
Include old versions of files
Go
First page
Previous page
Next page
Last page
Date
Name
Thumbnail
Size
Description
Versions
17:41, 24 November 2014
Temporary employees, by country and disability definition, 2011 (in %).png
(
file
)
28 KB
1
17:54, 24 November 2014
Tab1 People at-risk-of-poverty, 2011.png
(
file
)
45 KB
1
17:57, 24 November 2014
At-risk-of-poverty rate (%) for the population aged 16 or more with activity limitation, before and after social transfers, by country, 2011.png
(
file
)
69 KB
1
12:51, 28 November 2014
People at-risk-of-poverty, severely materially deprived.png
(
file
)
41 KB
1
15:40, 28 November 2014
Unemployment rate of persons aged 15-64, by country and disability definition, 2011 (in %) .png
(
file
)
24 KB
1
16:28, 1 December 2014
Fig3 employed risk poverty, 2011.png
(
file
)
37 KB
1
16:34, 1 December 2014
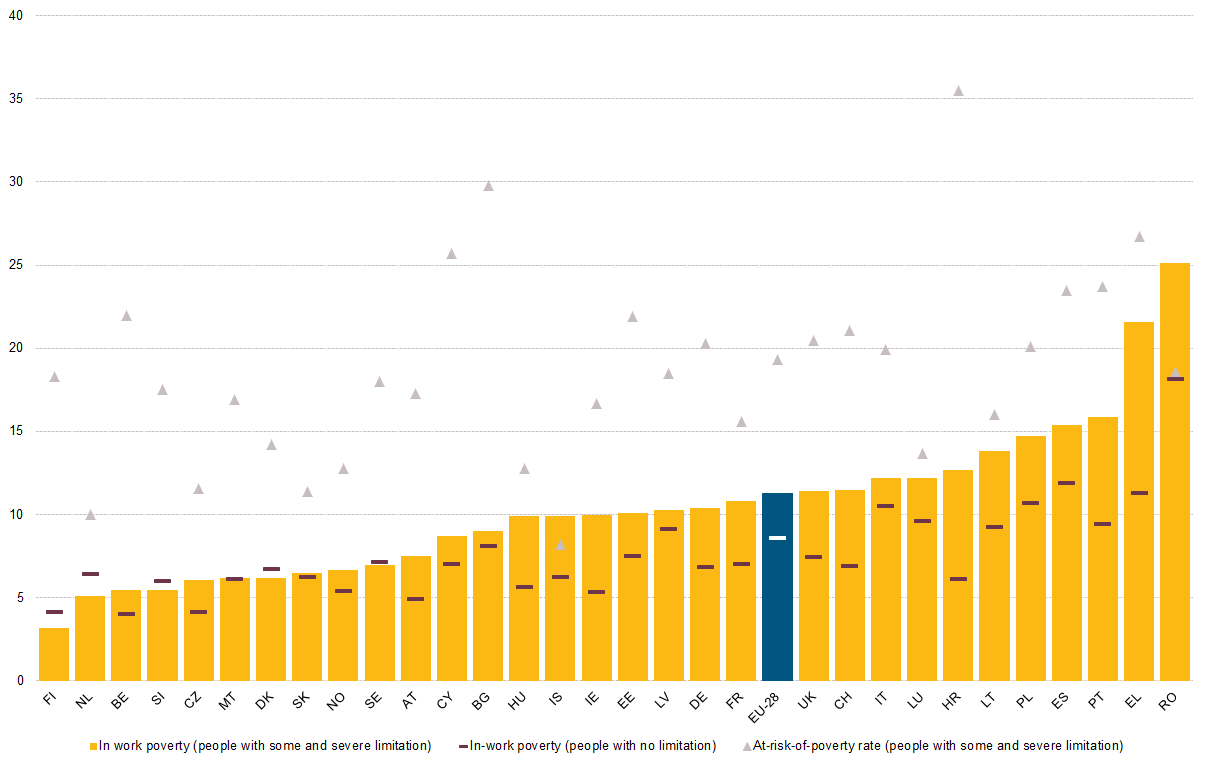
Percentage of the employed population aged 16 or more who are at-risk-of-poverty, by country and level of activity limitation, 2011.png
(
file
)
37 KB
1
11:04, 8 May 2015
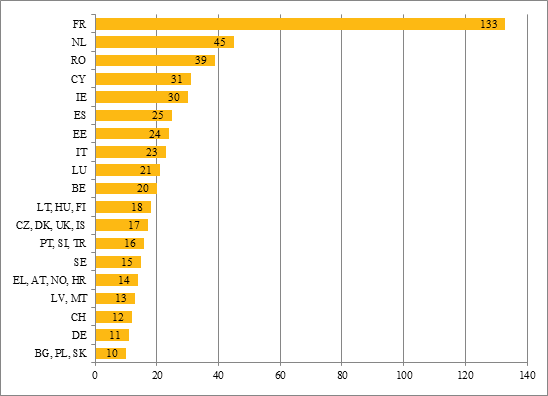
FIG1 2011 LFS AHM nb questions by country.png
(
file
)
14 KB
1
14:05, 21 May 2015
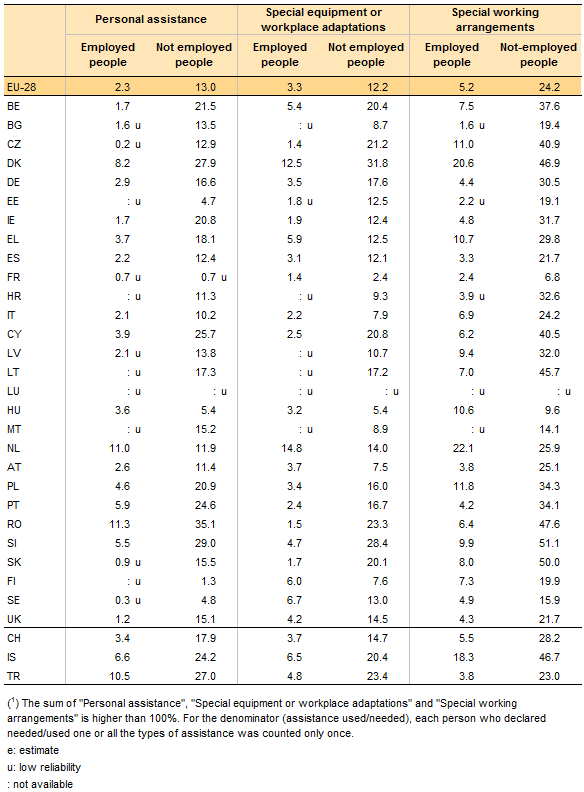
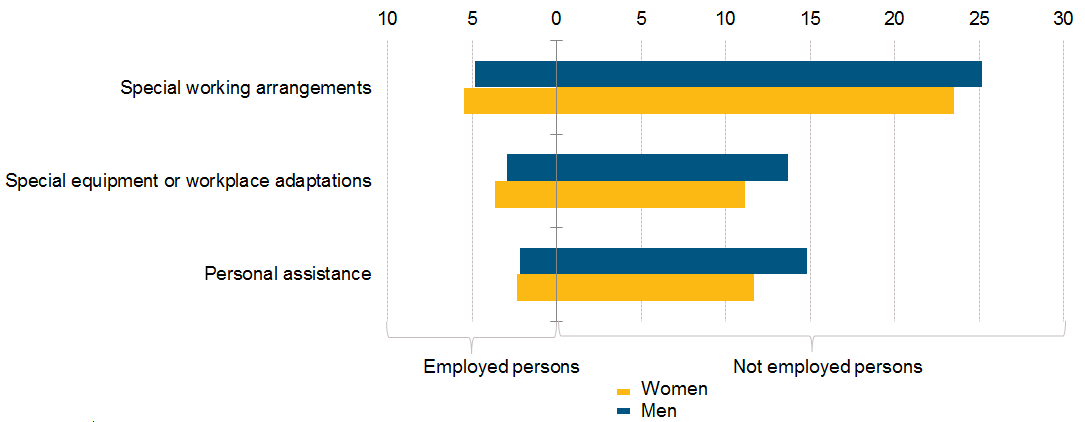
Breakdown of the different types of assistance used or needed at work by employed people and people not in work.png
(
file
)
23 KB
Breakdown of the different types of assistance used or needed at work by employed people and people not in work aged 15-64 who had a longstanding health problem or a basic activity difficulty
1
15:15, 21 May 2015
Types of assistance used by employed people or needed by people not in work who had a longstanding health problem or a basic activity difficulty.png
(
file
)
11 KB
1
17:41, 21 May 2015
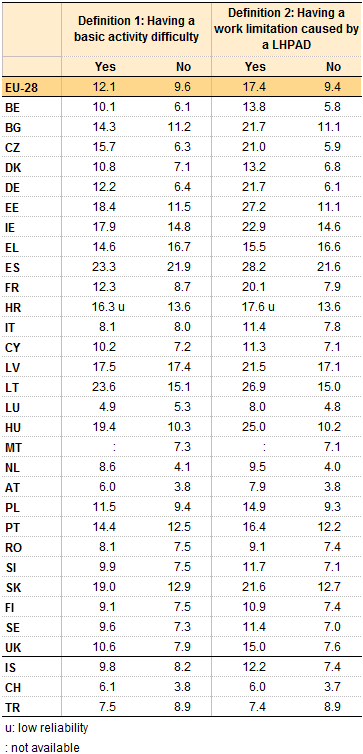
People aged 15-64 broken down by whether or not they are restricted in the work they do and by the reason for that limitation.png
(
file
)
17 KB
1
14:07, 15 June 2015
Breakdown of the different types of assistance used or needed at work by employed people and people not in work aged 15-64 who had a longstanding health problem or a basic activity difficulty, 2011 (%).png
(
file
)
21 KB
1
18:00, 24 July 2015
Fig2 Deprived of some housing items LIMACT.png
(
file
)
43 KB
1
11:31, 27 August 2015
Table 1 People at-risk-of-poverty severely materially deprived 2013.png
(
file
)
28 KB
1
10:37, 16 September 2015
Table 1 People at-risk-of-poverty, severely materially deprived 2013.png
(
file
)
34 KB
2
10:42, 16 September 2015
Fig2 At-risk-of-poverty rate (%) for the population aged 16 or more with activity limitation, before and after social transfers, by country, 2013.png
(
file
)
22 KB
2
10:45, 16 September 2015
Fig3 Percentage of the employed population aged 16 or more who are at-risk-of-poverty, by country and level of activity limitation, 2013.png
(
file
)
16 KB
2
15:01, 16 September 2015
Arrears by country and level of activity limitation 2013.png
(
file
)
20 KB
2
15:12, 17 September 2015
Fig1 struggling to make ends meet 2013.png
(
file
)
14 KB
6
15:16, 17 September 2015
Fig2 unable to afford one week annual holiday 2013.png
(
file
)
14 KB
3
15:19, 17 September 2015
Fig3 unable to afford eat meat 2013.png
(
file
)
13 KB
2
15:23, 17 September 2015
Fig4 unable to meet unexpected financial expenses 2013.png
(
file
)
15 KB
2
16:40, 17 September 2015
Fig1Owner-occupied dwelling LIMACT.png
(
file
)
17 KB
2
16:54, 17 September 2015
Fig3 Overcrowding rate LIMACT.png
(
file
)
11 KB
2
16:58, 17 September 2015
Fig4 Overcrowding rate elderly LIMACT.png
(
file
)
12 KB
2
16:59, 17 September 2015
Fig5 Housing cost overburden rate LIMACT.png
(
file
)
15 KB
2
17:32, 5 April 2016
Distribution of persons aged 16 and over by self-perceived health status, 2014 (%) Health2015.png
(
file
)
45 KB
1
16:29, 9 October 2018
Share of persons aged 15 and over having a heavy episodic drinking at least once a month, by sex and income quintile, 2014 or nearest year (%) HLTH2018.png
(
file
)
63 KB
2
16:35, 9 October 2018
Alcohol consumption statistics 2018.xlsx
(
file
)
49 KB
1
10:38, 10 October 2018
Distribution of persons aged 15 and over according to the number of portions of fruit and vegetables consumed per day, 2014 or nearest year (%).png
(
file
)
40 KB
2
14:31, 16 October 2018
Distribution of persons aged 15 and over who consumes at least five portions of fruit and vegetables per day, by level of educational attainment, 2014 or nearest year (%).png
(
file
)
34 KB
2
14:34, 16 October 2018
Distribution of persons aged 15 and over who consumes at least five portions of fruit and vegetables per day, by income quintile, 2014 or nearest year (%).png
(
file
)
33 KB
2
14:36, 16 October 2018
Distribution of persons aged 15 and over according to the frequency of consumption of fruit, 2014 or nearest year (%).png
(
file
)
42 KB
2
14:38, 16 October 2018
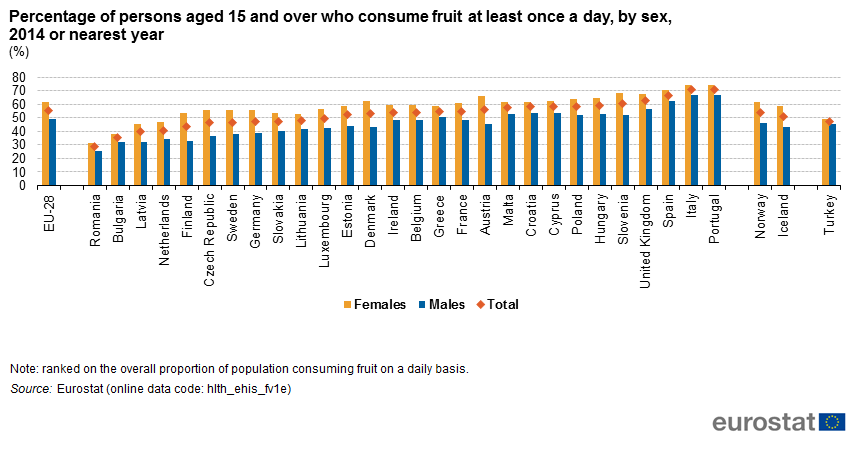
Percentage of persons aged 15 and over who consumes fruits at least once a day, by sex, 2014 or nearest year (%).png
(
file
)
35 KB
2
14:44, 16 October 2018
Percentage of persons aged 15 and over who consumes fruits at least once a day, by level of educational attainment, 2014 or nearest year (%).png
(
file
)
35 KB
2
14:46, 16 October 2018
Distribution of persons aged 15 and over according to the frequency of consumption of vegetables, 2014 or nearest year (%).png
(
file
)
40 KB
2
14:50, 16 October 2018
Percentage of persons aged 15 and over who consumes vegetables at least once a day, by sex, 2014 or nearest year (%).png
(
file
)
36 KB
3
14:55, 16 October 2018
Percentage of persons aged 15 and over who consumes vegetables at least once a day, by level of educational attainment, 2014 or nearest year (%).png
(
file
)
35 KB
2
15:04, 16 October 2018
Fruit Vegetable consumption Y2018-update.xlsx
(
file
)
107 KB
1
17:14, 16 October 2018
Share of persons aged 18 and over performing health-enhancing aerobic and muscle-strengthening physical activities in a typical week, by sex, 2014 or nearest year (%).png
(
file
)
36 KB
2
17:17, 16 October 2018
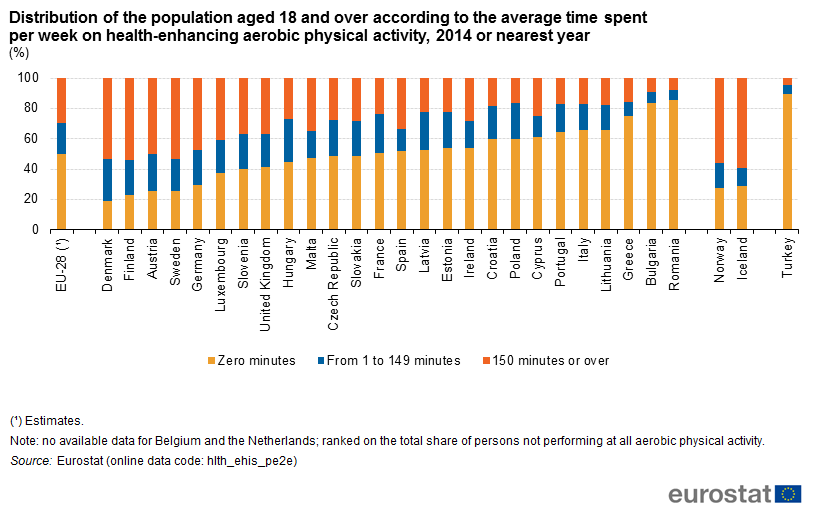
Distribution of the population aged 18 and over according to the average time spent per week on health-enhancing aerobic physical activity, 2014 or nearest year (%).png
(
file
)
40 KB
2
17:30, 16 October 2018
Share of persons aged 15 and over performing non-work-related physical activities at least once a week, by kind of activity, 2014 or nearest year (%).png
(
file
)
43 KB
2
17:35, 16 October 2018
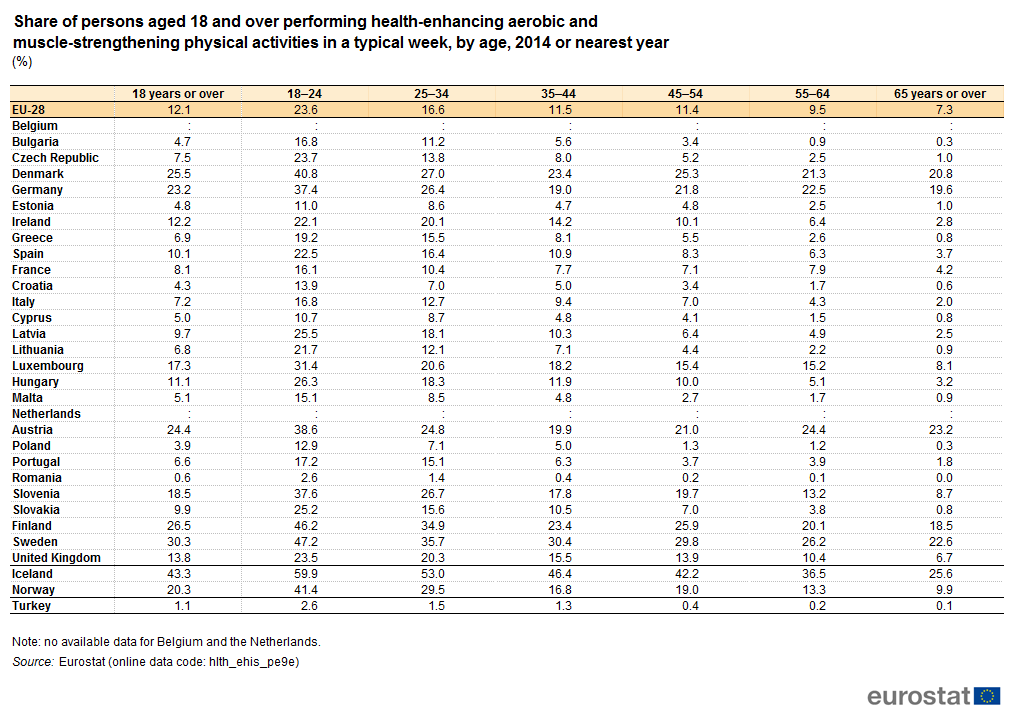
Share of persons aged 18 and over performing health-enhancing aerobic and muscle-strengthening physical activities in a typical week, by age, 2014 or nearest year (%).png
(
file
)
49 KB
2
10:44, 17 October 2018
Share of persons aged 18 and over performing at least 150 minutes of health-enhancing aerobic physical activity per week, by level of educational attainment, 2014 or nearest year (%).png
(
file
)
36 KB
2
10:46, 17 October 2018
Share of persons aged 18 and over performing at least 150 minutes of health-enhancing aerobic physical activity per week, by income quintile, 2014 or nearest year (%).png
(
file
)
35 KB
2
10:48, 17 October 2018
Physical activity statistics Y2018-update.xlsx
(
file
)
59 KB
1
11:34, 25 February 2021
Disability Statistics - Housing Conditions 2019 data v2.xlsx
(
file
)
69 KB
1
16:28, 1 June 2022
Healthy life years in absolute value at birth - females (2010-2020).png
(
file
)
119 KB
1
16:29, 1 June 2022
Healthy life years in absolute value at birth - males (2010-2020).png
(
file
)
103 KB
1
16:30, 1 June 2022
Healthy life years in absolute value at 65 - females (2010-2020).png
(
file
)
102 KB
1
First page
Previous page
Next page
Last page
Special page
ISSN 2443-8219
.png)

_for_the_population_aged_16_or_more_with_activity_limitation,_before_and_after_social_transfers,_by_country,_2011.png)

_.png)


.png)


_for_the_population_aged_16_or_more_with_activity_limitation,_before_and_after_social_transfers,_by_country,_2013.png)


_Health2015.png)
_HLTH2018.png)
.png)
.png)
.png)
.png)
.png)
.png)
.png)
.png)
.png)
.png)
.png)
.png)
.png)
.png)
.png)
.png)
.png)
.png)