Data extracted in June 2024.
Planned article update: August 2025.
Highlights
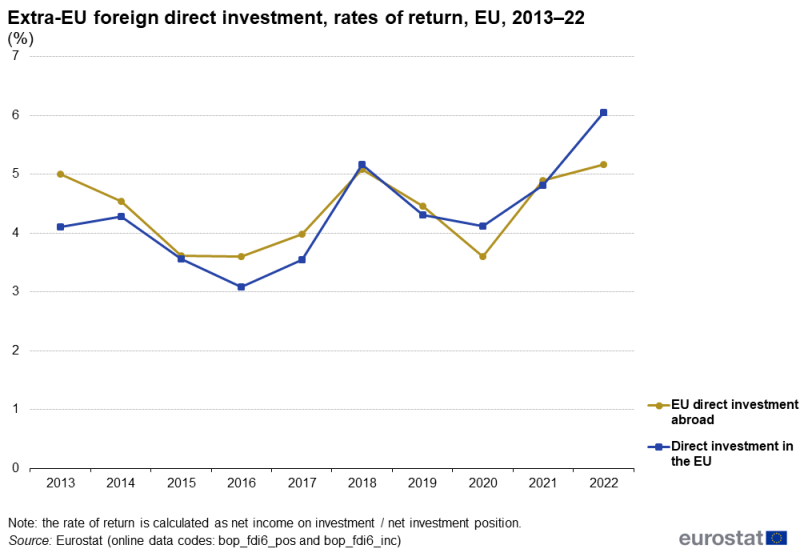
The rate of return on EU direct investment abroad fell strongly between 2013 and 2015, was stable in 2016, rose to a peak of 5.1% in 2018, fell back to 3.6% by 2020 and had increased to 5.2% by 2022.
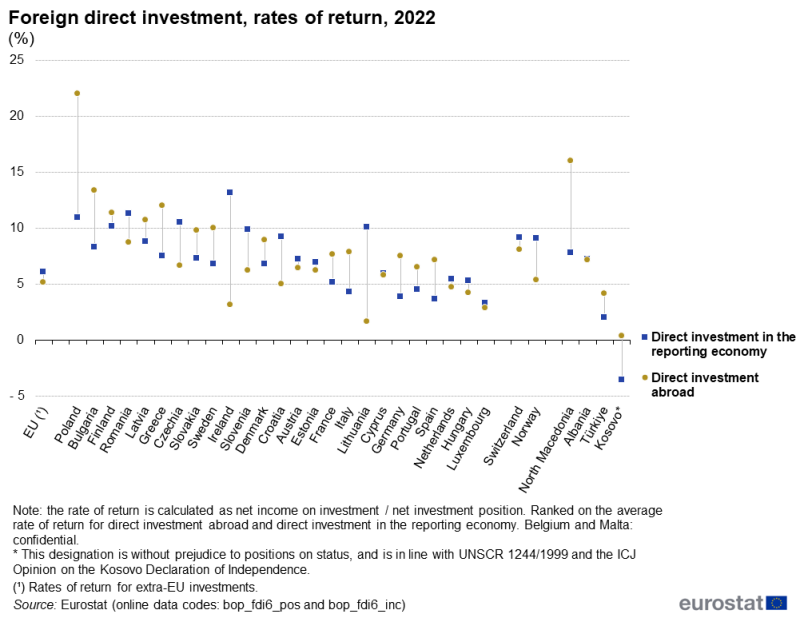
In 2022, the highest rate of return for investments abroad was for FDI from Poland (22.0%), while the highest rate for investments in EU countries was observed in Ireland (13.1%).

(%)
Source: Eurostat (bop_fdi6_pos) and (bop_fdi6_inc)
Globalisation patterns in EU trade and investment is an online Eurostat publication presenting a summary of recent European Union (EU) statistics on economic aspects of globalisation, focusing on patterns of EU trade and investment.
This article analyses the returns that investors obtain from foreign direct investment (FDI).
As with all enterprises, economic theory suggests that enterprises which invest abroad will seek to maximise their profits. However, if they are based in more than 1 country then multinational enterprises have a degree of flexibility that may allow them to adapt their global strategy to reflect the economic conditions in different markets. Their behaviour is further complicated by an opportunity to engage in complex financial flows and transfers between different cost centres (often designed to lower their exposure to, among other things, corporate taxation).
The 3 analyses presented in this article – overall developments, an analysis by activity and an analysis by EU country – are based on the latest data available: for the overall analysis, the most recent reference period is 2022; for the analysis by EU country, the most recent reference period is also 2022; for the analysis by activity, the latest reference period is 2021. Rates of return on FDI may differ considerably between 2021 and 2022, due in part to the developments during the COVID-19 pandemic and the Russian military aggression against Ukraine.
Note, the overall analysis is for the EU’s FDI relations with non-EU countries (also referred to as extra-EU FDI). The analysis by activity and for each EU country includes not only extra-EU FDI but also the FDI between EU countries (also referred to as intra-EU FDI).
General overview
The rate of return on EU direct investment abroad rose in 2022
Changes over time in rates of return reflect changes in the level of the stock of FDI and in the related investment income. The level of net income received from non-EU countries on outward stocks of FDI increased in 2022 to €484.6 billion, up 4.1% compared with the year before. As the stock of outward positions fell by 1.4% in the same year, the rate of return on EU investment abroad increased, up from 4.9% in 2021 to 5.2% in 2022. The rate of return on the EU’s direct investment abroad in 2022 was higher than in any other year during the period shown in Figure 1.
Net income paid to non-EU countries on their FDI positions in the EU increased to €466.6 billion in 2022. Compared with 2021, this income grew (up 23.7%) while the stock of inward FDI fell (down 1.5%) and as a consequence the rate of return on inward FDI increased from 4.8% in 2021 to 6.0 in 2022. The rate of return on direct investment in the EU in 2022 was higher than in any other year during the period shown in Figure 1.

(%)
Source: Eurostat (bop_fdi6_pos) and (bop_fdi6_inc)
EU FDI rate of return by activity
In 2021, the highest rate of return for EU investment abroad was for transportation and storage
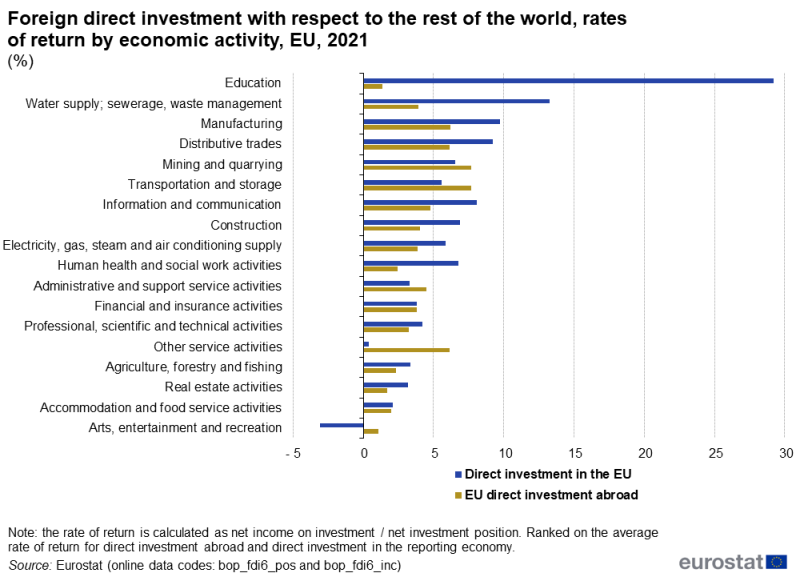
In 2021, the EU’s highest rates of return for outward FDI [1] were recorded for transportation and storage (7.7%), mining and quarrying (7.7%), manufacturing (6.2%), distributive trades (6.2%) and other service activities (6.1%) – see Figure 2. Positive rates of return were recorded for all of the remaining activities, with the lowest rates for arts, entertainment and recreation (1.1%) and education (1.3%).
The rate of return for foreign investors having invested in the category of education in the EU was 29.2% in 2021, more than double the next highest rate, 13.3% for water supply, sewerage and waste management. The next highest rates were for manufacturing (9.7%), distributive trades (9.2%) and information and communication (8.1%). Unlike for outward investment, a negative rate of return was recorded on inward investment for one activity, namely arts, entertainment and recreation (-3.1%).

(%)
Source: Eurostat (bop_fdi6_pos) and (bop_fdi6_inc)
EU FDI rate of return by investor
Among the EU countries, Ireland provided the highest rate of return for foreign investors in 2022
While the average rate of return for the EU on investment abroad was 5.2% in 2022, this ratio reached 22.0% for outward investment from Poland – see Figure 3. There were also relatively high rates on outward FDI from Bulgaria (13.3%), Greece (12.0%), Finland (11.3%) and Latvia (10.7%). By contrast, the rate of return on outward FDI from Lithuania was 1.6%. Note that these values for individual EU countries are based on all foreign investment, in other words investment in non-EU countries and in other EU countries.
In 2022, the highest rate of return for foreign investors (made by investors from non-EU countries and investors from other EU countries) was recorded in relation to inward investment in Ireland (13.1%). There were also relatively high rates on inward FDI in Romania (11.3%), Poland (10.9%), Czechia (10.5%), Finland (10.1%), Lithuania (10.1%) and Slovenia (9.9%). The rates of return for foreign investors were positive in 2022 in all EU countries, with the lowest rates in Luxembourg (3.3%), Spain (3.7%), Germany (3.9%), Italy (4.3%) and Portugal (4.5%).

(%)
Source: Eurostat (bop_fdi6_pos) and (bop_fdi6_inc)
Source data for tables and graphs
Footnotes
- ↑ The ranking of rates of return by activity may be of lower quality for outward investment than comparable information pertaining to inward investment, as not all of the EU countries are able to provide a breakdown according to the activity of non-resident enterprises.
Explore further
Other articles
Database
- European Union direct investments (BPM6) (bop_fdi6)
Thematic section
Selected datasets
Methodology
Metadata
- Balance of payments – international transactions (BPM6) (ESMS metadata file – bop_6_esms)
- European Union direct investments (BPM6) (ESMS metadata file – bop_fdi6_esms)
Further methodological information
