|
|
|
||||||||||||||||||||||||||||||||||||||||||||||||||||||||||||||||||||||||||||||||||||||||||||||||||||||||
| For any question on data and metadata, please contact: Eurostat user support |
|
|||
| 1.1. Contact organisation | Eurostat, the Statistical Office of the European Union |
||
| 1.2. Contact organisation unit | E1 - Agriculture and fisheries |
||
| 1.5. Contact mail address | |||
|
|||
| 2.1. Data description | |||
The vineyard data set includes data on the structure of vineyards in the European Union. It covers the holdings and areas
The data includes the vine types, degree of specialisation of wine-grower holdings, main varieties of grapes and age of plants. Some indicators are collected at national level, others at NUTS 2 level. The Member States, which have more than 500 ha of vines for other purpose than table grape production, need to collect the data. The data are extracted from the vineyard register. |
|||
| 2.2. Classification system | |||
The crops are classified according to the Eurostat standard code lists for crop items (dictionary: crops), main variables (dictionary: strucpro) and NUTS regions (NUTS 2013). The classifications are available in RAMON (https://showvoc.op.europa.eu/#/datasets) |
|||
| 2.3. Coverage - sector | |||
Growing of grapes for purposes other than table grapes (mainly for wine, juice, raisins) (part of NACE rev. 2 classification of A01.21: growing of grapes) and plant propagation for vines (part of NACE rev. 2 classification of A01.30: plant propagation). |
|||
| 2.4. Statistical concepts and definitions | |||
Statistical concepts and definitions are presented in the Vineyard data collection Handbook -Annex 1 |
|||
| 2.5. Statistical unit | |||
Areas are collected in hectares (ha) and number of holdings in numbers. |
|||
| 2.6. Statistical population | |||
All holdings growing vines intended to produce grapes for purposes other than table grapes or growing plants for vegetative propagation having an area bigger than 0.1 hectares registered in the vineyard register. |
|||
| 2.7. Reference area | |||
The data collection is limited to the countries having a bigger than 500 ha area of vines grown for other purposes than table grapes. The Member States under the reporting obligation for the 2015 data were 17 and they are the following:
The data collection covers NUTS 2 regions in which vines for wine, raisins and vegetative production are grown. The exceptions are Madeira and Azores in Portugal as they are not covered by the national vineyard registers. |
|||
| 2.8. Coverage - Time | |||
The reference year was 2015. |
|||
| 2.9. Base period | |||
Not applicable. |
|||
|
||||||||||||||||||||||||||||||||||||||||||||||||||||||||||||||||||||||||||||||||||||||||||||||||||||||||||||||||||||||||||||||||||||||||||||||||||||||||||||||||||||||
| 3.1. Source data | ||||||||||||||||||||||||||||||||||||||||||||||||||||||||||||||||||||||||||||||||||||||||||||||||||||||||||||||||||||||||||||||||||||||||||||||||||||||||||||||||||||||
Regulation (EC) No 1337/2011 stipulates in Article3(4) the following: The statistics on the permanent crop referred to in point (m) of Article 1(1) (=vines for other purposes than table grapes) of this Regulation shall be provided using the data available in the vineyard register implemented in accordance with Article 185a of Regulation (EC) No 1234/2007 for all the holdings included in this register, as defined in point (a) of Article 3(1) of Regulation (EC) No 436/2009. All Member States extracted the data from the vineyard register. The register is maintained in 9 Member States at national level, in 4 Member States at regional level and in another 4 Member States both at regional and national levels (Table 1). Table 1. Level of the vineyard register.
The vineyard register is maintained by the wine authorities. In most cases the statistical authorities did not have any problems to access the register data (Table 2). In Greece, Spain (some regions) and the United Kingdom some negotiations were necessary and in Spain (some regions) and Italy the negotiations were lengthy. Table 2. Accessibility of the register data.
The national Quality report sections 3.1-3.3 provide more information on the vineyard register. |
||||||||||||||||||||||||||||||||||||||||||||||||||||||||||||||||||||||||||||||||||||||||||||||||||||||||||||||||||||||||||||||||||||||||||||||||||||||||||||||||||||||
| 3.2. Frequency of data collection | ||||||||||||||||||||||||||||||||||||||||||||||||||||||||||||||||||||||||||||||||||||||||||||||||||||||||||||||||||||||||||||||||||||||||||||||||||||||||||||||||||||||
Since 2015, the EU-level data collection is done every 5 years. From 1979 to 2009 the basic survey was done every 10 years. In some countries national data collections are more frequent (Table 3). Table 3. National data collections 2010-2014.
|
||||||||||||||||||||||||||||||||||||||||||||||||||||||||||||||||||||||||||||||||||||||||||||||||||||||||||||||||||||||||||||||||||||||||||||||||||||||||||||||||||||||
| 3.3. Data collection | ||||||||||||||||||||||||||||||||||||||||||||||||||||||||||||||||||||||||||||||||||||||||||||||||||||||||||||||||||||||||||||||||||||||||||||||||||||||||||||||||||||||
Not available. |
||||||||||||||||||||||||||||||||||||||||||||||||||||||||||||||||||||||||||||||||||||||||||||||||||||||||||||||||||||||||||||||||||||||||||||||||||||||||||||||||||||||
| 3.4. Data validation | ||||||||||||||||||||||||||||||||||||||||||||||||||||||||||||||||||||||||||||||||||||||||||||||||||||||||||||||||||||||||||||||||||||||||||||||||||||||||||||||||||||||
All Member States reported that the data are validated before the transmission to Eurostat (Table 4). The validation checks cover a wide range of issues: completeness, validity, outliers, aggregates and relational issues. Most countries have automated a part of the validation checks. Portugal and Romania implemented only automated checks. Bulgaria, France, Cyprus, Hungary, Austria Slovakia and the UK reported to have only manual validation procedures in place. All other countries use a mixture of automatic and manual checks. Table 4. Validation checks.
|
||||||||||||||||||||||||||||||||||||||||||||||||||||||||||||||||||||||||||||||||||||||||||||||||||||||||||||||||||||||||||||||||||||||||||||||||||||||||||||||||||||||
| 3.5. Data compilation | ||||||||||||||||||||||||||||||||||||||||||||||||||||||||||||||||||||||||||||||||||||||||||||||||||||||||||||||||||||||||||||||||||||||||||||||||||||||||||||||||||||||
Not applicable |
||||||||||||||||||||||||||||||||||||||||||||||||||||||||||||||||||||||||||||||||||||||||||||||||||||||||||||||||||||||||||||||||||||||||||||||||||||||||||||||||||||||
| 3.6. Adjustment | ||||||||||||||||||||||||||||||||||||||||||||||||||||||||||||||||||||||||||||||||||||||||||||||||||||||||||||||||||||||||||||||||||||||||||||||||||||||||||||||||||||||
Not applicable |
||||||||||||||||||||||||||||||||||||||||||||||||||||||||||||||||||||||||||||||||||||||||||||||||||||||||||||||||||||||||||||||||||||||||||||||||||||||||||||||||||||||
|
||||||||||||||||||||||||||||||||||||||||||||||||||||||||||||||||||||||||||||||||||||||||||||||||||||||||||||||||||||||||||||||||||||||||||||||||||||||||||||||||||
Most of the Member States reported that there were quality management procedures in place for vineyard data collection. The details are shown in Table 5. Table 5. Quality management procedures.
In all other Member States the quality improvement plans have been done in co-operation with the register holder except in Spain, France and the UK. Several Member States were planning to improve the vineyard register concerning the coverage, update frequency and the identification of the holding (Table 6). Table 6. Planned improvement actions.
More information on the quality management can be found in section '4.1. Quality assurance' of the national Quality reports. |
||||||||||||||||||||||||||||||||||||||||||||||||||||||||||||||||||||||||||||||||||||||||||||||||||||||||||||||||||||||||||||||||||||||||||||||||||||||||||||||||||
| 4.1. Quality assurance | ||||||||||||||||||||||||||||||||||||||||||||||||||||||||||||||||||||||||||||||||||||||||||||||||||||||||||||||||||||||||||||||||||||||||||||||||||||||||||||||||||
Not available. |
||||||||||||||||||||||||||||||||||||||||||||||||||||||||||||||||||||||||||||||||||||||||||||||||||||||||||||||||||||||||||||||||||||||||||||||||||||||||||||||||||
| 4.2. Quality management - assessment | ||||||||||||||||||||||||||||||||||||||||||||||||||||||||||||||||||||||||||||||||||||||||||||||||||||||||||||||||||||||||||||||||||||||||||||||||||||||||||||||||||
The Member States provided self-assessment of the vineyard data quality (Table 7). Germany, Cyprus, Luxembourg and Austria consider the quality very good, Greece, France, Italy and Portugal satisfactory, the UK low and the rest of the countries good. Table 7. Quality self-assessment by criteria.
More information on the quality assessment can be found in section '4.2. Quality assessment' of the national Quality reports. |
||||||||||||||||||||||||||||||||||||||||||||||||||||||||||||||||||||||||||||||||||||||||||||||||||||||||||||||||||||||||||||||||||||||||||||||||||||||||||||||||||
|
||||||||||||||||||||||||||||||||||||
| 5.1. Relevance - User Needs | ||||||||||||||||||||||||||||||||||||
Structural vineyard statistics were considered necessary at national level in all countries except in Italy and the UK. Regulation (EU) 1337/2001 met the national needs in all countries except in France, Luxembourg, Hungary and Slovenia. Several countries added characteristics to the data collection (Table 8). Table 8. Additional characteristics collected by countries.
|
||||||||||||||||||||||||||||||||||||
| 5.2. Relevance - User Satisfaction | ||||||||||||||||||||||||||||||||||||
Greece, Spain and Austria had carried out a user satisfaction survey among the users of crop statistics. In all these countries the users were satisfied and in Greece even highly satisfied. |
||||||||||||||||||||||||||||||||||||
| 5.3. Completeness | ||||||||||||||||||||||||||||||||||||
The vineyard data are relatively complete. The missing characteristics are listed in Table 9. The missing characteristics are in most cases non-significant. Table 9. Missing characteristics.
Greece, Spain, Italy and Hungary have reported other main varieties than the ones listed in the Implementing Regulation. More information of these varieties can be found in the national Quality reports in section 5.3 'Completeness'. |
||||||||||||||||||||||||||||||||||||
| 5.3.1. Data completeness - rate | ||||||||||||||||||||||||||||||||||||
Not available. |
||||||||||||||||||||||||||||||||||||
|
||||||||||||||||||||||||||||||||||||||||||||||||||||||||||||||||||||||||||||||||||||||||||||||||||||||||||||||||||||||||||||||||||||||||||||||||||||||||||||||||||||||||||||||||||||||||||||||||||||||||||||||||||||||||||||||||||||||||||||||||||||||||||||||||||||||||||||||||||||||||||||||||
| 6.1. Accuracy - overall | ||||||||||||||||||||||||||||||||||||||||||||||||||||||||||||||||||||||||||||||||||||||||||||||||||||||||||||||||||||||||||||||||||||||||||||||||||||||||||||||||||||||||||||||||||||||||||||||||||||||||||||||||||||||||||||||||||||||||||||||||||||||||||||||||||||||||||||||||||||||||||||||||
The Member States assessed the accuracy and reliability of the vineyard data. Most countries considered the accuracy and reliability good, some of even very good. Four Member States state that the quality is satisfactory and only one, the UK, low (Table 10). Main reasons lowering the accuracy are coverage errors and missing characteristics. Table 10. Overall accuracy assessment.
|
||||||||||||||||||||||||||||||||||||||||||||||||||||||||||||||||||||||||||||||||||||||||||||||||||||||||||||||||||||||||||||||||||||||||||||||||||||||||||||||||||||||||||||||||||||||||||||||||||||||||||||||||||||||||||||||||||||||||||||||||||||||||||||||||||||||||||||||||||||||||||||||||
| 6.2. Sampling error | ||||||||||||||||||||||||||||||||||||||||||||||||||||||||||||||||||||||||||||||||||||||||||||||||||||||||||||||||||||||||||||||||||||||||||||||||||||||||||||||||||||||||||||||||||||||||||||||||||||||||||||||||||||||||||||||||||||||||||||||||||||||||||||||||||||||||||||||||||||||||||||||||
Not applicable |
||||||||||||||||||||||||||||||||||||||||||||||||||||||||||||||||||||||||||||||||||||||||||||||||||||||||||||||||||||||||||||||||||||||||||||||||||||||||||||||||||||||||||||||||||||||||||||||||||||||||||||||||||||||||||||||||||||||||||||||||||||||||||||||||||||||||||||||||||||||||||||||||
| 6.2.1. Sampling error - indicators | ||||||||||||||||||||||||||||||||||||||||||||||||||||||||||||||||||||||||||||||||||||||||||||||||||||||||||||||||||||||||||||||||||||||||||||||||||||||||||||||||||||||||||||||||||||||||||||||||||||||||||||||||||||||||||||||||||||||||||||||||||||||||||||||||||||||||||||||||||||||||||||||||
Not applicable |
||||||||||||||||||||||||||||||||||||||||||||||||||||||||||||||||||||||||||||||||||||||||||||||||||||||||||||||||||||||||||||||||||||||||||||||||||||||||||||||||||||||||||||||||||||||||||||||||||||||||||||||||||||||||||||||||||||||||||||||||||||||||||||||||||||||||||||||||||||||||||||||||
| 6.3. Non-sampling error | ||||||||||||||||||||||||||||||||||||||||||||||||||||||||||||||||||||||||||||||||||||||||||||||||||||||||||||||||||||||||||||||||||||||||||||||||||||||||||||||||||||||||||||||||||||||||||||||||||||||||||||||||||||||||||||||||||||||||||||||||||||||||||||||||||||||||||||||||||||||||||||||||
See details in specific items. |
||||||||||||||||||||||||||||||||||||||||||||||||||||||||||||||||||||||||||||||||||||||||||||||||||||||||||||||||||||||||||||||||||||||||||||||||||||||||||||||||||||||||||||||||||||||||||||||||||||||||||||||||||||||||||||||||||||||||||||||||||||||||||||||||||||||||||||||||||||||||||||||||
| 6.3.1. Coverage error | ||||||||||||||||||||||||||||||||||||||||||||||||||||||||||||||||||||||||||||||||||||||||||||||||||||||||||||||||||||||||||||||||||||||||||||||||||||||||||||||||||||||||||||||||||||||||||||||||||||||||||||||||||||||||||||||||||||||||||||||||||||||||||||||||||||||||||||||||||||||||||||||||
Under-coverage refers to missing parts of the population in the sample. The impact of under-coverage is very low as very small area is not covered by the registers (Table 11). The missing area are mostly used to produce grapes only for own consumption. Table 10.Under-coverage issues.
Multiple listings are cases where the same holding or parcel is recorded several times in the register. They are a larger problem only in Portugal. In most countries multiple listings do not exist at all or are rare. The impact on accuracy is very low. Table 12. Multiple listings issues.
Misclassification is a mistake where a phenomenon (e.g. vine type) is classified in a wrong class. It happened in almost half of the Member States and it concerned mostly the type of production. The impact on the overall quality is however rather small (Table 13). Table 13. Type of misclassification
More information of coverage issues can be found in the national Quality reports in section 6.3.1. 'Coverage errors' |
||||||||||||||||||||||||||||||||||||||||||||||||||||||||||||||||||||||||||||||||||||||||||||||||||||||||||||||||||||||||||||||||||||||||||||||||||||||||||||||||||||||||||||||||||||||||||||||||||||||||||||||||||||||||||||||||||||||||||||||||||||||||||||||||||||||||||||||||||||||||||||||||
| 6.3.1.1. Over-coverage - rate | ||||||||||||||||||||||||||||||||||||||||||||||||||||||||||||||||||||||||||||||||||||||||||||||||||||||||||||||||||||||||||||||||||||||||||||||||||||||||||||||||||||||||||||||||||||||||||||||||||||||||||||||||||||||||||||||||||||||||||||||||||||||||||||||||||||||||||||||||||||||||||||||||
Over-coverage is an issue in more than half of the countries. It results from non-active holdings staying in the register. In Bulgaria, Czech Republic, Greece, France and Cyprus they can stay there a long time, even more than 7 years. Table 11. Over-coverage issues.
|
||||||||||||||||||||||||||||||||||||||||||||||||||||||||||||||||||||||||||||||||||||||||||||||||||||||||||||||||||||||||||||||||||||||||||||||||||||||||||||||||||||||||||||||||||||||||||||||||||||||||||||||||||||||||||||||||||||||||||||||||||||||||||||||||||||||||||||||||||||||||||||||||
| 6.3.1.2. Common units - proportion | ||||||||||||||||||||||||||||||||||||||||||||||||||||||||||||||||||||||||||||||||||||||||||||||||||||||||||||||||||||||||||||||||||||||||||||||||||||||||||||||||||||||||||||||||||||||||||||||||||||||||||||||||||||||||||||||||||||||||||||||||||||||||||||||||||||||||||||||||||||||||||||||||
Not available. |
||||||||||||||||||||||||||||||||||||||||||||||||||||||||||||||||||||||||||||||||||||||||||||||||||||||||||||||||||||||||||||||||||||||||||||||||||||||||||||||||||||||||||||||||||||||||||||||||||||||||||||||||||||||||||||||||||||||||||||||||||||||||||||||||||||||||||||||||||||||||||||||||
| 6.3.2. Measurement error | ||||||||||||||||||||||||||||||||||||||||||||||||||||||||||||||||||||||||||||||||||||||||||||||||||||||||||||||||||||||||||||||||||||||||||||||||||||||||||||||||||||||||||||||||||||||||||||||||||||||||||||||||||||||||||||||||||||||||||||||||||||||||||||||||||||||||||||||||||||||||||||||||
Not available. |
||||||||||||||||||||||||||||||||||||||||||||||||||||||||||||||||||||||||||||||||||||||||||||||||||||||||||||||||||||||||||||||||||||||||||||||||||||||||||||||||||||||||||||||||||||||||||||||||||||||||||||||||||||||||||||||||||||||||||||||||||||||||||||||||||||||||||||||||||||||||||||||||
| 6.3.3. Non response error | ||||||||||||||||||||||||||||||||||||||||||||||||||||||||||||||||||||||||||||||||||||||||||||||||||||||||||||||||||||||||||||||||||||||||||||||||||||||||||||||||||||||||||||||||||||||||||||||||||||||||||||||||||||||||||||||||||||||||||||||||||||||||||||||||||||||||||||||||||||||||||||||||
In the context of vineyard data collection the non-response is understood as missing characteristics in the vineyard register. In half of the Member states some characteristics were missing in the registers (Table 14). Most common missing features were vines for raisins (dried grapes) and vines producing propagation material. France, Italy, Austria and Slovenia used ancillary data sources to fill in the gaps. Table 14. Missing characteristics.
|
||||||||||||||||||||||||||||||||||||||||||||||||||||||||||||||||||||||||||||||||||||||||||||||||||||||||||||||||||||||||||||||||||||||||||||||||||||||||||||||||||||||||||||||||||||||||||||||||||||||||||||||||||||||||||||||||||||||||||||||||||||||||||||||||||||||||||||||||||||||||||||||||
| 6.3.3.1. Unit non-response - rate | ||||||||||||||||||||||||||||||||||||||||||||||||||||||||||||||||||||||||||||||||||||||||||||||||||||||||||||||||||||||||||||||||||||||||||||||||||||||||||||||||||||||||||||||||||||||||||||||||||||||||||||||||||||||||||||||||||||||||||||||||||||||||||||||||||||||||||||||||||||||||||||||||
Not available. |
||||||||||||||||||||||||||||||||||||||||||||||||||||||||||||||||||||||||||||||||||||||||||||||||||||||||||||||||||||||||||||||||||||||||||||||||||||||||||||||||||||||||||||||||||||||||||||||||||||||||||||||||||||||||||||||||||||||||||||||||||||||||||||||||||||||||||||||||||||||||||||||||
| 6.3.3.2. Item non-response - rate | ||||||||||||||||||||||||||||||||||||||||||||||||||||||||||||||||||||||||||||||||||||||||||||||||||||||||||||||||||||||||||||||||||||||||||||||||||||||||||||||||||||||||||||||||||||||||||||||||||||||||||||||||||||||||||||||||||||||||||||||||||||||||||||||||||||||||||||||||||||||||||||||||
Not available. |
||||||||||||||||||||||||||||||||||||||||||||||||||||||||||||||||||||||||||||||||||||||||||||||||||||||||||||||||||||||||||||||||||||||||||||||||||||||||||||||||||||||||||||||||||||||||||||||||||||||||||||||||||||||||||||||||||||||||||||||||||||||||||||||||||||||||||||||||||||||||||||||||
| 6.3.4. Processing error | ||||||||||||||||||||||||||||||||||||||||||||||||||||||||||||||||||||||||||||||||||||||||||||||||||||||||||||||||||||||||||||||||||||||||||||||||||||||||||||||||||||||||||||||||||||||||||||||||||||||||||||||||||||||||||||||||||||||||||||||||||||||||||||||||||||||||||||||||||||||||||||||||
Not available. |
||||||||||||||||||||||||||||||||||||||||||||||||||||||||||||||||||||||||||||||||||||||||||||||||||||||||||||||||||||||||||||||||||||||||||||||||||||||||||||||||||||||||||||||||||||||||||||||||||||||||||||||||||||||||||||||||||||||||||||||||||||||||||||||||||||||||||||||||||||||||||||||||
| 6.3.4.1. Imputation - rate | ||||||||||||||||||||||||||||||||||||||||||||||||||||||||||||||||||||||||||||||||||||||||||||||||||||||||||||||||||||||||||||||||||||||||||||||||||||||||||||||||||||||||||||||||||||||||||||||||||||||||||||||||||||||||||||||||||||||||||||||||||||||||||||||||||||||||||||||||||||||||||||||||
Not available. |
||||||||||||||||||||||||||||||||||||||||||||||||||||||||||||||||||||||||||||||||||||||||||||||||||||||||||||||||||||||||||||||||||||||||||||||||||||||||||||||||||||||||||||||||||||||||||||||||||||||||||||||||||||||||||||||||||||||||||||||||||||||||||||||||||||||||||||||||||||||||||||||||
| 6.3.5. Model assumption error | ||||||||||||||||||||||||||||||||||||||||||||||||||||||||||||||||||||||||||||||||||||||||||||||||||||||||||||||||||||||||||||||||||||||||||||||||||||||||||||||||||||||||||||||||||||||||||||||||||||||||||||||||||||||||||||||||||||||||||||||||||||||||||||||||||||||||||||||||||||||||||||||||
Not available. |
||||||||||||||||||||||||||||||||||||||||||||||||||||||||||||||||||||||||||||||||||||||||||||||||||||||||||||||||||||||||||||||||||||||||||||||||||||||||||||||||||||||||||||||||||||||||||||||||||||||||||||||||||||||||||||||||||||||||||||||||||||||||||||||||||||||||||||||||||||||||||||||||
| 6.4. Seasonal adjustment | ||||||||||||||||||||||||||||||||||||||||||||||||||||||||||||||||||||||||||||||||||||||||||||||||||||||||||||||||||||||||||||||||||||||||||||||||||||||||||||||||||||||||||||||||||||||||||||||||||||||||||||||||||||||||||||||||||||||||||||||||||||||||||||||||||||||||||||||||||||||||||||||||
Not applicable |
||||||||||||||||||||||||||||||||||||||||||||||||||||||||||||||||||||||||||||||||||||||||||||||||||||||||||||||||||||||||||||||||||||||||||||||||||||||||||||||||||||||||||||||||||||||||||||||||||||||||||||||||||||||||||||||||||||||||||||||||||||||||||||||||||||||||||||||||||||||||||||||||
| 6.5. Data revision - policy | ||||||||||||||||||||||||||||||||||||||||||||||||||||||||||||||||||||||||||||||||||||||||||||||||||||||||||||||||||||||||||||||||||||||||||||||||||||||||||||||||||||||||||||||||||||||||||||||||||||||||||||||||||||||||||||||||||||||||||||||||||||||||||||||||||||||||||||||||||||||||||||||||
Not available. |
||||||||||||||||||||||||||||||||||||||||||||||||||||||||||||||||||||||||||||||||||||||||||||||||||||||||||||||||||||||||||||||||||||||||||||||||||||||||||||||||||||||||||||||||||||||||||||||||||||||||||||||||||||||||||||||||||||||||||||||||||||||||||||||||||||||||||||||||||||||||||||||||
| 6.6. Data revision - practice | ||||||||||||||||||||||||||||||||||||||||||||||||||||||||||||||||||||||||||||||||||||||||||||||||||||||||||||||||||||||||||||||||||||||||||||||||||||||||||||||||||||||||||||||||||||||||||||||||||||||||||||||||||||||||||||||||||||||||||||||||||||||||||||||||||||||||||||||||||||||||||||||||
Not available. |
||||||||||||||||||||||||||||||||||||||||||||||||||||||||||||||||||||||||||||||||||||||||||||||||||||||||||||||||||||||||||||||||||||||||||||||||||||||||||||||||||||||||||||||||||||||||||||||||||||||||||||||||||||||||||||||||||||||||||||||||||||||||||||||||||||||||||||||||||||||||||||||||
| 6.6.1. Data revision - average size | ||||||||||||||||||||||||||||||||||||||||||||||||||||||||||||||||||||||||||||||||||||||||||||||||||||||||||||||||||||||||||||||||||||||||||||||||||||||||||||||||||||||||||||||||||||||||||||||||||||||||||||||||||||||||||||||||||||||||||||||||||||||||||||||||||||||||||||||||||||||||||||||||
Not available. |
||||||||||||||||||||||||||||||||||||||||||||||||||||||||||||||||||||||||||||||||||||||||||||||||||||||||||||||||||||||||||||||||||||||||||||||||||||||||||||||||||||||||||||||||||||||||||||||||||||||||||||||||||||||||||||||||||||||||||||||||||||||||||||||||||||||||||||||||||||||||||||||||
|
||||||||||||||||||||||||||||||||||||||||||||||||||||||||||||||||||||||||
| 7.1. Timeliness | ||||||||||||||||||||||||||||||||||||||||||||||||||||||||||||||||||||||||
Most countries followed the Eurostat instructions and extracted the data in July 2015. Luxembourg, Portugal and the UK extracted the data in 2016 and Italy in 2017 due to data availability reasons (Table 15). In most countries the register is updated continuously. In Italy and Luxembourg it is done only once per year and in the UK twice per year. Table 15. Data extraction date and update frequency of the register.
|
||||||||||||||||||||||||||||||||||||||||||||||||||||||||||||||||||||||||
| 7.1.1. Time lag - first result | ||||||||||||||||||||||||||||||||||||||||||||||||||||||||||||||||||||||||
Not available. |
||||||||||||||||||||||||||||||||||||||||||||||||||||||||||||||||||||||||
| 7.1.2. Time lag - final result | ||||||||||||||||||||||||||||||||||||||||||||||||||||||||||||||||||||||||
Not available. |
||||||||||||||||||||||||||||||||||||||||||||||||||||||||||||||||||||||||
| 7.2. Punctuality | ||||||||||||||||||||||||||||||||||||||||||||||||||||||||||||||||||||||||
The punctuality of the data transmissions is assessed by Eurostat on the basis of received transmissions in EDAMIS (Table 16). Table 16. Data reception.
All other countries delivered the data on time, except France and Slovakia, which had a minor delay (3 days), and Portugal and Italy which had significant delays, 161 and 298 days respectively. The long delays were due to the late access to the vineyard register. |
||||||||||||||||||||||||||||||||||||||||||||||||||||||||||||||||||||||||
| 7.2.1. Punctuality - delivery and publication | ||||||||||||||||||||||||||||||||||||||||||||||||||||||||||||||||||||||||
See 7.2. Punctuality |
||||||||||||||||||||||||||||||||||||||||||||||||||||||||||||||||||||||||
|
||||||||||||||||||||||||||||||||||||||||||||||||||||||||||||||||||||||||||||||||||||||||||||||||||||||||||||||||||||||||||||||||||||||||||||||||||||||||||||||||||||||||||||||||||||
| 8.1. Comparability - geographical | ||||||||||||||||||||||||||||||||||||||||||||||||||||||||||||||||||||||||||||||||||||||||||||||||||||||||||||||||||||||||||||||||||||||||||||||||||||||||||||||||||||||||||||||||||||
Not available. |
||||||||||||||||||||||||||||||||||||||||||||||||||||||||||||||||||||||||||||||||||||||||||||||||||||||||||||||||||||||||||||||||||||||||||||||||||||||||||||||||||||||||||||||||||||
| 8.1.1. Asymmetry for mirror flow statistics - coefficient | ||||||||||||||||||||||||||||||||||||||||||||||||||||||||||||||||||||||||||||||||||||||||||||||||||||||||||||||||||||||||||||||||||||||||||||||||||||||||||||||||||||||||||||||||||||
Not applicable |
||||||||||||||||||||||||||||||||||||||||||||||||||||||||||||||||||||||||||||||||||||||||||||||||||||||||||||||||||||||||||||||||||||||||||||||||||||||||||||||||||||||||||||||||||||
| 8.2. Comparability - over time | ||||||||||||||||||||||||||||||||||||||||||||||||||||||||||||||||||||||||||||||||||||||||||||||||||||||||||||||||||||||||||||||||||||||||||||||||||||||||||||||||||||||||||||||||||||
The change of legal basis has had an impact on the data comparability. Until 2009 the data were gathered from statistical surveys conducted on a 10-year basis pursuant to Council Regulation (EEC) 357/79. The Regulation (EU) No 1337/2011 was adopted in December 2011 and it entered into force in January 2012. Consequently, the vineyard data collection is now conducted every five years, with 2015 being the first reference year. In more than half of the Member States the methodology changed significantly from the 2009 data collection to the 2015 data collection (Table 17). Those countries which used surveys in the past had to adapt to the requirement to use the vineyard register as the sole data source. Another major difference is the obligatory use of NUTS regions in the 2015 data collection instead of wine regions. Only in Germany, Spain, Cyprus and Romania the same methodology and regional breakdown were used in these two data collections. Table 17. Differences between the 2009 and 2015 data collections.
In half of the Member States there were major methodological differences between the 2009 and 2015 data collections. |
||||||||||||||||||||||||||||||||||||||||||||||||||||||||||||||||||||||||||||||||||||||||||||||||||||||||||||||||||||||||||||||||||||||||||||||||||||||||||||||||||||||||||||||||||||
| 8.2.1. Length of comparable time series | ||||||||||||||||||||||||||||||||||||||||||||||||||||||||||||||||||||||||||||||||||||||||||||||||||||||||||||||||||||||||||||||||||||||||||||||||||||||||||||||||||||||||||||||||||||
Not available |
||||||||||||||||||||||||||||||||||||||||||||||||||||||||||||||||||||||||||||||||||||||||||||||||||||||||||||||||||||||||||||||||||||||||||||||||||||||||||||||||||||||||||||||||||||
| 8.3. Coherence - cross domain | ||||||||||||||||||||||||||||||||||||||||||||||||||||||||||||||||||||||||||||||||||||||||||||||||||||||||||||||||||||||||||||||||||||||||||||||||||||||||||||||||||||||||||||||||||||
The importance of the cross-domain coherence has been stressed by Eurostat. Most Member States compared the vineyard data with the Annual crop statistics (ACS) and FSS (Farm Structure Survey) data (Table 18). Only Luxembourg and the UK did not do cross-domain comparisons. The Annual crop statistics are collected annually and they include among other things production area for grapes for wine (with sub-classes PDO, PGI and other wines n.e.c.), which corresponds to the 'areas under vines for wines in vineyard data collection. The FSS data has the same breakdown as the ACS data and they are collected every three years (most recent in 2013 and 2016) at farm level. Table 18. Data comparisons against other data sets.
According to the Member States analysis the differences between the vineyard data, annual crop statistics and the FSS data are small in most cases (Table 19).
Table 19. Self-assessment of the results of the data comparisons.
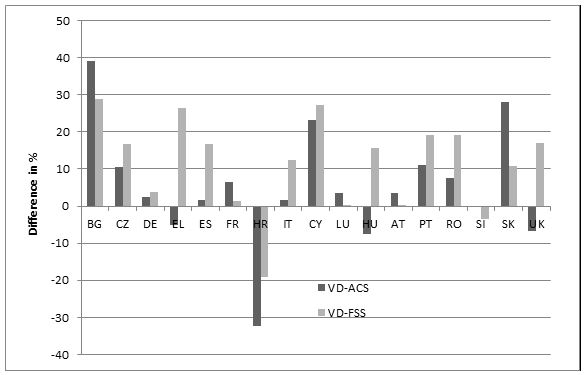
Eurostat made also an assessment of the differences in area of vineyards for wine grapes between the vineyard data (2015), ACS (2015) and FSS data (2013). The results are shown in Figure 1 (in % against the vineyard data). In many Member States the vineyard data show more than 10% larger area than the ACS of the FSS. There are three main explanations for that: firstly, the threshold in the register is very small, in most cases 0.1 ha and in FSS several countries use a higher threshold. Secondly, in several countries the register has over coverage (abandoned areas are still in the register). And thirdly, the area definition is different in vineyard data than in the ACS, where only the production areas are included. Only in Croatia the vineyard data show a smaller area than ACS and FSS. In Germany, France, Luxembourg, Austria and Slovenia the differences between the data sources are small.
Figure 1. Eurostat comparison between the vineyard data, ACS data and he FSS data (expressed in % against the vineyard data. More information of cross-domain comparisons can be found in the national Quality reports in section '8.3. Coherence - cross domain' |
||||||||||||||||||||||||||||||||||||||||||||||||||||||||||||||||||||||||||||||||||||||||||||||||||||||||||||||||||||||||||||||||||||||||||||||||||||||||||||||||||||||||||||||||||||
| 8.4. Coherence - sub annual and annual statistics | ||||||||||||||||||||||||||||||||||||||||||||||||||||||||||||||||||||||||||||||||||||||||||||||||||||||||||||||||||||||||||||||||||||||||||||||||||||||||||||||||||||||||||||||||||||
Not applicable |
||||||||||||||||||||||||||||||||||||||||||||||||||||||||||||||||||||||||||||||||||||||||||||||||||||||||||||||||||||||||||||||||||||||||||||||||||||||||||||||||||||||||||||||||||||
| 8.5. Coherence - National Accounts | ||||||||||||||||||||||||||||||||||||||||||||||||||||||||||||||||||||||||||||||||||||||||||||||||||||||||||||||||||||||||||||||||||||||||||||||||||||||||||||||||||||||||||||||||||||
Not applicable |
||||||||||||||||||||||||||||||||||||||||||||||||||||||||||||||||||||||||||||||||||||||||||||||||||||||||||||||||||||||||||||||||||||||||||||||||||||||||||||||||||||||||||||||||||||
| 8.6. Coherence - internal | ||||||||||||||||||||||||||||||||||||||||||||||||||||||||||||||||||||||||||||||||||||||||||||||||||||||||||||||||||||||||||||||||||||||||||||||||||||||||||||||||||||||||||||||||||||
Not available. |
||||||||||||||||||||||||||||||||||||||||||||||||||||||||||||||||||||||||||||||||||||||||||||||||||||||||||||||||||||||||||||||||||||||||||||||||||||||||||||||||||||||||||||||||||||
|
||||||||||||||||||||||||||||||||||||||||||||||||||||||||||||||||||||||||||||||||||||||||||||||||||||||||||||||||||||||||||||||||||||||||||||||||||||||||||||||||||||||||||||||||||||||||||||||||||||||
Most Member States make the vineyard data or the results of the data collection available to the data users in many formats (Table 21). Table 21. Access to the vineyard data.
The national Quality report section 9 'Accessibility and clarity' provides more information on the data accessibility and clarity. |
||||||||||||||||||||||||||||||||||||||||||||||||||||||||||||||||||||||||||||||||||||||||||||||||||||||||||||||||||||||||||||||||||||||||||||||||||||||||||||||||||||||||||||||||||||||||||||||||||||||
| 9.1. Dissemination format - News release | ||||||||||||||||||||||||||||||||||||||||||||||||||||||||||||||||||||||||||||||||||||||||||||||||||||||||||||||||||||||||||||||||||||||||||||||||||||||||||||||||||||||||||||||||||||||||||||||||||||||
Not available. |
||||||||||||||||||||||||||||||||||||||||||||||||||||||||||||||||||||||||||||||||||||||||||||||||||||||||||||||||||||||||||||||||||||||||||||||||||||||||||||||||||||||||||||||||||||||||||||||||||||||
| 9.2. Dissemination format - Publications | ||||||||||||||||||||||||||||||||||||||||||||||||||||||||||||||||||||||||||||||||||||||||||||||||||||||||||||||||||||||||||||||||||||||||||||||||||||||||||||||||||||||||||||||||||||||||||||||||||||||
Not available. |
||||||||||||||||||||||||||||||||||||||||||||||||||||||||||||||||||||||||||||||||||||||||||||||||||||||||||||||||||||||||||||||||||||||||||||||||||||||||||||||||||||||||||||||||||||||||||||||||||||||
| 9.3. Dissemination format - online database | ||||||||||||||||||||||||||||||||||||||||||||||||||||||||||||||||||||||||||||||||||||||||||||||||||||||||||||||||||||||||||||||||||||||||||||||||||||||||||||||||||||||||||||||||||||||||||||||||||||||
Not available. |
||||||||||||||||||||||||||||||||||||||||||||||||||||||||||||||||||||||||||||||||||||||||||||||||||||||||||||||||||||||||||||||||||||||||||||||||||||||||||||||||||||||||||||||||||||||||||||||||||||||
| 9.3.1. Data tables - consultations | ||||||||||||||||||||||||||||||||||||||||||||||||||||||||||||||||||||||||||||||||||||||||||||||||||||||||||||||||||||||||||||||||||||||||||||||||||||||||||||||||||||||||||||||||||||||||||||||||||||||
Not available. |
||||||||||||||||||||||||||||||||||||||||||||||||||||||||||||||||||||||||||||||||||||||||||||||||||||||||||||||||||||||||||||||||||||||||||||||||||||||||||||||||||||||||||||||||||||||||||||||||||||||
| 9.4. Dissemination format - microdata access | ||||||||||||||||||||||||||||||||||||||||||||||||||||||||||||||||||||||||||||||||||||||||||||||||||||||||||||||||||||||||||||||||||||||||||||||||||||||||||||||||||||||||||||||||||||||||||||||||||||||
Not available. |
||||||||||||||||||||||||||||||||||||||||||||||||||||||||||||||||||||||||||||||||||||||||||||||||||||||||||||||||||||||||||||||||||||||||||||||||||||||||||||||||||||||||||||||||||||||||||||||||||||||
| 9.5. Dissemination format - other | ||||||||||||||||||||||||||||||||||||||||||||||||||||||||||||||||||||||||||||||||||||||||||||||||||||||||||||||||||||||||||||||||||||||||||||||||||||||||||||||||||||||||||||||||||||||||||||||||||||||
Not available. |
||||||||||||||||||||||||||||||||||||||||||||||||||||||||||||||||||||||||||||||||||||||||||||||||||||||||||||||||||||||||||||||||||||||||||||||||||||||||||||||||||||||||||||||||||||||||||||||||||||||
| 9.6. Documentation on methodology | ||||||||||||||||||||||||||||||||||||||||||||||||||||||||||||||||||||||||||||||||||||||||||||||||||||||||||||||||||||||||||||||||||||||||||||||||||||||||||||||||||||||||||||||||||||||||||||||||||||||
Not available. |
||||||||||||||||||||||||||||||||||||||||||||||||||||||||||||||||||||||||||||||||||||||||||||||||||||||||||||||||||||||||||||||||||||||||||||||||||||||||||||||||||||||||||||||||||||||||||||||||||||||
| 9.7. Quality management - documentation | ||||||||||||||||||||||||||||||||||||||||||||||||||||||||||||||||||||||||||||||||||||||||||||||||||||||||||||||||||||||||||||||||||||||||||||||||||||||||||||||||||||||||||||||||||||||||||||||||||||||
Not available. |
||||||||||||||||||||||||||||||||||||||||||||||||||||||||||||||||||||||||||||||||||||||||||||||||||||||||||||||||||||||||||||||||||||||||||||||||||||||||||||||||||||||||||||||||||||||||||||||||||||||
| 9.7.1. Metadata completeness - rate | ||||||||||||||||||||||||||||||||||||||||||||||||||||||||||||||||||||||||||||||||||||||||||||||||||||||||||||||||||||||||||||||||||||||||||||||||||||||||||||||||||||||||||||||||||||||||||||||||||||||
Not available. |
||||||||||||||||||||||||||||||||||||||||||||||||||||||||||||||||||||||||||||||||||||||||||||||||||||||||||||||||||||||||||||||||||||||||||||||||||||||||||||||||||||||||||||||||||||||||||||||||||||||
| 9.7.2. Metadata - consultations | ||||||||||||||||||||||||||||||||||||||||||||||||||||||||||||||||||||||||||||||||||||||||||||||||||||||||||||||||||||||||||||||||||||||||||||||||||||||||||||||||||||||||||||||||||||||||||||||||||||||
Not available. |
||||||||||||||||||||||||||||||||||||||||||||||||||||||||||||||||||||||||||||||||||||||||||||||||||||||||||||||||||||||||||||||||||||||||||||||||||||||||||||||||||||||||||||||||||||||||||||||||||||||
|
|||
Not available. |
|||
|
|||
Not available. |
|||
| 11.1. Confidentiality - policy | |||
Not available. |
|||
| 11.2. Confidentiality - data treatment | |||
Not available. |
|||
|
|||
Not available. |
|||
|
|||
|
|||
| Eurostat Handbook for Structural Statistics on Vineyards |
|||