|
 |
| For any question on data and metadata, please contact: Eurostat user support |
|
|||
| 1.1. Contact organisation | Statistics Sweden. |
||
| 1.2. Contact organisation unit | Economic Statistics and Analysis Innovation, Business sector production and Research Statistics Sweden
|
||
| 1.5. Contact mail address | Statistics Sweden Att. Nils Adriansson ESA/NUP/INF Solna strandväg 86, Solna SWEDEN
+46 10 479 47 53
|
||
|
|||
| 2.1. Metadata last certified | 27/10/2022 | ||
| 2.2. Metadata last posted | 27/10/2022 | ||
| 2.3. Metadata last update | 27/10/2022 | ||
|
||||||||||||||||||
| 3.1. Data description | ||||||||||||||||||
Statistics on Business enterprise R&D (BERD) measure research and experimental development (R&D) performed in the business enterprise sector, i.e. R&D expenditure and R&D personnel. In line with this objective the target population for the national R&D survey of the business enterprise sector consist of all R&D performing enterprises (including all R&D performers – occasional and continuous, known and unknown - in all branches and size classes) belonging to this sector. The “enterprise” is defined in Council Regulation (EEC) No 1993/696 of 15 March 1993. The results are related to the population of all R&D performing enterprises classified in Sections A to U of the common statistical classification of economic activities as established by Regulation (EC) No 1893/2006 of the European Parliament and of the Council (NACE Rev.2).
The main concepts and definitions used for the production of R&D statistics are given by OECD (2015), Frascati Manual 2015: Guidelines for Collecting and Reporting Data on Research and Experimental Development, The Measurement of Scientific, Technological and Innovation Activities, which is the internationally recognised standard methodology for collecting R&D statistics and by Eurostat’s European Business Statistics Methodological Manual on R&D Statistics. (EBS Methodological Manual on R&D Statistics).
Since the beginning of 2021, the collection of R&D statistics is based on Commission Implementing Regulation (EU) No 2020/1197 of 30 July 2020. The Regulation sets the framework for the collection of R&D statistics and specifies the main variables of interest and their breakdowns at predefined level of detail. Statistics on science, technology and innovation were collected until the end of 2020 based on Commission Implementing Regulation (EU) No 2012/995 concerning the production and development of Community statistics on science and technology. |
||||||||||||||||||
| 3.2. Classification system | ||||||||||||||||||
|
||||||||||||||||||
| 3.2.1. Additional classifications | ||||||||||||||||||
|
||||||||||||||||||
| 3.3. Coverage - sector | ||||||||||||||||||
Business enterprise sector as defined in Frascati Manual 2015. For more details see specifications below. |
||||||||||||||||||
| 3.3.1. General coverage | ||||||||||||||||||
|
||||||||||||||||||
| 3.3.2. Sector institutional coverage | ||||||||||||||||||
|
||||||||||||||||||
| 3.3.3. R&D variable coverage | ||||||||||||||||||
|
||||||||||||||||||
| 3.3.4. International R&D transactions | ||||||||||||||||||
|
||||||||||||||||||
| 3.3.5. Extramural R&D expenditures | ||||||||||||||||||
According to the Frascati Manual, expenditure on extramural R&D (i.e. R&D performed outside the statistical unit enterprise) is not included in intramural R&D performance totals (FM, §4.12).
|
||||||||||||||||||
| 3.4. Statistical concepts and definitions | ||||||||||||||||||
See below. |
||||||||||||||||||
| 3.4.1. R&D expenditure | ||||||||||||||||||
|
||||||||||||||||||
| 3.4.2. R&D personnel | ||||||||||||||||||
See below. |
||||||||||||||||||
| 3.4.2.1. R&D personnel – Head Counts (HC) | ||||||||||||||||||
|
||||||||||||||||||
| 3.4.2.2. R&D personnel – Full Time Equivalent (FTE) | ||||||||||||||||||
|
||||||||||||||||||
| 3.4.2.3. FTE calculation | ||||||||||||||||||
The FTE is defined as work on R&D performed by one full-time employed person during one year. The FTE should, according to the national questionnaires, be reported with an accuracy of 0.1. |
||||||||||||||||||
| 3.4.2.4. R&D personnel - Cross-classification by function and qualification | ||||||||||||||||||
|
||||||||||||||||||
| 3.5. Statistical unit | ||||||||||||||||||
The enterprise is the statistical unit. |
||||||||||||||||||
| 3.6. Statistical population | ||||||||||||||||||
See below. |
||||||||||||||||||
| 3.6.1. National target population | ||||||||||||||||||
The objective of the European R&D statistics is to cover all intramural R&D activities. In line with this objective the target population for the national R&D survey of the Business Enterprise Sector should consist of all R&D performing enterprises (including all R&D performers – occasional and continuous, known and unknown - in all branches and size classes) belonging to this sector. In practice however, countries in their R&D surveys might exclude some enterprises for which R&D activities are deemed to be non-existent or negligible, in order to limit the response burden or due to budgetary constraints.
|
||||||||||||||||||
| 3.6.2. Frame population – Description | ||||||||||||||||||
The target population is the population for which inferences are made. The frame (or frames, as sometimes several frames are used) is a device that permits access to population units. The frame population is the set of population units which can be accessed through the frame and the survey data really refer to this population.
1) i.e. enterprises previously not known or not supposed to perform R&D |
||||||||||||||||||
| 3.7. Reference area | ||||||||||||||||||
Not requested. R&D statistics cover national and regional data. |
||||||||||||||||||
| 3.8. Coverage - Time | ||||||||||||||||||
Not requested. See point 3.4. |
||||||||||||||||||
| 3.9. Base period | ||||||||||||||||||
Not requested. |
||||||||||||||||||
|
|||
R&D expenditure in national currency in thousands, and R&D personnel by head count and in full-time equivalents. |
|||
|
|||
2021. |
|||
|
||||||||||||||
| 6.1. Institutional Mandate - legal acts and other agreements | ||||||||||||||
See below. |
||||||||||||||
| 6.1.1. European legislation | ||||||||||||||
|
||||||||||||||
| 6.1.2. National legislation | ||||||||||||||
|
||||||||||||||
| 6.1.3. Standards and manuals | ||||||||||||||
- Frascati Manual 2015, Guidelines for Collecting and Reporting Data on Research and Experimental Development |
||||||||||||||
| 6.2. Institutional Mandate - data sharing | ||||||||||||||
Not requested. |
||||||||||||||
|
|||
| 7.1. Confidentiality - policy | |||
Confidentiality, being one of the process quality components, concerns the privacy of data providers (households, enterprises, administrations and other respondents), the confidentiality of the information they provide and the extent of its use for statistical purposes. A property of data indicating the extent to which their unauthorised disclosure could be prejudicial or harmful to the interest of the source or other relevant parties.
a) Confidentiality protection required by law: The major policy in place to ensure confidentiality and prevent unauthorised disclosure of data that identify a person or economic entity is the Public Access to Information and Secrecy Act (2009:400). There are also specific conditions concerning the confidentiality of official statistics in the Official Statistics Act (2001:99).
b) Confidentiality commitments of survey staff: Statistics Sweden has a confidentiality policy to which all survey staff must adhere. It contains guidance on the practical application of the legal acts stated above. Annexes: Statistics Sweden's confidentiality (English) |
|||
| 7.2. Confidentiality - data treatment | |||
For aggregate outputs, primary cell suppression is used as a general rule to ensure no confidential information is disclosed. To ensure that the information cannot be calculated using data in other cells, secondary cell suppression is used. These cells will be flagged as confidential. Any disclosure of microdata from the BES survey must be tried. It can be disclosed only for research or statistical purposes and only to such entities that are deemed able to ensure confidentiality protection of the data. |
|||
|
|||
| 8.1. Release calendar | |||
The release policy and the release calendar are publicly available at Statistics Sweden's website. |
|||
| 8.2. Release calendar access | |||
The publication calendar is available on Statistics Sweden's website. Annexes: Publishing calendar |
|||
| 8.3. Release policy - user access | |||
Statistics Sweden's release policy states that all statistics must be made available to all users equally and at the same time. Statistics are always released at 8.00 am on weekdays. Users are also informed of the availability of new statistics by news releases on Statistics Sweden's website. It is possible for users to subscribe to get e-mail notifications when new statistics within a certain subject area are released. Statistics are released by being made available in the statistical database. The release policy is available on Statistics Sweden's website. Annexes: Release policy (available in Swedish only) |
|||
|
|||
Yearly data dissemination. |
|||
|
||||||||||||||||
| 10.1. Dissemination format - News release | ||||||||||||||||
See below. |
||||||||||||||||
| 10.1.1. Availability of the releases | ||||||||||||||||
1) Y - Yes, N – No |
||||||||||||||||
| 10.2. Dissemination format - Publications | ||||||||||||||||
See below. |
||||||||||||||||
| 10.2.1. Availability of means of dissemination | ||||||||||||||||
1) Y – Yes, N - No |
||||||||||||||||
| 10.3. Dissemination format - online database | ||||||||||||||||
An online statistical database is available on Statistics Sweden's website (see link in Annex). Annexes: Statistical database - R&D statistics |
||||||||||||||||
| 10.3.1. Data tables - consultations | ||||||||||||||||
Not requested. |
||||||||||||||||
| 10.4. Dissemination format - microdata access | ||||||||||||||||
See below. |
||||||||||||||||
| 10.4.1. Provisions affecting the access | ||||||||||||||||
|
||||||||||||||||
| 10.5. Dissemination format - other | ||||||||||||||||
See below. |
||||||||||||||||
| 10.5.1. Metadata - consultations | ||||||||||||||||
Not requested. |
||||||||||||||||
| 10.5.2. Availability of other dissemination means | ||||||||||||||||
1) Y – Yes, N - No |
||||||||||||||||
| 10.6. Documentation on methodology | ||||||||||||||||
The main documentation on methodology is titled Statistikens framställning (translates to Statistical production) which is updated when new statistics are published. There is a common document covering all sectors for the R&D statistics in which the specific methodology for each sector is described. This documentation is only available in Swedish. Annexes: Methodology documentation (available in Swedish only) |
||||||||||||||||
| 10.6.1. Metadata completeness - rate | ||||||||||||||||
Not requested. |
||||||||||||||||
| 10.7. Quality management - documentation | ||||||||||||||||
See below. |
||||||||||||||||
| 10.7.1. Information and clarity | ||||||||||||||||
Annexes: Methodology report (only available in Swedish) Quality report (only available in Swedish) Metadata documentation (in Swedish only) |
||||||||||||||||
|
|||
| 11.1. Quality assurance | |||
The quality management process at Statistics Sweden is described in a Quality policy. There is also a handbook on quality in official statistics which provides guidance concerning quality management and definitions and guidance on the quality criteria. The following quality criteria for official statistics are regulated by the Official Statistics Act (2001:99) and are the same as are reported in this document: |
|||
| 11.2. Quality management - assessment | |||
The methodology used is based on the Frascati Manual recommendations. The quality of the statistics is assessed regularly, and the R&D statistics meet the quality requirements. The consensus survey of enterprises with 200 and more employees; with 5 SEK million or more in R&D expenditure previous survey; NACE 72; and Reasearch institutes which allows us to cover and a large part of the R&D performing population. With the BES survey being compulsory the response rate is high, approx. 85 percent. Given the concentration of R&D expenditure to the top performers, the responses from the largest R&D enterprises are carefully reviewed and re-contact is made for clarification of any inconsistencies or changes in their responses. Measurement error is considered the most important source of error in the statistics as a result of the relatively complex concepts involved in R&D statistics which respondents are required to report on. For large enterprises with large and complex operations there is sometimes a difficulty distiguishing the R&D activites from their other activities such as innovation. |
|||
|
||||||||||||||||||||||||||||||||||||||||||||||||||||||||||||||||||||||||||||||||||||
| 12.1. Relevance - User Needs | ||||||||||||||||||||||||||||||||||||||||||||||||||||||||||||||||||||||||||||||||||||
See below. |
||||||||||||||||||||||||||||||||||||||||||||||||||||||||||||||||||||||||||||||||||||
| 12.1.1. Needs at national level | ||||||||||||||||||||||||||||||||||||||||||||||||||||||||||||||||||||||||||||||||||||
1) Users' class codification 1- Institutions: 2- Social actors: Employers’ associations, trade unions, lobbies, among others, at the European, national or regional level. 3- Media: International or regional media – specialized or for the general public – interested both in figures and analyses or comments. The media are the main channels of statistics to the general public. 4- Researchers and students (Researchers and students need statistics, analyses, ad hoc services, access to specific data.) 5- Enterprises or businesses (Either for their own market analysis, their marketing strategy (large enterprises) or because they offer consultancy services) 6- Other (User class defined for national purposes, different from the previous classes. ) |
||||||||||||||||||||||||||||||||||||||||||||||||||||||||||||||||||||||||||||||||||||
| 12.2. Relevance - User Satisfaction | ||||||||||||||||||||||||||||||||||||||||||||||||||||||||||||||||||||||||||||||||||||
The views and opinions from users are primarily collected through the User council for statistics on research and development which meets twice yearly. The user council consists of representatives from the Ministry of Enterprise, the Ministry of Education, the Swedish Higher Education Authority, the Swedish Research Council, Vinnova (Sweden's innovation agency), RISE, the Swedish Association of Local Authorities and Regions, the Swedish Agency for Growth Policy Analysis, the Research Institute of Industrial Economics, Lund University and Teknikföretagen (the trade association for the Swedish industry sector). Minutes from the last meeting of the user council are available in Swedish at Statistics Sweden's website. |
||||||||||||||||||||||||||||||||||||||||||||||||||||||||||||||||||||||||||||||||||||
| 12.2.1. National Surveys and feedback | ||||||||||||||||||||||||||||||||||||||||||||||||||||||||||||||||||||||||||||||||||||
|
||||||||||||||||||||||||||||||||||||||||||||||||||||||||||||||||||||||||||||||||||||
| 12.3. Completeness | ||||||||||||||||||||||||||||||||||||||||||||||||||||||||||||||||||||||||||||||||||||
All content requirements are regulated by the Commission Implementing Regulation (EU) No 2020/1197 of 30 July 2020. No additional national regulation regarding the content of R&D statistics exist. Data is available on all mandatory variables and breakdowns as well as some data that is requested on a voluntary basis. The completeness of the R&D statistics concerning the Business Enterprise sector is therefore deemed good. |
||||||||||||||||||||||||||||||||||||||||||||||||||||||||||||||||||||||||||||||||||||
| 12.3.1. Data completeness - rate | ||||||||||||||||||||||||||||||||||||||||||||||||||||||||||||||||||||||||||||||||||||
721 of 721 mandatory cells. 541 of 852 optional cells = approx. 63 percent. |
||||||||||||||||||||||||||||||||||||||||||||||||||||||||||||||||||||||||||||||||||||
| 12.3.2. Completeness - overview | ||||||||||||||||||||||||||||||||||||||||||||||||||||||||||||||||||||||||||||||||||||
Completeness is assessed via comparison of the data delivered against the requirements of Commission Implementing Regulation (EU) No 2020/1197.
Criteria: A) Obligatory data. Only 'Very Good' = 100%, Poor' >95%; 'Very Poor' <100% apply. B) Optional data. 'Very Good' = 100%; 'Good' = >75%; 'Satisfactory' 50 to 75%%; 'Poor' 25 to 50%; 'Very Poor' 0 to 25%. |
||||||||||||||||||||||||||||||||||||||||||||||||||||||||||||||||||||||||||||||||||||
| 12.3.3. Data availability | ||||||||||||||||||||||||||||||||||||||||||||||||||||||||||||||||||||||||||||||||||||
See below. |
||||||||||||||||||||||||||||||||||||||||||||||||||||||||||||||||||||||||||||||||||||
| 12.3.3.1. Data availability - R&D Expenditure | ||||||||||||||||||||||||||||||||||||||||||||||||||||||||||||||||||||||||||||||||||||
1) Y-start year, N – data not available |
||||||||||||||||||||||||||||||||||||||||||||||||||||||||||||||||||||||||||||||||||||
| 12.3.3.2. Data availability - R&D Personnel (HC) | ||||||||||||||||||||||||||||||||||||||||||||||||||||||||||||||||||||||||||||||||||||
1) Y-start year, N – data not available |
||||||||||||||||||||||||||||||||||||||||||||||||||||||||||||||||||||||||||||||||||||
| 12.3.3.3. Data availability - R&D Personnel (FTE) | ||||||||||||||||||||||||||||||||||||||||||||||||||||||||||||||||||||||||||||||||||||
1) Y-start year, N – data not available |
||||||||||||||||||||||||||||||||||||||||||||||||||||||||||||||||||||||||||||||||||||
| 12.3.3.4. Data availability - other | ||||||||||||||||||||||||||||||||||||||||||||||||||||||||||||||||||||||||||||||||||||
1) This question is optional. It refers to variables and breakdowns NOT asked by the Commission Implementing Regulation (EU) No 2020/1197 (neither as 'optional'), if R&D data for BES are collected for additional breakdowns or/and at more detailed level than requested. 2) Y-start year |
||||||||||||||||||||||||||||||||||||||||||||||||||||||||||||||||||||||||||||||||||||
|
||||||||||||||||||||||||||||||||||||||||||||||||||||||||||||
| 13.1. Accuracy - overall | ||||||||||||||||||||||||||||||||||||||||||||||||||||||||||||
Accuracy in the statistical sense denotes the closeness of computations or estimates to the exact or true values. Statistics are not equal with the true values because of variability (the statistics change from implementation to implementation of the survey due to random effects) and bias (the average of the possible values of the statistics from implementation to implementation is not equal to the true value due to systematic effects).
Several types of statistical errors occur during the survey process. The following typology of errors has been adopted: 1. Sampling errors. These only affect sample surveys. They are due to the fact that only a subset of the population, usually randomly selected, is enumerated. 2. Non-sampling errors. Non-sampling errors affect sample surveys and complete enumerations alike and comprise: a) Coverage errors, b) Measurement errors, c) Non response errors and d) Processing errors.
Model assumption errors should be treated under the heading of the respective error they are trying to reduce. |
||||||||||||||||||||||||||||||||||||||||||||||||||||||||||||
| 13.1.1. Accuracy - Overall by 'Types of Error' | ||||||||||||||||||||||||||||||||||||||||||||||||||||||||||||
1) Ranking of the type(s) of errors that result in over/under-estimation, from the most important source of error (1) to the least important source of error (5). In the event that errors of a particular type do not exist, is used the sign ‘-‘. 2) The perceived direction of the ‘overall’ error using the signs “+” for over estimation, “-” for under estimation and “+/-” when assumption of the direction of the error cannot be made for R&D. |
||||||||||||||||||||||||||||||||||||||||||||||||||||||||||||
| 13.1.2. Assessment of the accuracy with regard to the main indicators | ||||||||||||||||||||||||||||||||||||||||||||||||||||||||||||
1) 'Very Good' = High level of coverage (annual rate of substitution in the target population lower than 5%). High average rates of response (>80%) in census and sample surveys (BES R&D). Full data consistency with reference to totals and relationships between variables in the dataset sent to Eurostat. 2) 'Good' = In the event that at least one out of the three criteria above described would not be fully met. 3) 'Satisfactory' = In the event that the average rate of response would be lower than 60% even by meeting the two remaining criteria. 4) 'Poor' = In the event that the average rate of response would be lower than 60% and at least one of the two remaining criteria would not be met. 5) 'Very Poor' = If all the three criteria are not met. |
||||||||||||||||||||||||||||||||||||||||||||||||||||||||||||
| 13.2. Sampling error | ||||||||||||||||||||||||||||||||||||||||||||||||||||||||||||
That part of the difference between a population value and an estimate thereof, derived from a random sample, which is due to the fact that only a subset of the population is enumerated. |
||||||||||||||||||||||||||||||||||||||||||||||||||||||||||||
| 13.2.1. Sampling error - indicators | ||||||||||||||||||||||||||||||||||||||||||||||||||||||||||||
The main indicator used to measure sampling errors is the coefficient of variation (CV). |
||||||||||||||||||||||||||||||||||||||||||||||||||||||||||||
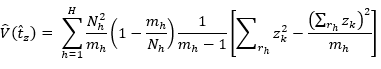
| 13.2.1.1. Variance Estimation Method | ||||||||||||||||||||||||||||||||||||||||||||||||||||||||||||
The variance is estimated using Horvitz-Thompson estimation as follows:
Where; tz is an estimated variable, h is an index for strata (h = 1, 2, 3,..., H), k is an index for observations (k = 1, 2, 3,..., K), zk is the observed value for the observation k, Nh is the number of objects in stratum h, mh is the number of responses in stratum h in the sample, and rh is the number of responses in stratum h
|
||||||||||||||||||||||||||||||||||||||||||||||||||||||||||||
| 13.2.1.2. Coefficient of variation for key variables by NACE | ||||||||||||||||||||||||||||||||||||||||||||||||||||||||||||
1) Industry sector (NACE Rev. 2: 01-03, 05-09, 10-33, 35, 36-39, 41-43) 2) Services sector (NACE Rev 2.: 45-47,49-53,55-56,58-63,64-66 68,69-75,77-82,84,85,86-88,90-93,94-96,97-98,99) |
||||||||||||||||||||||||||||||||||||||||||||||||||||||||||||
| 13.2.1.3. Coefficient of variation for key variables by Size Class | ||||||||||||||||||||||||||||||||||||||||||||||||||||||||||||
|
||||||||||||||||||||||||||||||||||||||||||||||||||||||||||||
| 13.3. Non-sampling error | ||||||||||||||||||||||||||||||||||||||||||||||||||||||||||||
Non-sampling errors occur in all phases of a survey. They add to the sampling errors (if present) and contribute to decreasing overall accuracy. It is important to assess their relative weight in the total error and devote appropriate resources for their control and assessment. |
||||||||||||||||||||||||||||||||||||||||||||||||||||||||||||
| 13.3.1. Coverage error | ||||||||||||||||||||||||||||||||||||||||||||||||||||||||||||
Coverage errors (or frame errors) are due to divergences between the target population and the frame population. The frame population is the set of target population members that has a chance to be selected into the survey sample. It is a listing of all items in the population from which the sample is drawn that contains contact details as well as sufficient information to perform stratification and sampling.
a) Description/assessment of coverage errors: The BES survey does not include enterprises with less than ten employees in the frame population. The only exceptions are enterprises in NACE 72 and research institutes. The coverage between the target population and the frame population overlaps to a high degree. The frame population is based on information from the Statistical Business Register, which cointains up to date data, and is established in November of the reference year. A few instances of over-coverage can occur where enterprises which did not have an avarage of ten employees, while also not belinging to NACE 72 or being a research institute, during the reference year are included in the frame. Under-coverage can occur if an enterprise are registered as active in the register after the frame has been established in November. Instances of over- and under-coverage are assumed to be minimal.
b) Measures taken to reduce their effect: Cases of over-coverage are mostly handled during the data collection period. These cases become known as respondents contact us regarding not meeting the criteria of ten or more employees, and subsequently the objects will be codes as over-coverage. For reference year 2021 eight enterprises of the sample proved to be non-eligeble. Enterprises which are registered in december of the reference year are not included in the frame.
|
||||||||||||||||||||||||||||||||||||||||||||||||||||||||||||
| 13.3.1.1. Over-coverage - rate | ||||||||||||||||||||||||||||||||||||||||||||||||||||||||||||
Known rate 0,01 %. |
||||||||||||||||||||||||||||||||||||||||||||||||||||||||||||
| 13.3.1.1.1. Over-coverage rate - groups | ||||||||||||||||||||||||||||||||||||||||||||||||||||||||||||
|
||||||||||||||||||||||||||||||||||||||||||||||||||||||||||||
| 13.3.1.2. Common units - proportion | ||||||||||||||||||||||||||||||||||||||||||||||||||||||||||||
Not requested. |
||||||||||||||||||||||||||||||||||||||||||||||||||||||||||||
| 13.3.1.3. Frame misclassification rate | ||||||||||||||||||||||||||||||||||||||||||||||||||||||||||||
Misclassification rate measures the percentage of enterprises that changed stratum between the time the frame was last updated and the time the survey was carried out. It is defined as the number of enterprises that changed stratum divided by the number of enterprises which belong to the stratum, according to the frame. The rate can be estimated based on the characteristics of the surveyed enterprises.
|
||||||||||||||||||||||||||||||||||||||||||||||||||||||||||||
| 13.3.2. Measurement error | ||||||||||||||||||||||||||||||||||||||||||||||||||||||||||||
Measurement errors occur during data collection and generate bias by recording values different than the true ones (e.g. difficulty to distinguish intramural from extramural R&D Expenditure). The survey questionnaire used for data collection may have led to the recording of wrong values, or there may be respondent or interviewer bias.
a) Description/assessment of measurement errors: Measurement errors are caused by the fact that the R&D definitions are complicated and that the time that respondents are willing to take to fill in the questionnaire is limited. A risk is that respondents have their own definitions of R&D (or their accounting system defiinition) in mind when answering, which may or may not correspond to the definitions provided in the questionnaire.
b) Measures taken to reduce their effect: Values are compared with corresponding values from previous survey years. There are a number of flags in the survey as well as in the internal tool used for evaluating the data, that are triggered by reported values too far from the correspondent value of the previous survey. A closer contact is kept with the largest companies, to try to make sure that they report in line with the Frascati definitions of R&D to the extent it is possible. |
||||||||||||||||||||||||||||||||||||||||||||||||||||||||||||
| 13.3.3. Non response error | ||||||||||||||||||||||||||||||||||||||||||||||||||||||||||||
Non-response occurs when a survey failed to collect data on all survey variables from all the population units designated for data collection in a sample or complete enumeration. There are two elements of non-response: - Unit non-response, which occurs when no data (or so little as to be unusable) are collected on a designated population unit. - Item non-response, which occurs when data only on some, but not all survey variables are collected on a designated population unit. The extent of response (and accordingly of non response) is also measured with response rates. |
||||||||||||||||||||||||||||||||||||||||||||||||||||||||||||
| 13.3.3.1. Unit non-response - rate | ||||||||||||||||||||||||||||||||||||||||||||||||||||||||||||
The main interest is to judge if the response from the target population was satisfying by computing the weighted and un-weighted response rate. |
||||||||||||||||||||||||||||||||||||||||||||||||||||||||||||
| 13.3.3.1.1. Unit non-response rates by Size Class | ||||||||||||||||||||||||||||||||||||||||||||||||||||||||||||
|
||||||||||||||||||||||||||||||||||||||||||||||||||||||||||||
| 13.3.3.1.2. Unit non-response rates by NACE | ||||||||||||||||||||||||||||||||||||||||||||||||||||||||||||
1) Industry (NACE Rev. 2: 01-03, 05-09,10-33,35,36-39,41-43) 2) Services (NACE Rev 2.: 45-47,49-53,55-56,58-63,64-66 68,69-75,77-82,84,85,86-88,90-93,94-96,97-98,99) |
||||||||||||||||||||||||||||||||||||||||||||||||||||||||||||
| 13.3.3.1.3. Recalls/Reminders description | ||||||||||||||||||||||||||||||||||||||||||||||||||||||||||||
In total there are two reminders sent by post to the enterprises. Close to the end of the data collection period a third, and last, reminder by email is sent. To important R&D performers reminders are sent by email closely following the second reminder. |
||||||||||||||||||||||||||||||||||||||||||||||||||||||||||||
| 13.3.3.1.4. Unit non-response survey | ||||||||||||||||||||||||||||||||||||||||||||||||||||||||||||
|
||||||||||||||||||||||||||||||||||||||||||||||||||||||||||||
| 13.3.3.2. Item non-response - rate | ||||||||||||||||||||||||||||||||||||||||||||||||||||||||||||
Definition: |
||||||||||||||||||||||||||||||||||||||||||||||||||||||||||||
| 13.3.3.2.1. Un-weighted item non-response rate | ||||||||||||||||||||||||||||||||||||||||||||||||||||||||||||
|
||||||||||||||||||||||||||||||||||||||||||||||||||||||||||||
| 13.3.3.3. Magnitude of errors due to non-response | ||||||||||||||||||||||||||||||||||||||||||||||||||||||||||||
|
||||||||||||||||||||||||||||||||||||||||||||||||||||||||||||
| 13.3.4. Processing error | ||||||||||||||||||||||||||||||||||||||||||||||||||||||||||||
Between data collection and the beginning of statistical analysis, data must undergo a certain processing: coding, data entry, data editing, imputation, etc. Errors introduced at these stages are called processing errors. Data editing identifies inconsistencies or errors in the data. |
||||||||||||||||||||||||||||||||||||||||||||||||||||||||||||
| 13.3.4.1. Identification of the main processing errors | ||||||||||||||||||||||||||||||||||||||||||||||||||||||||||||
|
||||||||||||||||||||||||||||||||||||||||||||||||||||||||||||
| 13.3.5. Model assumption error | ||||||||||||||||||||||||||||||||||||||||||||||||||||||||||||
Not applicable. |
||||||||||||||||||||||||||||||||||||||||||||||||||||||||||||
|
|||||||||||||||
| 14.1. Timeliness | |||||||||||||||
Timeliness and punctuality refer to time and dates, but in a different manner: the timeliness of statistics reflects the length of time between their availability and the event or phenomenon they describe. Punctuality refers to the time lag between the release date of the data and the target date on which they should have been delivered, with reference to dates announced in the official release calendar. |
|||||||||||||||
| 14.1.1. Time lag - first result | |||||||||||||||
Time lag between the end of reference period and the release date of the results:
a) End of reference period: 2021-12-31 b) Date of first release of national data: 2022-07-14 c) Lag (days): 195 |
|||||||||||||||
| 14.1.2. Time lag - final result | |||||||||||||||
a) End of reference period: 2021-12-31 b) Date of first release of national data: 2022-10-27 c) Lag (days): 300 |
|||||||||||||||
| 14.2. Punctuality | |||||||||||||||
Punctuality refers to the time lag between the release date of data and the target date on which they were scheduled for release as announced officially. |
|||||||||||||||
| 14.2.1. Punctuality - delivery and publication | |||||||||||||||
Punctuality of time schedule of data release = (Actual date of the data release) - (Scheduled date of the data release). Punctuality of time schedule of data release = 0 days.
|
|||||||||||||||
| 14.2.1.1. Deadline and date of data transmission | |||||||||||||||
|
|||||||||||||||
|
||||||||||||||||||||||||||||||||||||||||||||||||||||||||||||||||
| 15.1. Comparability - geographical | ||||||||||||||||||||||||||||||||||||||||||||||||||||||||||||||||
See below. |
||||||||||||||||||||||||||||||||||||||||||||||||||||||||||||||||
| 15.1.1. Asymmetry for mirror flow statistics - coefficient | ||||||||||||||||||||||||||||||||||||||||||||||||||||||||||||||||
Not requested. |
||||||||||||||||||||||||||||||||||||||||||||||||||||||||||||||||
| 15.1.2. General issues of comparability | ||||||||||||||||||||||||||||||||||||||||||||||||||||||||||||||||
Overall, international comparability is good. Divergences from FM are described in the following sections. |
||||||||||||||||||||||||||||||||||||||||||||||||||||||||||||||||
| 15.1.3. Survey Concepts Issues | ||||||||||||||||||||||||||||||||||||||||||||||||||||||||||||||||
The following table lists a number of key survey concepts and conceptual issues; it gives reference to the Commission Implementing Regulation (EU) No 2020/1197 or Frascati manual and EBS Methodological Manual on R&D Statistics paragraphs with recommendations about these concepts / issues.
|
||||||||||||||||||||||||||||||||||||||||||||||||||||||||||||||||
| 15.1.4. Deviations from recommendations | ||||||||||||||||||||||||||||||||||||||||||||||||||||||||||||||||
The following table lists a number of key methodological issues, which may affect the international comparability of national R&D statistics. The table gives the references in the Frascati manual, where related recommendations are made. Countries are asked to report on the existence of any deviations from existing recommendations and comment upon.
|
||||||||||||||||||||||||||||||||||||||||||||||||||||||||||||||||
| 15.2. Comparability - over time | ||||||||||||||||||||||||||||||||||||||||||||||||||||||||||||||||
See below. |
||||||||||||||||||||||||||||||||||||||||||||||||||||||||||||||||
| 15.2.1. Length of comparable time series | ||||||||||||||||||||||||||||||||||||||||||||||||||||||||||||||||
See below. |
||||||||||||||||||||||||||||||||||||||||||||||||||||||||||||||||
| 15.2.2. Breaks in time series | ||||||||||||||||||||||||||||||||||||||||||||||||||||||||||||||||
1) Breaks years are years for which data are not fully comparable to the previous period. |
||||||||||||||||||||||||||||||||||||||||||||||||||||||||||||||||
| 15.2.3. Collection of data in the even years | ||||||||||||||||||||||||||||||||||||||||||||||||||||||||||||||||
No data is collected during the even years. To produce estimates for totals intramural R&D expenditure and R&D personnel for even years, data from the innovation survey (CIS) is mainly used. For the enterprises ncluded in the R&D survey for reference year 2021 and in CIS 2020-2022 and have answered CIS, data from CIS is used for the object. In the R&D survey the enterprise is asked to forecast their R&D expenditure and number of R&D personnel (in FTE) for the even year. If the enterprise have not answered CIS by the time the estimates for even years are produced the forecasted data from the R&D survey is used. If the enterprise have not answered or is not included in the survey sample for CIS, and have not answered the questions about forecasted R&D activities for even years then the values for reference year 2021 are used (using a deflator). |
||||||||||||||||||||||||||||||||||||||||||||||||||||||||||||||||
| 15.3. Coherence - cross domain | ||||||||||||||||||||||||||||||||||||||||||||||||||||||||||||||||
This part deals with any national coherence assessments which may have been undertaken. It reports results for variables which are the same or relevant to R&D statistics, from other national surveys and / or administrative sources and explains and comments on their degree of agreement with R&D statistics. Intramural R & D expenditure (code 230101 in the Commission Implementing Regulation (EU) 2020/1197) and R & D personnel (code 230201) are surveyed also in foreign-controlled EU enterprises statistics (inward FATS). The Community innovation survey 2020 (CIS2020) (inn_cis12) (europa.eu) also collects the R&D expenditure of enterprises that form the coverage of the CIS2020 survey. |
||||||||||||||||||||||||||||||||||||||||||||||||||||||||||||||||
| 15.3.1. Coherence - sub annual and annual statistics | ||||||||||||||||||||||||||||||||||||||||||||||||||||||||||||||||
Not requested. |
||||||||||||||||||||||||||||||||||||||||||||||||||||||||||||||||
| 15.3.2. Coherence - National Accounts | ||||||||||||||||||||||||||||||||||||||||||||||||||||||||||||||||
Used as input to NA. |
||||||||||||||||||||||||||||||||||||||||||||||||||||||||||||||||
| 15.3.3. National Coherence Assessments | ||||||||||||||||||||||||||||||||||||||||||||||||||||||||||||||||
|
||||||||||||||||||||||||||||||||||||||||||||||||||||||||||||||||
| 15.3.4. Coherence – Foreign-controlled EU enterprises – inward FATS | ||||||||||||||||||||||||||||||||||||||||||||||||||||||||||||||||
The Swedish Agency for Growth Policy Analysis (Growth Analysis) is the agency responisble for FATS statistics. Statistics Sweden produces inward FATS statistics on behalf of Growth Analysis. Data from the regular R&D survey for the enterprise sector is the source used to compile inward FATS. I.e. no separate data collection for inward FATS takes place. |
||||||||||||||||||||||||||||||||||||||||||||||||||||||||||||||||
| 15.4. Coherence - internal | ||||||||||||||||||||||||||||||||||||||||||||||||||||||||||||||||
See below. |
||||||||||||||||||||||||||||||||||||||||||||||||||||||||||||||||
| 15.4.1. Comparison between preliminary and final data | ||||||||||||||||||||||||||||||||||||||||||||||||||||||||||||||||
This part compares key R&D variables as preliminary and final data.
|
||||||||||||||||||||||||||||||||||||||||||||||||||||||||||||||||
| 15.4.2. Consistency between R&D personnel and expenditure | ||||||||||||||||||||||||||||||||||||||||||||||||||||||||||||||||
(1) Calculate the average remuneration (cost) of individuals belonging to the internal R&D personnel, excluding those who are only formally ‘employees’ (university students, grant holders, etc.). (2) Calculate the average remuneration (cost) of individuals belonging to the external R&D personnel (FTEs/other current R&D costs for external R&D personnel). |
||||||||||||||||||||||||||||||||||||||||||||||||||||||||||||||||
|
|||||||||||||||||||||
The assessment of costs associated with a statistical product is a rather complicated task since there must exist a mechanism for appointing portions of shared costs (for instance shared IT resources and dissemination channels) and overheads (office space, utility bills etc). The assessment must become detailed and clear enough so that international comparisons among agencies of different structures are feasible. |
|||||||||||||||||||||
| 16.1. Costs summary | |||||||||||||||||||||
1) The shares of the figures given in the first column that are accounted for by payments to private firms or other Government agencies. |
|||||||||||||||||||||
| 16.2. Components of burden and description of how these estimates were reached | |||||||||||||||||||||
1) T = the time required to provide the information, including time spent assembling information prior to completing a form or taking part in interview and the time taken up by any subsequent contacts after receipt of the questionnaire (‘Re-contact time’) |
|||||||||||||||||||||
|
|||
| 17.1. Data revision - policy | |||
Statistics Sweden's revision policy covers three types of revisions: planned and reoccuring revisions, revisions due to conceptual and/or methodological changes and corrections. 1. Planned and reoccuring revisions - In order to accommodate user timeliness needs, Statistics Sweden publisch preliminary figures. These figures are then revised once or several times before final data are released. In case of planned revisions, users will be informed of the number of revisions as well as the revision dates. 2. Revisions due to conceptual and/or methodological changes - Methodological changes can have systematic effects on the statistics. Concepts, definitions or classifications can be changed in order to better capture the target variables. In case of such changes, and if deemed necessary and possible, revisions of earlier final data can be made in order to produce comparable time series. Users will be informed of revisions of this kind in advance, with an explanation of why the revision is necessary. 3. Corrections - In case of errors in published data, corrections can be made. When an error has been identified, the need for correction is evaluated without delay based on the magnitude of the error and the importance of the statistics. Corrections are always published in a clear and easily accessible manner, with information on why the correction is necessary. Annexes: Revision Policy (in English) |
|||
| 17.2. Data revision - practice | |||
Not requested. |
|||
| 17.2.1. Data revision - average size | |||
Not requested. |
|||
|
||||||||||||||||||||||||||||||||||||||||||||
| 18.1. Source data | ||||||||||||||||||||||||||||||||||||||||||||
Several separate activities are used for the collection of raw data or pre-compiled administrative data and statistics related to R&D. For simplicity, we call them surveys irrespective of whether they are sample surveys, censuses, collections of administrative data/pre-compiled statistics. This section presents the names of the surveys by sector of performance as well as methodological information for each survey. Depending on the type of survey and sector of performance, only the sections corresponding to that survey and sector are filled in. |
||||||||||||||||||||||||||||||||||||||||||||
| 18.1.1. Data source – general information | ||||||||||||||||||||||||||||||||||||||||||||
|
||||||||||||||||||||||||||||||||||||||||||||
| 18.1.2. Sample/census survey information | ||||||||||||||||||||||||||||||||||||||||||||
|
||||||||||||||||||||||||||||||||||||||||||||
| 18.1.3. Information on collection of administrative data or of pre-compiled statistics | ||||||||||||||||||||||||||||||||||||||||||||
|
||||||||||||||||||||||||||||||||||||||||||||
| 18.2. Frequency of data collection | ||||||||||||||||||||||||||||||||||||||||||||
See 12.3.3. |
||||||||||||||||||||||||||||||||||||||||||||
| 18.3. Data collection | ||||||||||||||||||||||||||||||||||||||||||||
See below. |
||||||||||||||||||||||||||||||||||||||||||||
| 18.3.1. Data collection overview | ||||||||||||||||||||||||||||||||||||||||||||
|
||||||||||||||||||||||||||||||||||||||||||||
| 18.3.2. Questionnaire and other documents | ||||||||||||||||||||||||||||||||||||||||||||
Annexes: R&D in Business Enterprise sector 2021 (English) R&D in Business Enterprise sector 2021 (in Swedish) Methodological documentation (in Swedish) |
||||||||||||||||||||||||||||||||||||||||||||
| 18.4. Data validation | ||||||||||||||||||||||||||||||||||||||||||||
Severel measures are taken to ensure data validation. Data validation are done both at a micro and macro level. Micro validation measures consists of internal and external controls in the questionnaires to check for any reporting inconsistencies, and individual examination of large R&D performers reports. Respondents are re-contacted to verify or correct changes or supplement any missing data in the reporting. Data validation on a macro level consists of evaluating macrodata, totals and by requested breakdowns, comparing against previous years and to detect any outliers that needs to be handled. |
||||||||||||||||||||||||||||||||||||||||||||
| 18.5. Data compilation | ||||||||||||||||||||||||||||||||||||||||||||
See below. |
||||||||||||||||||||||||||||||||||||||||||||
| 18.5.1. Imputation - rate | ||||||||||||||||||||||||||||||||||||||||||||
No imputation rate available. |
||||||||||||||||||||||||||||||||||||||||||||
| 18.5.1.1. Imputation rate (un-weighted) (%) by Size class | ||||||||||||||||||||||||||||||||||||||||||||
|
||||||||||||||||||||||||||||||||||||||||||||
| 18.5.1.2. Imputation rate (un-weighted) (%) by NACE | ||||||||||||||||||||||||||||||||||||||||||||
1) Industry (NACE Rev. 2: 01-03, 05-09,10-33,35,36-39,41-43) 2) Services (NACE Rev 2.: 45-47, 49-53, 55-56, 58-63, 64-66 68, 69-75, 77-82, 84, 85, 86-88, 90-93, 94-96, 97-98, 99)
|
||||||||||||||||||||||||||||||||||||||||||||
| 18.5.2. Data compilation methods | ||||||||||||||||||||||||||||||||||||||||||||
|
||||||||||||||||||||||||||||||||||||||||||||
| 18.5.3. Measurement issues | ||||||||||||||||||||||||||||||||||||||||||||
|
||||||||||||||||||||||||||||||||||||||||||||
| 18.5.4. Weighting and estimation methods | ||||||||||||||||||||||||||||||||||||||||||||
|
||||||||||||||||||||||||||||||||||||||||||||
| 18.6. Adjustment | ||||||||||||||||||||||||||||||||||||||||||||
Not requested. |
||||||||||||||||||||||||||||||||||||||||||||
| 18.6.1. Seasonal adjustment | ||||||||||||||||||||||||||||||||||||||||||||
Not applicable. |
||||||||||||||||||||||||||||||||||||||||||||
|
|||
|
|||
|
|||