Reference metadata describe statistical concepts and methodologies used for the collection and generation of data. They provide information on data quality and, since they are strongly content-oriented, assist users in interpreting the data. Reference metadata, unlike structural metadata, can be decoupled from the data.
Eurostat, the statistical office of the European Union
1.2. Contact organisation unit
C3: Statistics for administrative purposes
1.3. Contact name
Ian Dennis
1.4. Contact person function
Confidential because of GDPR
1.5. Contact mail address
2920 Luxembourg LUXEMBOURG
1.6. Contact email address
Confidential because of GDPR
1.7. Contact phone number
Confidential because of GDPR
1.8. Contact fax number
Confidential because of GDPR
2.1. Metadata last certified
11 April 2017
2.2. Metadata last posted
11 April 2017
2.3. Metadata last update
29 September 2022
3.1. Data description
Correction coefficients (Extra-EU) are used to ensure equality of purchasing power of remuneration between different locations outside the European Union and Brussels.
Correction coefficients are calculated as the ratio between the "economic parity" and the exchange rate to the Euro (where applicable). They operate as a percentage adjustment to remuneration expressed in local currency.
As the correction coefficient is simply the economic parity divided by the exchange rate, it can be seen that the exchange rate effect cancels out and the economic parity is the appropriate conversion rate to convert amounts expressed in local currency into Euro and eliminate the effect of price level differences.
The economic parity tells us how many currency units a given quantity of goods and services costs in different duty station locations..
The method used to establish economic parities is to compare the price of a basket of goods and services purchased by the average international official in Brussels with the price of an equivalent basket of goods and services purchased by the average international official in each of the other duty stations.
To compile these prices, Eurostat carry out a number of detailed price surveys in cooperation with the United Nations International Civil Service Commission and the International Section on Remuneration and Prices of the Coordinated Organisations.
For each item, the price ratio with Brussels is computed. Similar items are grouped into "basic headings", and a geometric mean of the price ratios is calculated to establish a basic heading parity. These basic heading parities are then aggregated to produce an overall parity. This aggregate is computed as a weighted arithmetic mean, using consumption expenditure pattern of international officials as weights.
3.2. Classification system
The tables presented here show correction coefficients for duty stations at the level of the overall aggregate (ie. total consumption) excluding rent.
Information at more detailed level is published in the Annual Remuneration Report.
The overall list of products and services priced in the detailed surveys contains about 3000 items. These items are classified according to the standard "Classification Of Individual COnsumption by Purpose" (COICOP), which has been adopted as a national accounts classification for consumer expenditure since 1999 and is also used for the Harmonised Index of Consumer Prices (HICP).
According to COICOP, goods and services are broken down into 12 main groups, each of which is broken down into sub-groups, which in turn are broken down into more detailed groups.
For the calculation of correction coefficients, the classification comprises 80 basic headings. The basic heading is the lowest level of aggregation, at which products are sampled and product prices collected. Below the basic heading level are the individual items of the product sample. For example, cheese is a basic heading and cheddar, camembert, feta, gorgonzola, gouda, etc. are individual products within it.
These 80 basic headings are the same as the ones used for the similar correction coefficients (duty stations) in the European Union. Prior to 2015 the classification comprised 57 basic headings, deliberately excluding accommodation rent, healthcare and education.
3.3. Coverage - sector
Correction coefficients are calculated to adjust the remuneration of international officials, but may also be suitable for other uses.
3.4. Statistical concepts and definitions
See also section 18.1
a) Bilateral economic parities
In their simplest form economic parities are price relatives that show the ratio of the prices in national currencies of the same good or service in different countries. For example, if the price of a hamburger in Brussels is 3.11 Euros and in New York the price is 2.94 Dollars, then the parity for hamburgers between New York and Brussels is 2.94 Dollars to 3.11 Euros, or 0.9453 Dollars to the Euro. This means that for every Euro spent on hamburgers in Brussels, 0.9453 Dollars would have to be spent in New York to obtain the same quantity and quality - or, in other words, the same volume - of hamburgers.
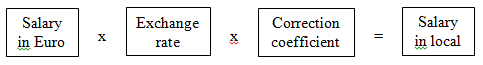
If hamburgers were the only item of consumption in the basket of goods and services, then to ensure equivalent purchasing power of the Euro remuneration of a Brussels-based international official when working in New York, the remuneration should either be converted into Dollars using the economic parity directly - or the remuneration should be multiplied by the exchange rate between the Euro and the Dollar and then multiplied by the correction coefficient.
In practice the parity at the level of the overall aggregate refers to a complex assortment of goods and services. Thus, if the total parity (ie. the parity for total remuneration) between New York and Brussels is 0.9453 Dollars to the Euro, it can be inferred that for every Euro received and spent in Brussels, 0.9453 Dollars would have to be spent in New York to purchase the same volume of goods and services. Purchasing the same volume of goods and services does not mean that baskets of goods and services will necessarily be exactly identical in both countries. The exact composition of the baskets will vary to reflect differences in tastes and cultural backgrounds, but both baskets will, in principle, provide equivalent satisfaction or utility.
b) Consumer goods and services
Survey price data for countries participating in the Joint Eurostat-OECD comparison programme is compiled in accordance with Regulation 1445/2007 and the Eurostat-OECD manual on purchasing power parities.
Survey price data for remaining countries is compiled by the United Nations International Civil Service Commission in accordance with their approved methodology.
Updating price indices are obtained from national statistical institutes.
c) Housing
Housing costs are excluded. This is because specific accommodation arrangements are put in place for expatriate international officials outside the European Union.
d) Education and Healthcare
For countries participating in the Joint Eurostat-OECD comparison programme coordinated by Eurostat, the same approach is taken as for Intra-EU duty stations; when coordinated by OECD, a specific approach is taken.
Survey price data for remaining countries is compiled by the United Nations
International Civil Service Commission in accordance with their approved methodology.
e) Consumption expenditure patterns
These are established on the basis of direct household expenditure surveys ("family budget surveys") conducted at periodic intervals amongst international officials. The average result for each duty station is established as the consumption pattern until the next survey. Where the population of international officials is particularly small or mobile or response rates are particularly low, such that a reliable structure cannot be established, a regional pool weight may instead be applied, or data shared by partner organisations may be used.
3.5. Statistical unit
Correction coefficients (Extra-EU) are established for the specific duty station location.
For countries participating in the Joint Eurostat-OECD comparison programme, the classification of retail outlets used in the European Comparison Programme applies for pricing purposes. Survey price data for remaining countries is compiled by the United Nations International Civil Service Commission in accordance with their approved methodology.
For consumption expenditure patterns, the households of individual international officials.
3.6. Statistical population
Pricing samples are selected from the full market of goods and services.
Consumption expenditure survey participants are selected from the total population of international officials.
3.7. Reference area
Correction coefficients (Extra-EU) are established for the duty station cities, which are generally the capital cities of the countries concerned. In addition they are established for selected locations in Bosnia-Herzegovina (Banja Luka), Indonesia (Banda Aceh), Switzerland (Geneva) and United States of America (New York).
The Staff Regulations set out specific rules for the creation, and cancellation, of duty station locations for which a specific correction coefficient applies. For any other duty stations within the Member State, the capital city value applies.
3.8. Coverage - Time
Correction coefficients (Extra-EU) have been calculated since 1989; they are presented in the tables with effect from 2000.
3.9. Base period
Not applicable
Correction coefficients (Extra-EU) are expressed as a percentage.
The correction coefficients are the mathematical ratio between the economic parity and the exchange rate. Parities and exchange rates express the number of currency units per Euro.
Correction coefficients (duty stations) are updated yearly with reference to June (1st July).
Updating calculations are done each month to identify any duty stations where the movement since the preceding value in force exceeds a threshold specified in the Staff Regulations.
6.1. Institutional Mandate - legal acts and other agreements
Article 64 and Annex X and Annex XI of the Staff Regulations (Council Regulation EEC, Euratom, ECSC No 259/68 of 29 February 1968) as subsequently amended. Important amendments during the period for which time series data is presented in the tables include:
Legislation 1991-2003 (Council Regulation No 3830/1991)
Legislation 2004-2012 (Council Regulation No 723/2004)
Legislation 2013- (Council Regulation No 1023/2013)
Common rules for the provision of basic information (input data), the calculation and dissemination of parities are laid down in Regulation EC No 1445/2007 of the European Parliament and of the Council of 11 December 2007.
With effect from 2014 the European Statistics Code of Practice applies for work on correction coefficients. It sets the standard for developing, producing and disseminating European statistics, building upon a common definition of quality in statistics.
Specific methodologies and publication policies are decided by the Expert Working Group on Articles 64 & 65 of the Staff Regulations which meets annually in Luxembourg.
6.2. Institutional Mandate - data sharing
The input data is compiled and validated in collaboration with the International Service for Remuneration and Pensions of the Coordinated Organisations (NATO, OECD, CoE, ESA, ECMWF, METSAT) and the United Nations International Civil Service Commission under the terms of an international memorandum of understanding signed in 2009.
7.1. Confidentiality - policy
Regulation (EC) No 223/2009 on European statistics (recital 24 and Article 20(4)) of 11 March 2009 (OJ L 87, p. 164), stipulates the need to establish common principles and guidelines ensuring the confidentiality of data used for the production of European statistics and the access to those confidential data with due account for technical developments and the requirements of users in a democratic society.
7.2. Confidentiality - data treatment
The Joint Eurostat-OECD comparison programme is a multilateral statistical undertaking, in which the quality of each country's results is depending on all the other participating countries as well as on its own data. It is therefore important that input data is available for validation purposes to all participating national statistical institutes. However, only average prices and selected additional information per country are made available, not the entire price material as collected by each national statistical institute.
Data for remaining countries is compiled by the United Nations International Civil Service Commission in accordance with their approved methodology
Information compiled during household surveys is strictly anonymous.
8.1. Release calendar
No release calendar
8.2. Release calendar access
not available
8.3. Release policy - user access
In line with the Community legal framework and the European Statistics Code of Practice Eurostat disseminates European statistics on Eurostat's website (see item 10 - 'Accessibility and clarity') respecting professional independence and in an objective, professional and transparent manner in which all users are treated equitably. The detailed arrangements are governed by the Eurostat protocol on impartial access to Eurostat data for users.
Yearly
10.1. Dissemination format - News release
None
Following transmission of the Eurostat Annual Remuneration Report or the Eurostat Intermediate Remuneration Report (if applicable), and completion of internal administrative procedures, the Commission publishes a summary in the Official Journal of the European Union.
10.2. Dissemination format - Publications
In accordance with the Staff Regulations, an Annual Remuneration Report is prepared by 31st October each year, including the update figures for correction coefficients (Extra-EU) as at June (1st July).
A first Intermediate Remuneration Report is produced as soon as possible each year for the period July-January, including updated figures for any duty stations where the monthly movement since the last value in force exceeds a threshold specified in the Staff Regulations.
A second Intermediate Remuneration Report is produced as soon as possible each year for the period February-June, including updated figures for any duty stations where the monthly movement since the last value in force exceeds a threshold specified in the Staff Regulations.
The detailed reports are made available to Member State delegates in the Expert Working Group on Articles 64 & 65 of the Staff Regulations.
Statistics Explained articles.
Dedicated Section
10.3. Dissemination format - online database
The correction coefficients domain of Eurostat's database can be accessed under "Economy and finance" - "Prices" - "Correction coefficients" (prc_colc).
Figures are made available following transmission of the Annual Remuneration Report.
10.4. Dissemination format - microdata access
Results below the level of the total are generally not disseminated to the general public.
10.5. Dissemination format - other
None
10.6. Documentation on methodology
The latest version of the "Methodological manual for the calculation of Extra-EU correction coefficients" is available online (see Annex at the bottom of this page).
10.7. Quality management - documentation
All countries in the Joint Eurostat-OECD Comparison Programme which are coordinated by Eurostat produce detailed inventories of the data sources and methods applied in the provision of basic data. In addition, countries provide quality reports ("survey reports") to Eurostat following the finalisation of each consumer price survey.
These reports are intended for internal use among the participants, and serve primarily the preparation of forthcoming surveys.
Quality reports ("survey reports") are produced by the United Nations International Civil Service Commission after each price survey.
11.1. Quality assurance
All basic data provided by participating countries in the Joint Eurostat-OECD Comparison Programme which are coordinated by Eurostat undergo a detailed bilateral and multilateral validation process, described in detail in the Methodological manual on purchasing power parities (see 10.6).
Calculations at aggregate level are done by Eurostat. Insofar as possible they are cross-checked for consistency with calculations done separately according to the specific methodology of the International Service for Remuneration and Pensions of the Coordinated Organisations, and the specific methodology of the United Nations International Civil Service Commission.
11.2. Quality management - assessment
The inventories produced by the countries, as mentioned under 10.7, are used by Eurostat for in-depth assessment of the countries' sources and methods, in line with Regulation 1445/2007. The outcome of these assessments are released on Eurostat's website.
12.1. Relevance - User Needs
Correction coefficients (Extra-EU) are used to adjust the remuneration of officials and other servants of the European Union who are working outside the European Union.
A number of other international organisations and certain Member State foreign affairs ministries apply these coefficients for adjustment of remuneration of their expatriate staff.
The information is made available publicly to allow other organisations to satisfy their needs as well.
Some users typically request data at a more detailed level than is currently authorised for publication either in the online database or in the detailed reports. Changing procedures to better accommodate such needs would require considerable modification to the existing methodology and organisation of the exercise, and is not feasible.
12.2. Relevance - User Satisfaction
A "Rolling Review" on the European Comparison Programme was carried out in 2010 in the context of Eurostat’s Quality Assurance Framework. The Rolling Review consisted of a survey among users, a survey among partners (mainly the National Statistical Institutes) and a self-assessment by Eurostat.
The work of the United Nations International Civil Service Commission is subject to continuous review by an "Advisory Committee for Post Adjustment Questions" made up of international experts.
A formal review of A64 Extra-EU correction coefficients was carried out in 2010 and updated in 2021. This included informal contact with users, lessons drawn from partners (mainly the United Nations International Civil Service Commission) and a self-assessment by Eurostat. End-users and data partners are consulted annually regarding data quality.
12.3. Completeness
Correction coefficients (Extra-EU) are calculated and published for all the defined locations, unless prevented by prevailing conditions (eg. war).
13.1. Accuracy - overall
The precision of parities, and therefore the precision of correction coefficients, increases with the level of aggregation. This means that the parity at the level of total household consumption will be more reliable, or precise, than the parity for "food and non-alcoholic beverages" which is one of the sub-aggregates of final household consumption (12 main COICOP groups). Similarly, the parity for "food and non-alcoholic beverages" will be more reliable than the parity for "bread and cereals" which is one of the analytical categories within that COICOP group.
The input data into the parity calculation process comes from several sources, specifically, from special price surveys of consumer goods and services, and special surveys of household consumption expenditure. This makes it impossible to calculate any meaningful, numerical measure of error margins for parities.
13.2. Sampling error
Not applicable
13.3. Non-sampling error
In the consumer goods price surveys, measurement errors can potentially occur due to non-compliance with the strict definition of the products in the product sample, for instance with regard to package sizes or quality parameters. While the validation process aims at eliminating these errors by carefully comparing the price material provided by each country and evaluating its plausibility, some of these errors can be hard to identify, especially those related to quality.
While non-response from one particular statistical unit can usually be easily overcome by replacing that unit, and normally has a very limited impact at the level of the published categories anyway, a special problem does occur where no prices are available for a given item in Brussels or in the duty station. In these cases, a price relative is imputed on the basis of the price relatives for other items. If a country does not report prices for any sample product in a given basic heading, the gaps are typically filled using the parity of either a "similar" basic heading, or of a hierarchical category.
14.1. Timeliness
Correction coefficients for June (1st July) are published in autumn of the same year.
Correction coefficients for intervening months are published when a change is implemented in accordance with the "5% rule" set out in the Staff Regulations. Intermediate reports are published in spring (for the reference months 1st July - 1st January) and in autumn (for the reference months 1st February - 1st June)
14.2. Punctuality
Eurostat is required by the Staff Regulations to deliver its Annual Remuneration Report by the end of October.
15.1. Comparability - geographical
Correction coefficients are specifically designed as spatial price level indicators, and the comparability of the results across countries can be assumed to be very good.
15.2. Comparability - over time
Correction coefficients are designed to compare price levels for different geographical locations at the same point in time. Temporal consumer price indices on the other hand are designed to compare price levels for the same geographical location at different points in time. This difference has important implications for the way in which items are selected and defined, and other aspects of methodology. It is conceivable that two successive calculations of correction coefficients may use quite different samples and methodologies, if this is considered necessary to produce a spatial comparison of improved quality. Unfortunately, no indicator exists that simultaneously captures spatial and temporal aspects in an adequate manner. Clearly a degree of care is therefore required when interpreting the temporal development of correction coefficients.
15.3. Coherence - cross domain
For locations within the European Union, Eurostat publishes a variety of different price level indicators, each designed to satisfy particular user needs. As methodologies and data sources vary, so the magnitude and direction of change identified by these indicators can differ. The following is a non-exhaustive list:
Correction coefficients (duty stations) compare the bilateral price level of duty stations with Brussels.
Correction coefficients (countries) compare the bilateral price level of Member States with Belgium.
Purchasing power parities calculated using the multilateral EKS formula compare the price level of Member States relative to the EU average.
Harmonised indices of consumer prices measure the temporal change in prices within each Member State.
15.4. Coherence - internal
Not applicable
Correction coefficients (Extra-EU) make maximum use of data already compiled from the European Comparison Programme and the Harmonised Indices of Consumer Prices, or compiled by partner organisations. Minimal additional response burden is created.
17.1. Data revision - policy
For this domain, the Methodological manual for the calculation of Extra-EU correction coefficients further specifies the general Eurostat revision policy.
17.2. Data revision - practice
Data are only published once they are deemed to be sufficiently complete for all data providers.
New data are only used to update disseminated data if provided according to the provision schedule set by Eurostat, or, under highly specific circumstances, in the case of reported errors.
Reported errors that are deemed to be significant may be corrected in the disseminated data during a period of six months after dissemination, in line with the principles set out below.
Principles for corrections prior to or following publication of the Eurostat Report
With the information contained in the Eurostat report which is submitted to the European Parliament and the Council in October of year t, the Commission updates by the end of the year the remuneration of officials of the European Communities with effect from July of the year t. At some stage during or after this process it is conceivable that an error may be identified either by Eurostat or by a Member State. Such errors must be officially communicated. This then raises budgetary and administrative questions about whether/how to adjust such corrections retrospectively. The Staff Regulations themselves impose no limit on retrospective adjustment. However, to limit the practical and financial burdens, a gentleman's agreement was adopted in January 2005. This policy foresees revisions in the following circumstances:
If identified prior to publication, the Eurostat Report will be revised and a new report will be submitted to the European Parliament and the Council.
For a period of six months after the publication of this update (i.e. until the end of June t+1) there is a possibility to start a revision of the adjustment (which can result in a retroactive correction).
After this six-month period, data for year t are considered as final.
18.1. Source data
Survey prices for consumer goods and services are obtained from the Joint Eurostat-OECD Comparison Programme or from the United Nations International Civil Service Commission.
These prices are updated until the next survey of the same type using the detailed subindices of the official national Indices of Consumer Prices, or the best available alternative.
For countries participating in the Joint Eurostat-OECD Comparison Programme which are coordinated by Eurostat, item samples are determined by Eurostat in collaboration with Member States and the OECD. The final selection should be comprised of comparable items and, to the largest extent possible, be equally representatives of the consumption expenditure patterns in participant countries. Subsequent data collection is conducted by national statistical institutes.
Expenditure weights for aggregation purposes are obtained from periodic surveys conducted amongst international officials.
18.2. Frequency of data collection
In order to reduce the response burden, there is a three year rolling cycle of surveys in the Joint Eurostat-OECD Comparison Programme. This cycle covers the whole basket of goods and services, with two surveys organised each year.
For similar practical reasons, the price surveys conducted by the United Nations International Civil Service Commission are organised on a cycle of 5 years, with each location being visited at least once during this period.
Household budget surveys are conducted at intervals of between 5-7 years.
18.3. Data collection
Prices are compiled from appropriate retail outlets, mainly through physical visits. For some items, questionnaires, telephone calls, internet surveys and scanner data are used. Within the general framework laid down in the Joint Eurostat-OECD Comparison Programme, national statistical institutes have a degree of freedom as to how to conduct the data collection.
Prices are mainly compiled by the United Nations Civil Service Commission through physical visits, however for an important subset of items "real-time" pricing is used with information being compiled from internet surveys and direct contact with retailers.
Household budget surveys are conducted using an online questionnaire developed in collaboration with partner international organisations. Where adequate population data is available, results from surveys of household expenditure ("family budget surveys") are calibrated ex post to fit the population distribution.
18.4. Data validation
For countries participating in the Joint Eurostat-OECD Comparison Programme, the validation of input data is an interactive process between Eurostat or OECD and the national statistical institutes.
Data compiled by the United Nations International Civil Service Commission is subject to a comprehensive validation process.
18.5. Data compilation
The calculation of the overall parity involves three stages.
a) At the level of each individual item, price observations are averaged (simple arithmetic mean). These average prices are then used to calculate a price ratio relative to Brussels.
b) At the basic heading level, the price ratios for all items in that group are averaged (simple geometric mean).
c) Finally, the basic heading parities are aggregated (weighted arithmetic mean) using the basic heading expenditure weights.
Correction coefficients (Extra-EU) are used to ensure equality of purchasing power of remuneration between different locations outside the European Union and Brussels.
Correction coefficients are calculated as the ratio between the "economic parity" and the exchange rate to the Euro (where applicable). They operate as a percentage adjustment to remuneration expressed in local currency.
As the correction coefficient is simply the economic parity divided by the exchange rate, it can be seen that the exchange rate effect cancels out and the economic parity is the appropriate conversion rate to convert amounts expressed in local currency into Euro and eliminate the effect of price level differences.
The economic parity tells us how many currency units a given quantity of goods and services costs in different duty station locations..
The method used to establish economic parities is to compare the price of a basket of goods and services purchased by the average international official in Brussels with the price of an equivalent basket of goods and services purchased by the average international official in each of the other duty stations.
To compile these prices, Eurostat carry out a number of detailed price surveys in cooperation with the United Nations International Civil Service Commission and the International Section on Remuneration and Prices of the Coordinated Organisations.
For each item, the price ratio with Brussels is computed. Similar items are grouped into "basic headings", and a geometric mean of the price ratios is calculated to establish a basic heading parity. These basic heading parities are then aggregated to produce an overall parity. This aggregate is computed as a weighted arithmetic mean, using consumption expenditure pattern of international officials as weights.
29 September 2022
See also section 18.1
a) Bilateral economic parities
In their simplest form economic parities are price relatives that show the ratio of the prices in national currencies of the same good or service in different countries. For example, if the price of a hamburger in Brussels is 3.11 Euros and in New York the price is 2.94 Dollars, then the parity for hamburgers between New York and Brussels is 2.94 Dollars to 3.11 Euros, or 0.9453 Dollars to the Euro. This means that for every Euro spent on hamburgers in Brussels, 0.9453 Dollars would have to be spent in New York to obtain the same quantity and quality - or, in other words, the same volume - of hamburgers.
If hamburgers were the only item of consumption in the basket of goods and services, then to ensure equivalent purchasing power of the Euro remuneration of a Brussels-based international official when working in New York, the remuneration should either be converted into Dollars using the economic parity directly - or the remuneration should be multiplied by the exchange rate between the Euro and the Dollar and then multiplied by the correction coefficient.
In practice the parity at the level of the overall aggregate refers to a complex assortment of goods and services. Thus, if the total parity (ie. the parity for total remuneration) between New York and Brussels is 0.9453 Dollars to the Euro, it can be inferred that for every Euro received and spent in Brussels, 0.9453 Dollars would have to be spent in New York to purchase the same volume of goods and services. Purchasing the same volume of goods and services does not mean that baskets of goods and services will necessarily be exactly identical in both countries. The exact composition of the baskets will vary to reflect differences in tastes and cultural backgrounds, but both baskets will, in principle, provide equivalent satisfaction or utility.
b) Consumer goods and services
Survey price data for countries participating in the Joint Eurostat-OECD comparison programme is compiled in accordance with Regulation 1445/2007 and the Eurostat-OECD manual on purchasing power parities.
Survey price data for remaining countries is compiled by the United Nations International Civil Service Commission in accordance with their approved methodology.
Updating price indices are obtained from national statistical institutes.
c) Housing
Housing costs are excluded. This is because specific accommodation arrangements are put in place for expatriate international officials outside the European Union.
d) Education and Healthcare
For countries participating in the Joint Eurostat-OECD comparison programme coordinated by Eurostat, the same approach is taken as for Intra-EU duty stations; when coordinated by OECD, a specific approach is taken.
Survey price data for remaining countries is compiled by the United Nations
International Civil Service Commission in accordance with their approved methodology.
e) Consumption expenditure patterns
These are established on the basis of direct household expenditure surveys ("family budget surveys") conducted at periodic intervals amongst international officials. The average result for each duty station is established as the consumption pattern until the next survey. Where the population of international officials is particularly small or mobile or response rates are particularly low, such that a reliable structure cannot be established, a regional pool weight may instead be applied, or data shared by partner organisations may be used.
Correction coefficients (Extra-EU) are established for the specific duty station location.
For countries participating in the Joint Eurostat-OECD comparison programme, the classification of retail outlets used in the European Comparison Programme applies for pricing purposes. Survey price data for remaining countries is compiled by the United Nations International Civil Service Commission in accordance with their approved methodology.
For consumption expenditure patterns, the households of individual international officials.
Pricing samples are selected from the full market of goods and services.
Consumption expenditure survey participants are selected from the total population of international officials.
Correction coefficients (Extra-EU) are established for the duty station cities, which are generally the capital cities of the countries concerned. In addition they are established for selected locations in Bosnia-Herzegovina (Banja Luka), Indonesia (Banda Aceh), Switzerland (Geneva) and United States of America (New York).
The Staff Regulations set out specific rules for the creation, and cancellation, of duty station locations for which a specific correction coefficient applies. For any other duty stations within the Member State, the capital city value applies.
Correction coefficients (duty stations) are updated yearly with reference to June (1st July).
Updating calculations are done each month to identify any duty stations where the movement since the preceding value in force exceeds a threshold specified in the Staff Regulations.
The precision of parities, and therefore the precision of correction coefficients, increases with the level of aggregation. This means that the parity at the level of total household consumption will be more reliable, or precise, than the parity for "food and non-alcoholic beverages" which is one of the sub-aggregates of final household consumption (12 main COICOP groups). Similarly, the parity for "food and non-alcoholic beverages" will be more reliable than the parity for "bread and cereals" which is one of the analytical categories within that COICOP group.
The input data into the parity calculation process comes from several sources, specifically, from special price surveys of consumer goods and services, and special surveys of household consumption expenditure. This makes it impossible to calculate any meaningful, numerical measure of error margins for parities.
Correction coefficients (Extra-EU) are expressed as a percentage.
The correction coefficients are the mathematical ratio between the economic parity and the exchange rate. Parities and exchange rates express the number of currency units per Euro.
The calculation of the overall parity involves three stages.
a) At the level of each individual item, price observations are averaged (simple arithmetic mean). These average prices are then used to calculate a price ratio relative to Brussels.
b) At the basic heading level, the price ratios for all items in that group are averaged (simple geometric mean).
c) Finally, the basic heading parities are aggregated (weighted arithmetic mean) using the basic heading expenditure weights.
Survey prices for consumer goods and services are obtained from the Joint Eurostat-OECD Comparison Programme or from the United Nations International Civil Service Commission.
These prices are updated until the next survey of the same type using the detailed subindices of the official national Indices of Consumer Prices, or the best available alternative.
For countries participating in the Joint Eurostat-OECD Comparison Programme which are coordinated by Eurostat, item samples are determined by Eurostat in collaboration with Member States and the OECD. The final selection should be comprised of comparable items and, to the largest extent possible, be equally representatives of the consumption expenditure patterns in participant countries. Subsequent data collection is conducted by national statistical institutes.
Expenditure weights for aggregation purposes are obtained from periodic surveys conducted amongst international officials.
Yearly
Correction coefficients for June (1st July) are published in autumn of the same year.
Correction coefficients for intervening months are published when a change is implemented in accordance with the "5% rule" set out in the Staff Regulations. Intermediate reports are published in spring (for the reference months 1st July - 1st January) and in autumn (for the reference months 1st February - 1st June)
Correction coefficients are specifically designed as spatial price level indicators, and the comparability of the results across countries can be assumed to be very good.
Correction coefficients are designed to compare price levels for different geographical locations at the same point in time. Temporal consumer price indices on the other hand are designed to compare price levels for the same geographical location at different points in time. This difference has important implications for the way in which items are selected and defined, and other aspects of methodology. It is conceivable that two successive calculations of correction coefficients may use quite different samples and methodologies, if this is considered necessary to produce a spatial comparison of improved quality. Unfortunately, no indicator exists that simultaneously captures spatial and temporal aspects in an adequate manner. Clearly a degree of care is therefore required when interpreting the temporal development of correction coefficients.