|
|
|
||||||||||||||||||||||||||||||||||||||||||||||||||||||||||||||||||||||||||||||||||||||||||||||||||||||||
| For any question on data and metadata, please contact: Eurostat user support |
|
|||
| 1.1. Contact organisation | Eurostat |
||
| 1.2. Contact organisation unit | E1: Agriculture and fisheries |
||
| 1.5. Contact mail address | Eurostat Rue Alphonse Weicker 5, 2721 Luxembourg LUXEMBOURG |
||
|
|||||||||||||||||||||||||||||||
| 2.1. Data description | |||||||||||||||||||||||||||||||
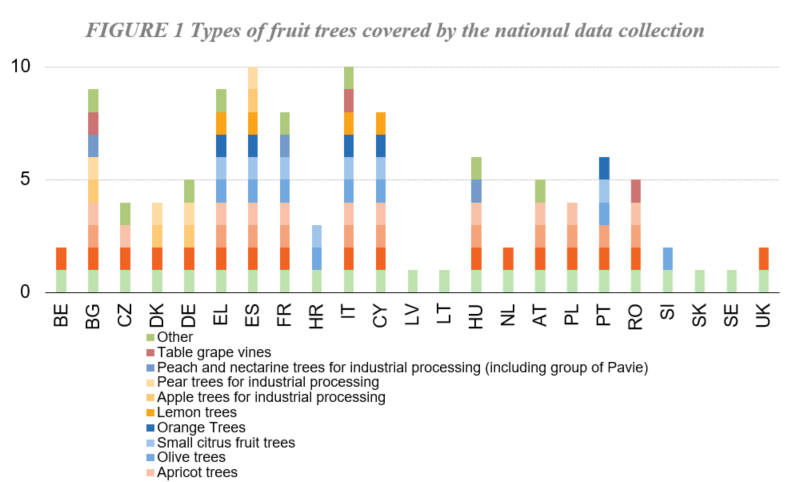
Main characteristics
|
|||||||||||||||||||||||||||||||
| 2.2. Classification system | |||||||||||||||||||||||||||||||
Almost all countries stated that they apply the following classification system: Species and variety group classification, age and density classifications available in RAMON[1]. The definitions stated in article 2 of Regulation (EC)1337/2011 are the following:
[1]Reference And Management Of Nomenclatures |
|||||||||||||||||||||||||||||||
| 2.3. Coverage - sector | |||||||||||||||||||||||||||||||
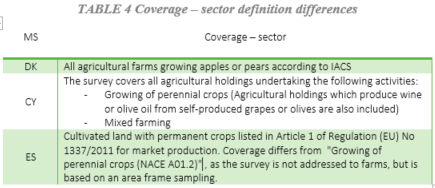
The generally adopted definition of the sector coverage is: Growing of perennial crops (NACE A01.2) Nevertheless Denmark, Cyprus and Spain reported different coverage sector definitions:
|
|||||||||||||||||||||||||||||||
| 2.4. Statistical concepts and definitions | |||||||||||||||||||||||||||||||
See: Orchard statistics Handbook |
|||||||||||||||||||||||||||||||
| 2.5. Statistical unit | |||||||||||||||||||||||||||||||
The definition of statistical units generally applied by the countries is:
Utilised agricultural area used for the cultivation of permanent crops mentioned in point 2.1, cultivated by an agricultural holding producing entirely or mainly for the market.
Cyprus, Hungary and Portugal adopt different ones: CY: The statistical unit is represented by the agricultural holdings with permanent crops which are included in the Agricultural Register of the Statistical Service. HU: Orchard area above 2500 m2 for which farmers applied SAPS in 2017 (The basic threshold was increased that this did not lead to the exclusion of more than an additional 5 % of the total planted area of the orchards.). PT: The survey unit is a homogeneous parcel planted by an agricultural holding producing entirely or mainly for the market, with the cultivation of permanent crops mentioned in point 2.1.
|
|||||||||||||||||||||||||||||||
| 2.6. Statistical population | |||||||||||||||||||||||||||||||
All agricultural holdings growing entirely or mainly for the market permanent crops mentioned in point 2.1. Germany, France, Cyprus, Hungary and Portugal provided a different national definition:
DE: All agricultural holdings growing permanent crops mentioned in point 2.1 entirely or mainly for the market. In DE all units are included in the census, which produce tree fruits for the market on an area of at least 0,5 Hectar (threshold). FR: All agricultural holdings growing entirely or mainly for the market permanent crops mentioned in point 2.1. French national thresholds: Farms with at least - 1 hectare (>=) for apple trees OR peach and nectarine trees OR apricot trees OR small citrus fruit (mandarin / clementin) OR olive trees - or 0.5 hectare of pear trees" CY: All the holdings with permanent crops, which are included in the Agricultural Register of the Statistical Service. HU: Users of the orchards who were applied for SAPS in 2017 for the planted orchard area. PT: All agricultural holdings with an area planted with fruit trees (apples, pear, peach, orange and small-fruited citrus) provided that the fruit produced is entirely or mainly intended for the market. According current legislation the combination of § 1 and 2 of Article 3, allows MS to exclude until 10% of total planted area of each permanent crop since statistics be representative of at least 95% of the total which could be accumulate with another 5% in the case of the area covered by the holdings with a threshold bellow 0,2 ha is less than 5% of the total planted areas of individual crops. |
|||||||||||||||||||||||||||||||
| 2.7. Reference area | |||||||||||||||||||||||||||||||
|
|||||||||||||||||||||||||||||||
| 2.8. Coverage - Time | |||||||||||||||||||||||||||||||
Almost all countries stated that they apply the following classification system: Species and variety group classification, age and density classifications available in RAMON[1]. The definitions stated in article 2 of Regulation (EC)1337/2011 are the following:
[1]Reference And Management Of Nomenclatures |
|||||||||||||||||||||||||||||||
| 2.9. Base period | |||||||||||||||||||||||||||||||
not applicable |
|||||||||||||||||||||||||||||||
|
||||||||||||||||||||||||||||||||||||||||||||||||||||||||||||||||||||||||||||||||||||||||||||||||||||||||||||||||||||||||||||||||||||||||
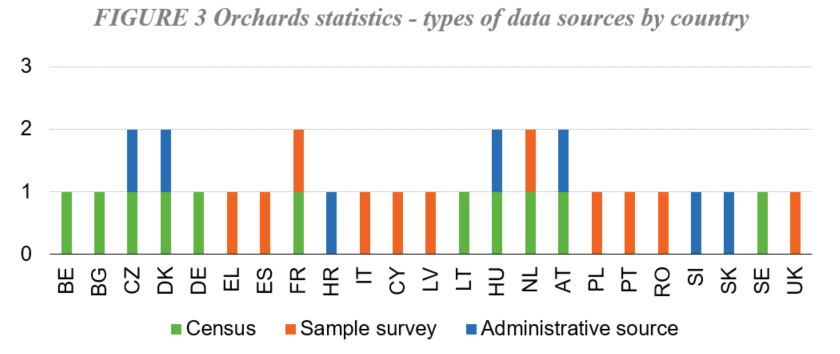
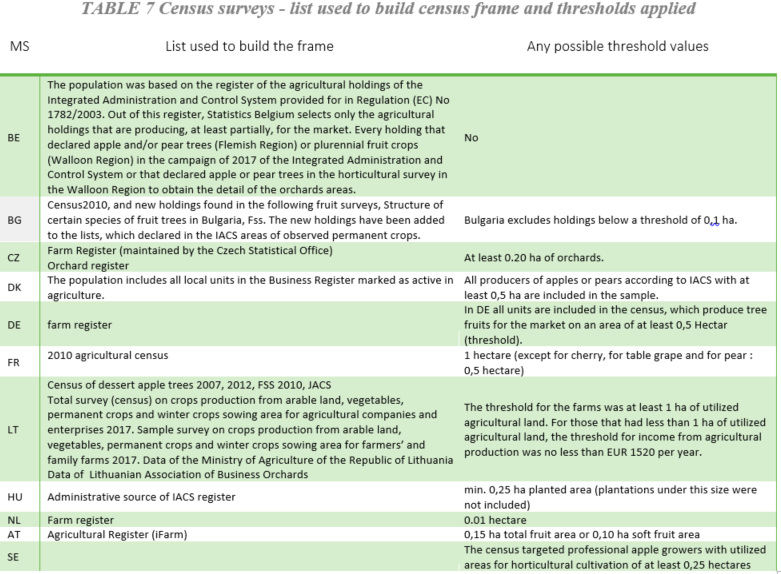
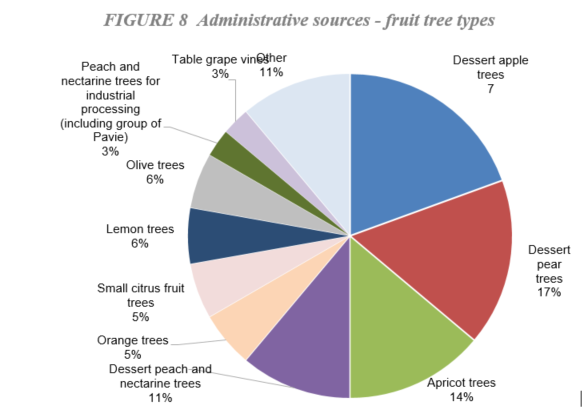
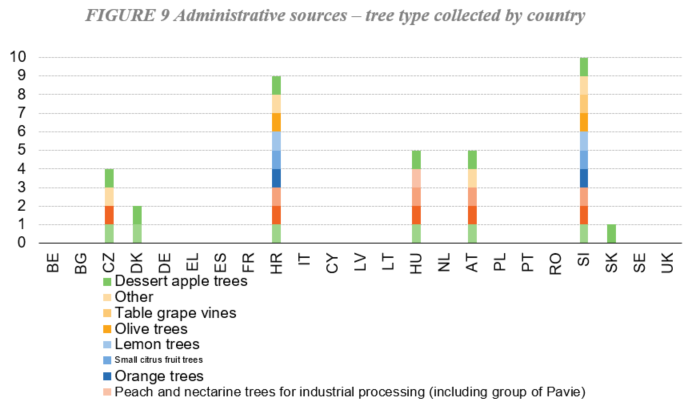
| 3.1. Source data | ||||||||||||||||||||||||||||||||||||||||||||||||||||||||||||||||||||||||||||||||||||||||||||||||||||||||||||||||||||||||||||||||||||||||
Overall summary
|
||||||||||||||||||||||||||||||||||||||||||||||||||||||||||||||||||||||||||||||||||||||||||||||||||||||||||||||||||||||||||||||||||||||||
| 3.2. Frequency of data collection | ||||||||||||||||||||||||||||||||||||||||||||||||||||||||||||||||||||||||||||||||||||||||||||||||||||||||||||||||||||||||||||||||||||||||
All countries stated that the frequency of orchards data collection is five years. |
||||||||||||||||||||||||||||||||||||||||||||||||||||||||||||||||||||||||||||||||||||||||||||||||||||||||||||||||||||||||||||||||||||||||
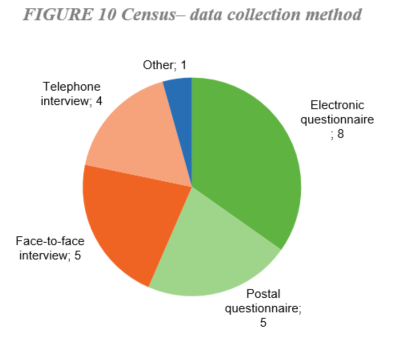
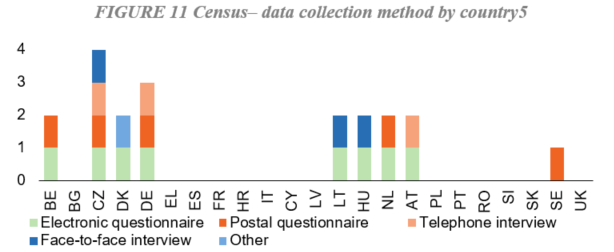
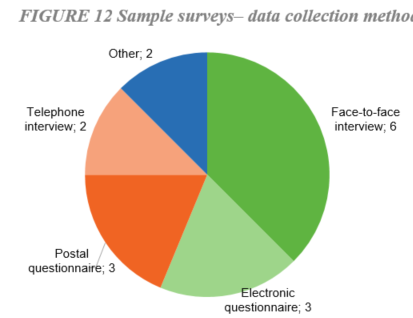
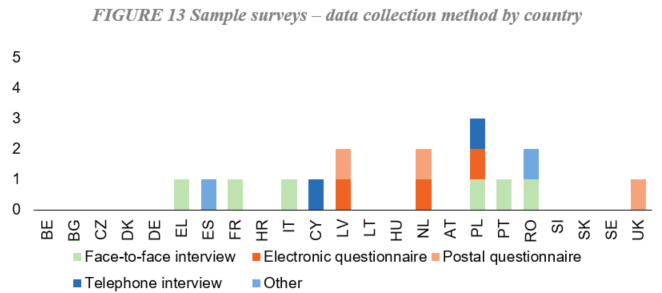
| 3.3. Data collection | ||||||||||||||||||||||||||||||||||||||||||||||||||||||||||||||||||||||||||||||||||||||||||||||||||||||||||||||||||||||||||||||||||||||||
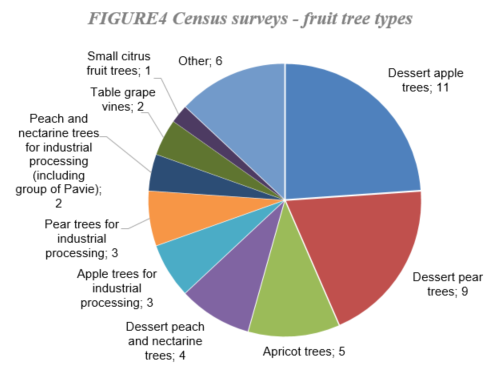
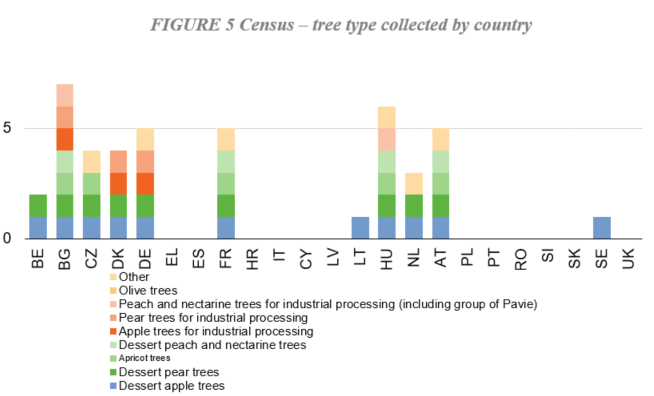
Census
|
||||||||||||||||||||||||||||||||||||||||||||||||||||||||||||||||||||||||||||||||||||||||||||||||||||||||||||||||||||||||||||||||||||||||
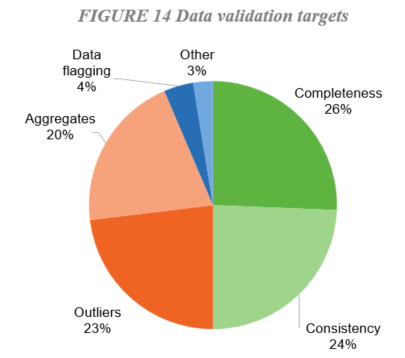
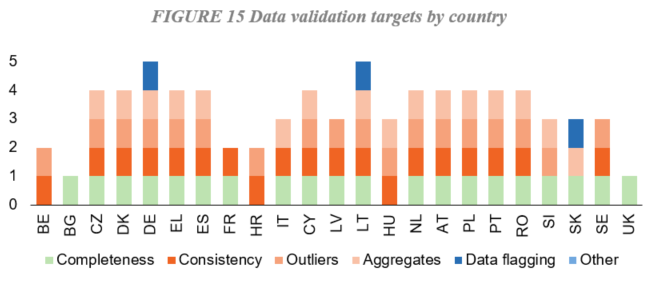
| 3.4. Data validation | ||||||||||||||||||||||||||||||||||||||||||||||||||||||||||||||||||||||||||||||||||||||||||||||||||||||||||||||||||||||||||||||||||||||||
|
||||||||||||||||||||||||||||||||||||||||||||||||||||||||||||||||||||||||||||||||||||||||||||||||||||||||||||||||||||||||||||||||||||||||
| 3.5. Data compilation | ||||||||||||||||||||||||||||||||||||||||||||||||||||||||||||||||||||||||||||||||||||||||||||||||||||||||||||||||||||||||||||||||||||||||
|
||||||||||||||||||||||||||||||||||||||||||||||||||||||||||||||||||||||||||||||||||||||||||||||||||||||||||||||||||||||||||||||||||||||||
| 3.6. Adjustment | ||||||||||||||||||||||||||||||||||||||||||||||||||||||||||||||||||||||||||||||||||||||||||||||||||||||||||||||||||||||||||||||||||||||||
not applicable |
||||||||||||||||||||||||||||||||||||||||||||||||||||||||||||||||||||||||||||||||||||||||||||||||||||||||||||||||||||||||||||||||||||||||
|
|||||||||||||||||||||||||||||||||||||||||||||||||||||||||||||||||||||||||||||||||||||||||||||||||||||
| 4.1. Quality assurance | |||||||||||||||||||||||||||||||||||||||||||||||||||||||||||||||||||||||||||||||||||||||||||||||||||||
|
|||||||||||||||||||||||||||||||||||||||||||||||||||||||||||||||||||||||||||||||||||||||||||||||||||||
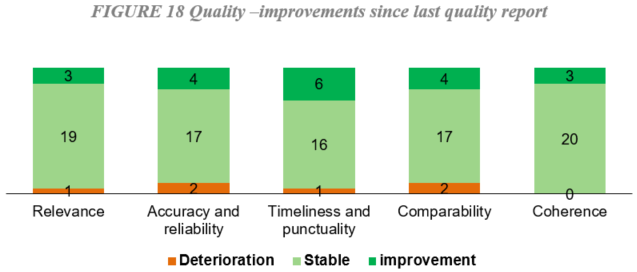
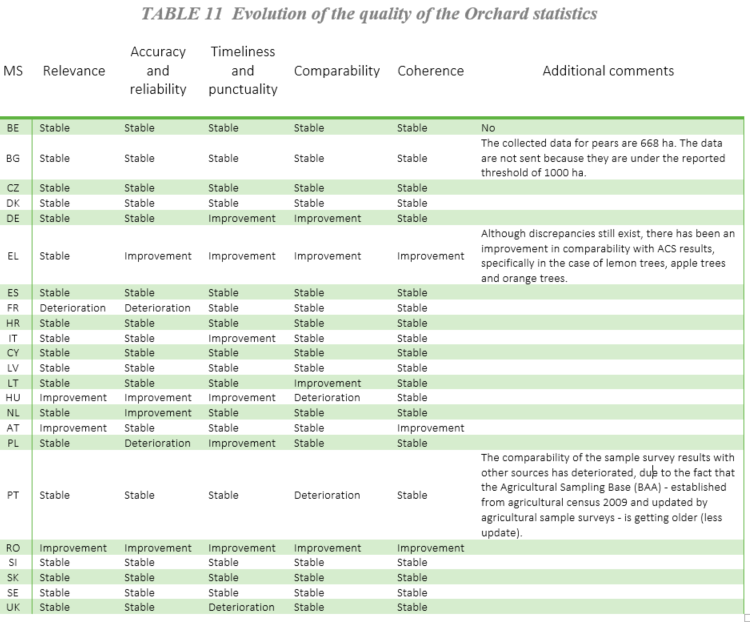
| 4.2. Quality management - assessment | |||||||||||||||||||||||||||||||||||||||||||||||||||||||||||||||||||||||||||||||||||||||||||||||||||||
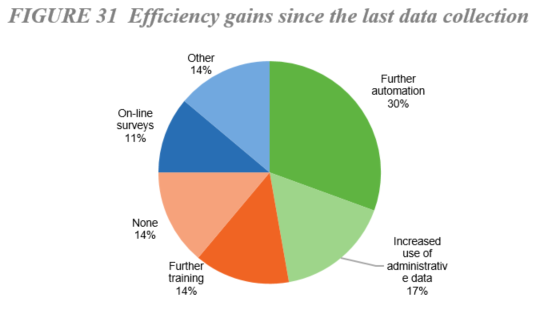
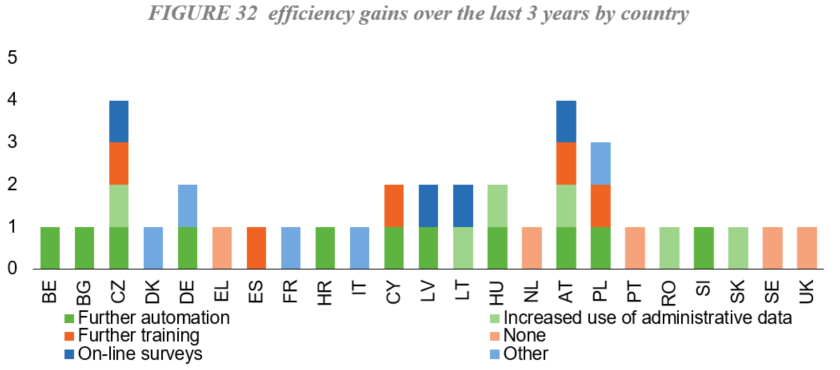
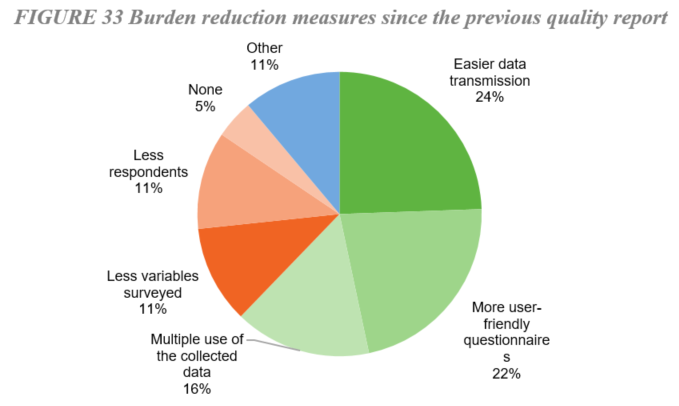
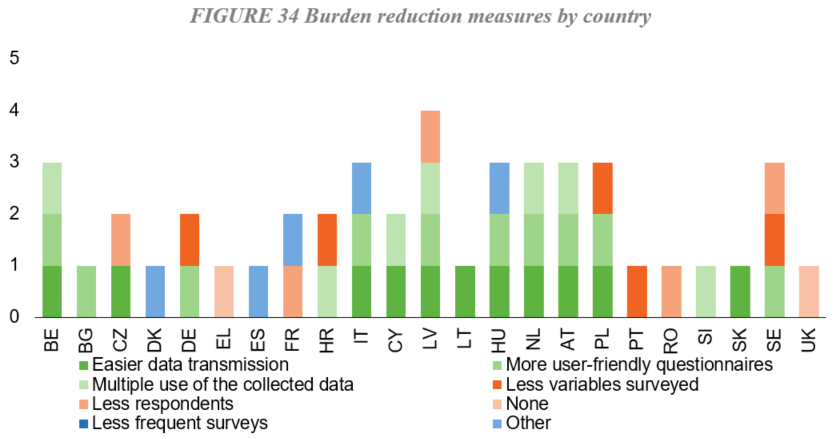
Development since the last quality report
|
|||||||||||||||||||||||||||||||||||||||||||||||||||||||||||||||||||||||||||||||||||||||||||||||||||||


|
||||||||||
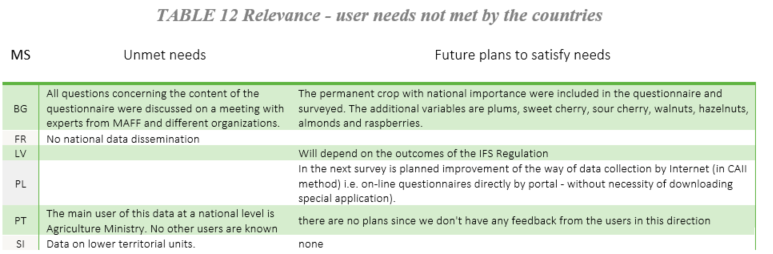
| 5.1. Relevance - User Needs | ||||||||||
|
||||||||||
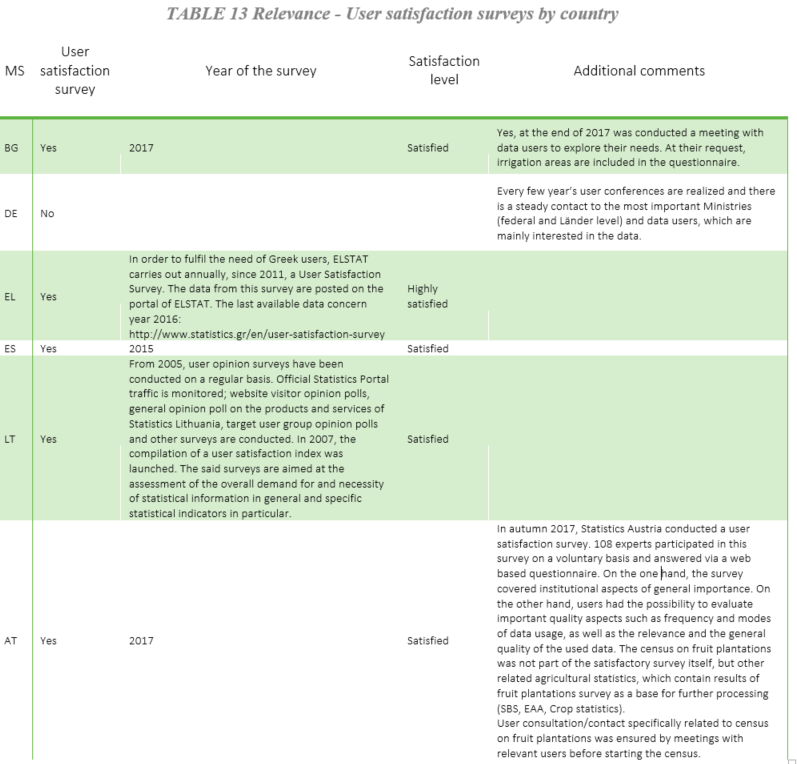
| 5.2. Relevance - User Satisfaction | ||||||||||
|
||||||||||
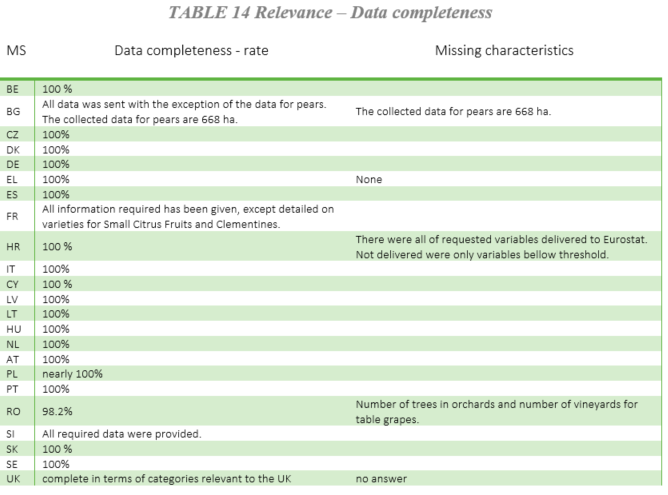
| 5.3. Completeness | ||||||||||
|
||||||||||
|
||||||||||||||||||||||||||||||||||||||||||||||||||||||||||||||||||||||||||||||||||||||||||||||||||||||||
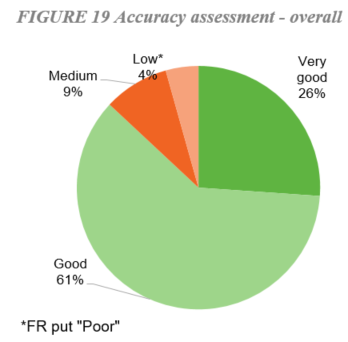
| 6.1. Accuracy - overall | ||||||||||||||||||||||||||||||||||||||||||||||||||||||||||||||||||||||||||||||||||||||||||||||||||||||||
|
||||||||||||||||||||||||||||||||||||||||||||||||||||||||||||||||||||||||||||||||||||||||||||||||||||||||
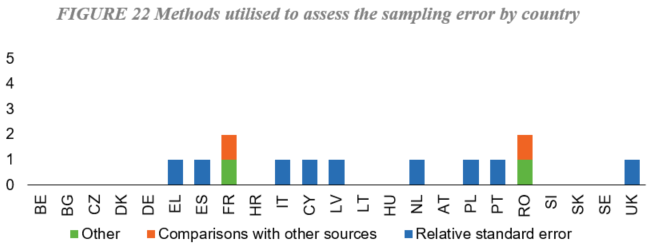
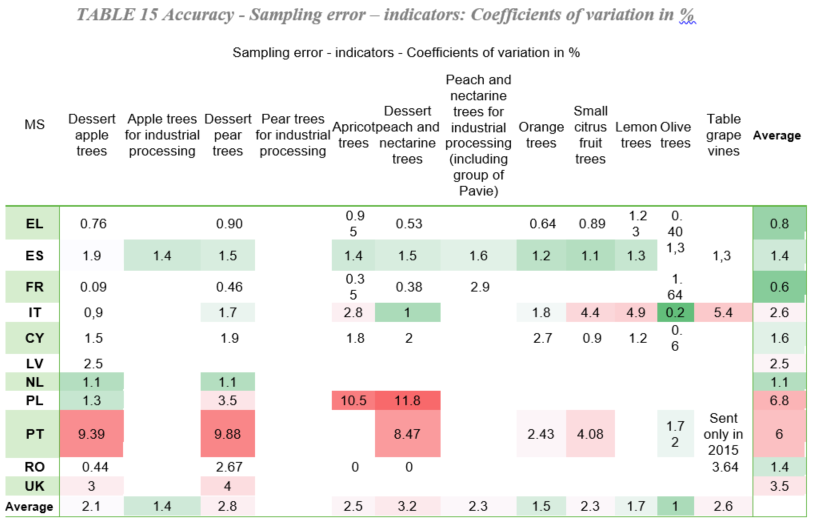
| 6.2. Sampling error | ||||||||||||||||||||||||||||||||||||||||||||||||||||||||||||||||||||||||||||||||||||||||||||||||||||||||
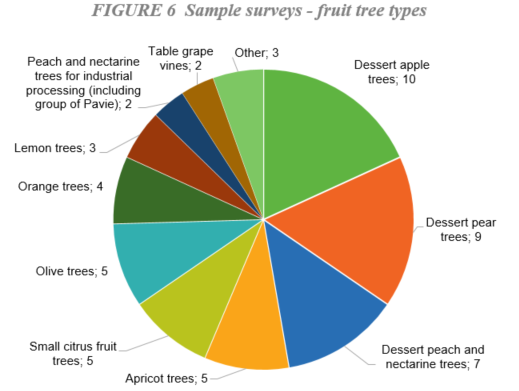
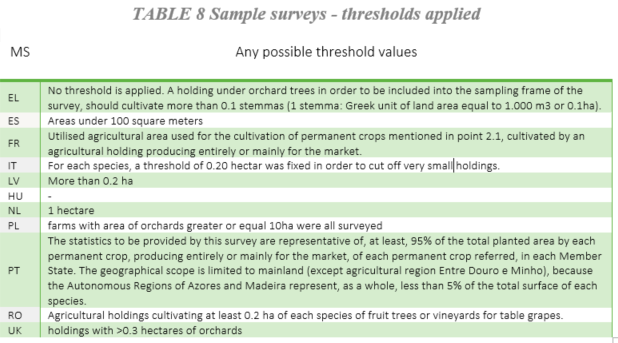
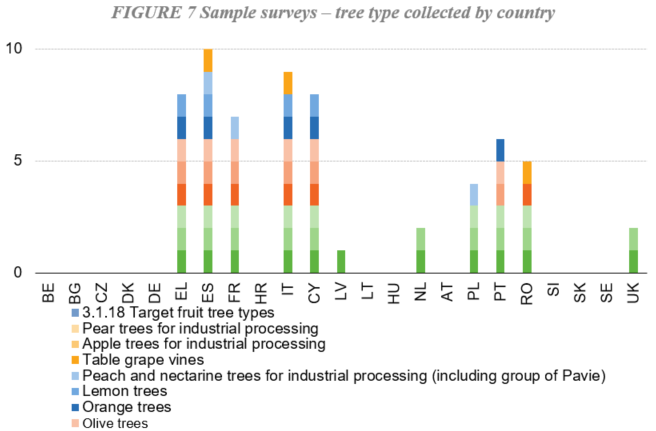
Sample survey
|
||||||||||||||||||||||||||||||||||||||||||||||||||||||||||||||||||||||||||||||||||||||||||||||||||||||||
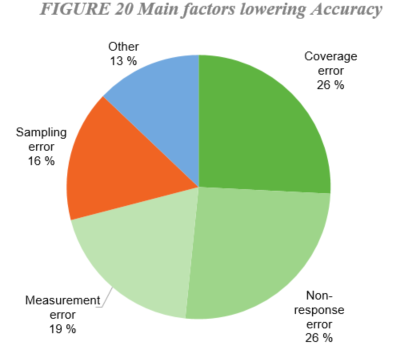
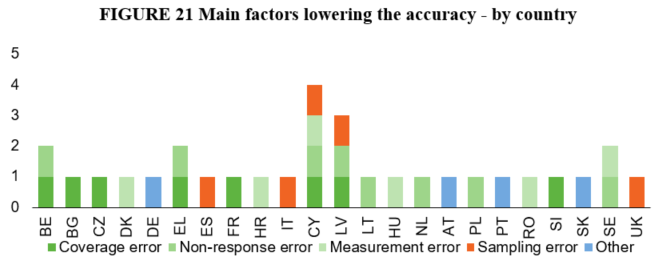
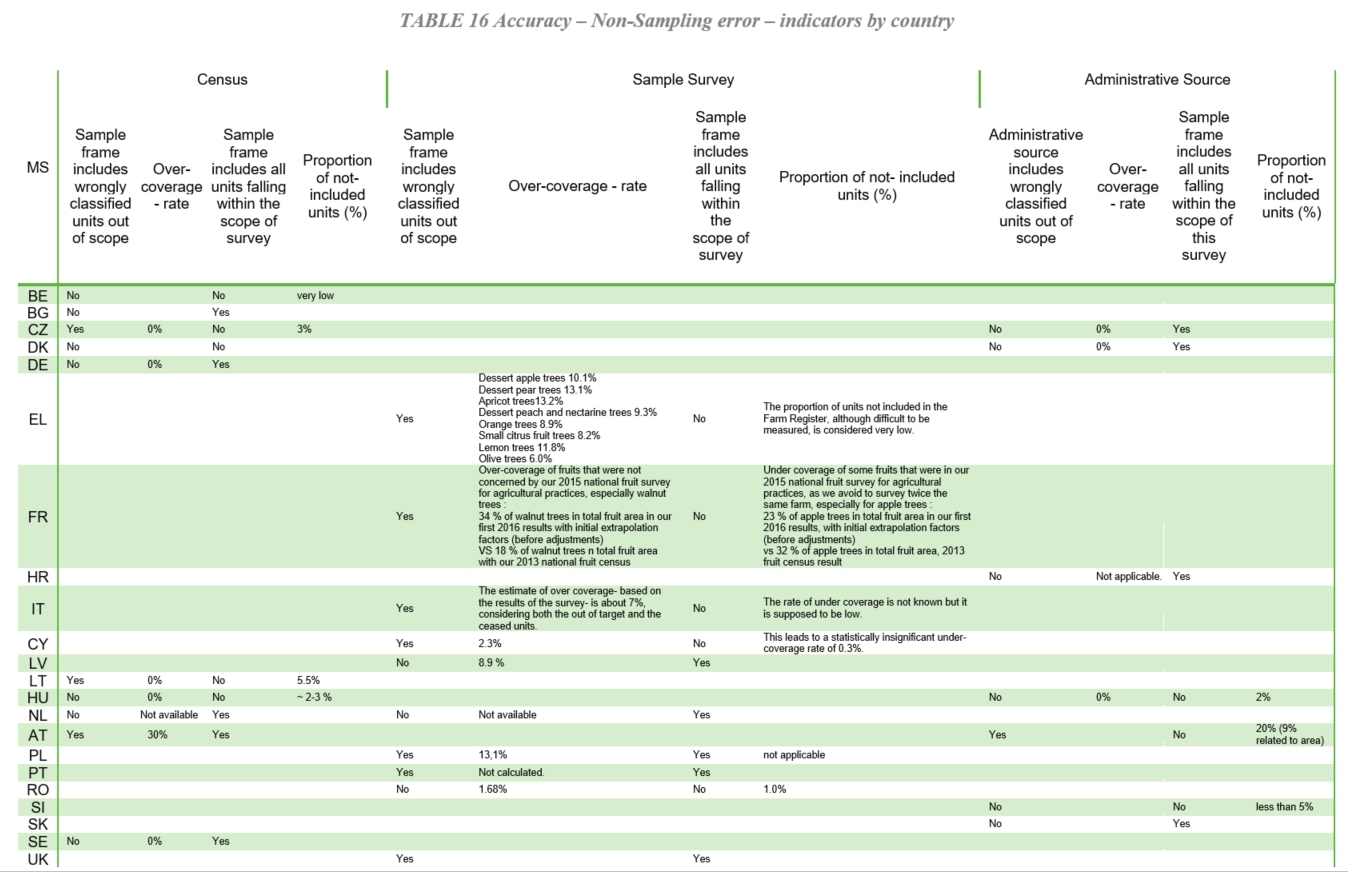
| 6.3. Non-sampling error | ||||||||||||||||||||||||||||||||||||||||||||||||||||||||||||||||||||||||||||||||||||||||||||||||||||||||
Non-sampling error is analysed separately for census, sample survey and administrative data. The analysis by country will be here drafted according to the source. |
||||||||||||||||||||||||||||||||||||||||||||||||||||||||||||||||||||||||||||||||||||||||||||||||||||||||
| 6.3.1. Coverage error | ||||||||||||||||||||||||||||||||||||||||||||||||||||||||||||||||||||||||||||||||||||||||||||||||||||||||
Census
|
||||||||||||||||||||||||||||||||||||||||||||||||||||||||||||||||||||||||||||||||||||||||||||||||||||||||
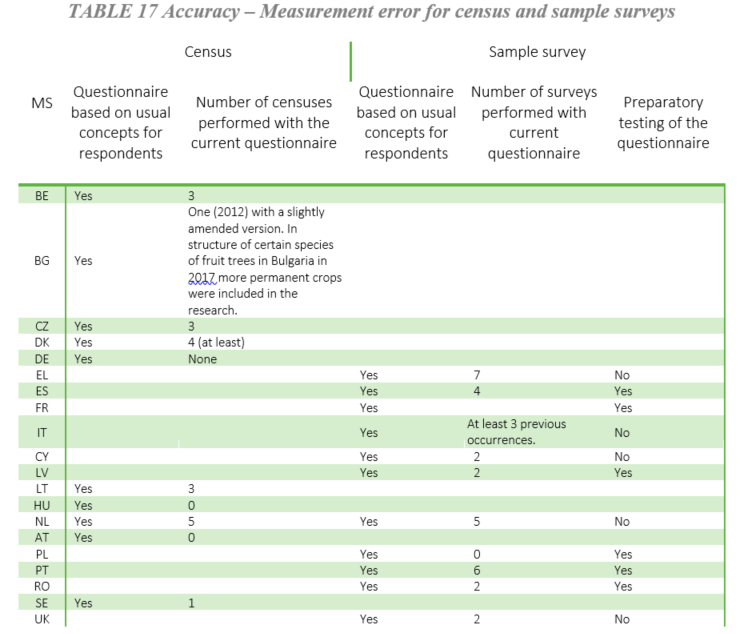
| 6.3.2. Measurement error | ||||||||||||||||||||||||||||||||||||||||||||||||||||||||||||||||||||||||||||||||||||||||||||||||||||||||
Census
|
||||||||||||||||||||||||||||||||||||||||||||||||||||||||||||||||||||||||||||||||||||||||||||||||||||||||
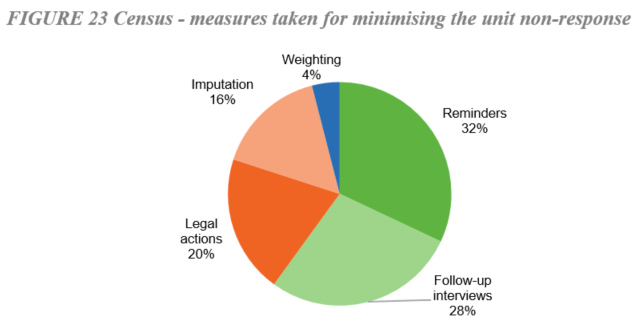
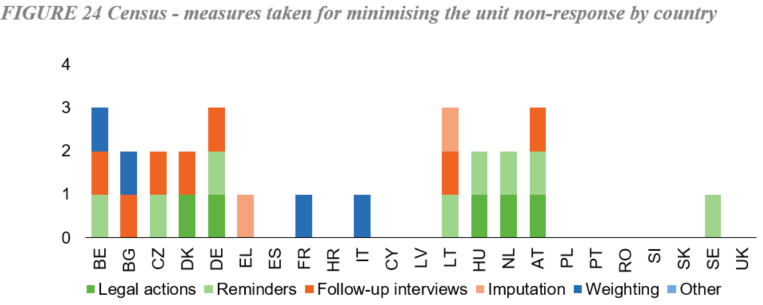
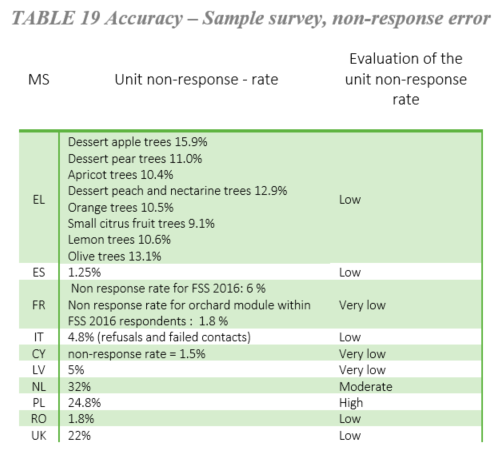
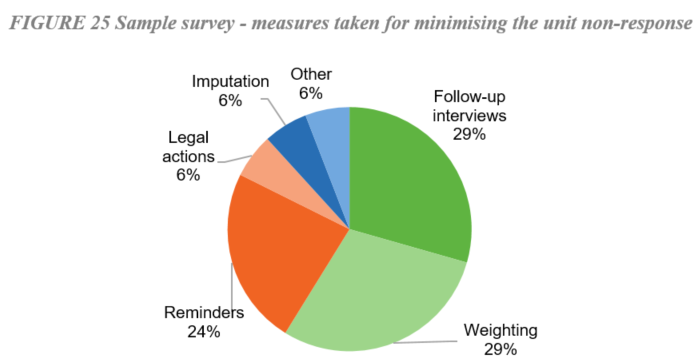
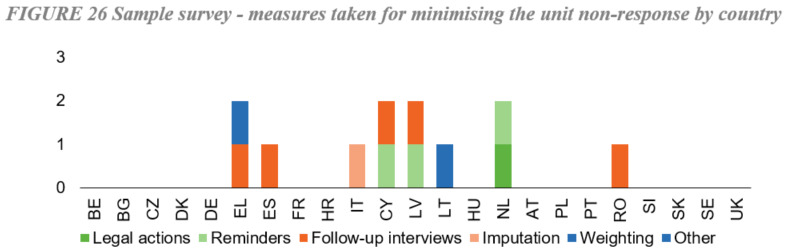
| 6.3.3. Non response error | ||||||||||||||||||||||||||||||||||||||||||||||||||||||||||||||||||||||||||||||||||||||||||||||||||||||||
Census
|
||||||||||||||||||||||||||||||||||||||||||||||||||||||||||||||||||||||||||||||||||||||||||||||||||||||||
| 6.3.4. Processing error | ||||||||||||||||||||||||||||||||||||||||||||||||||||||||||||||||||||||||||||||||||||||||||||||||||||||||
Census
|
||||||||||||||||||||||||||||||||||||||||||||||||||||||||||||||||||||||||||||||||||||||||||||||||||||||||
| 6.3.5. Model assumption error | ||||||||||||||||||||||||||||||||||||||||||||||||||||||||||||||||||||||||||||||||||||||||||||||||||||||||
| 6.4. Seasonal adjustment | ||||||||||||||||||||||||||||||||||||||||||||||||||||||||||||||||||||||||||||||||||||||||||||||||||||||||
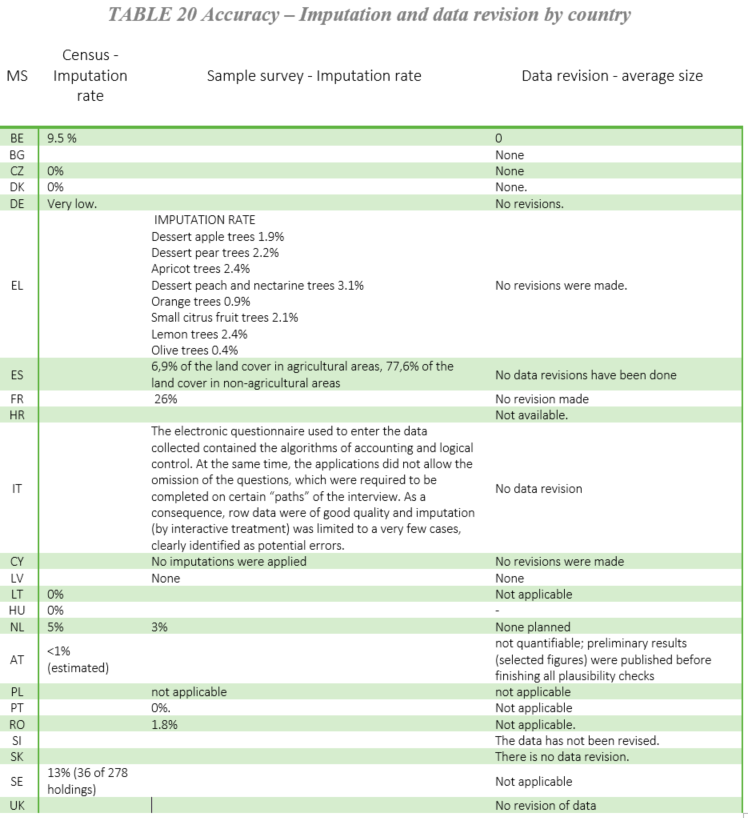
| 6.5. Data revision - policy | ||||||||||||||||||||||||||||||||||||||||||||||||||||||||||||||||||||||||||||||||||||||||||||||||||||||||
Countries could report if they had conceptual changes since the last quality report necessitating data revisions. Table 20 points out the imputation rates for both census and sample surveys, as well as the average size of the data revision. None of the responding countries reported a data revision. |
||||||||||||||||||||||||||||||||||||||||||||||||||||||||||||||||||||||||||||||||||||||||||||||||||||||||
| 6.6. Data revision - practice | ||||||||||||||||||||||||||||||||||||||||||||||||||||||||||||||||||||||||||||||||||||||||||||||||||||||||
|
||||||||||||||||||||||||||||||||||||||||||||||||||||||||||||||||||||||||||||||||||||||||||||||||||||||||
|
||||||
| 7.1. Timeliness | ||||||
|
||||||
| 7.2. Punctuality | ||||||
| Restricted from publication | ||||||
|
||||||||||||||||||||||||||||||||||||||||||||||||||||||||||||||||||||||||||||||||||||||||||||||||||||||||||||
| 8.1. Comparability - geographical | ||||||||||||||||||||||||||||||||||||||||||||||||||||||||||||||||||||||||||||||||||||||||||||||||||||||||||||
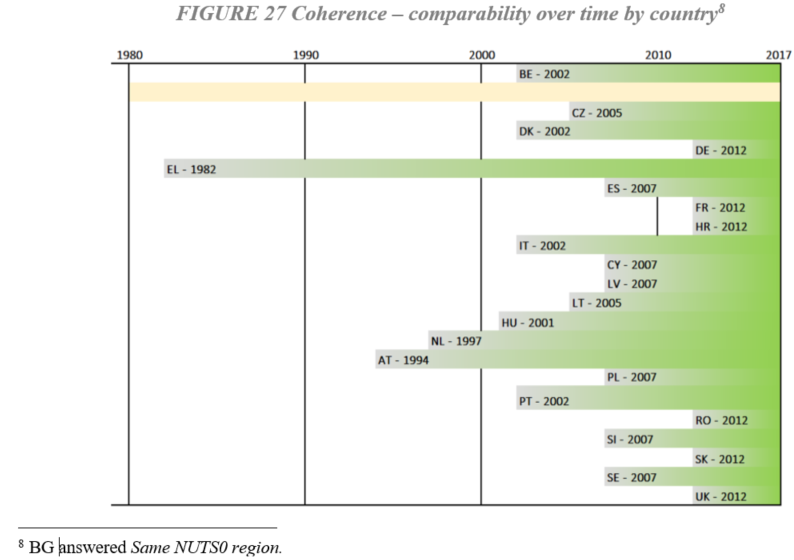
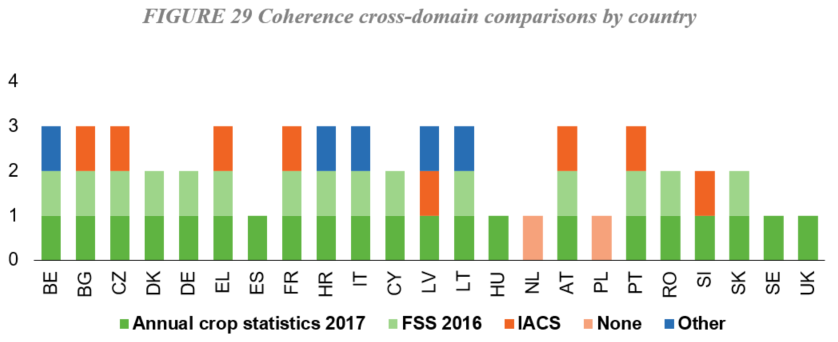
Coherence and comparability are assessed in two different ways: internal comparability as length of the time series and coherence against other data sets. |
||||||||||||||||||||||||||||||||||||||||||||||||||||||||||||||||||||||||||||||||||||||||||||||||||||||||||||
| 8.1.1. Asymmetry for mirror flow statistics - coefficient | ||||||||||||||||||||||||||||||||||||||||||||||||||||||||||||||||||||||||||||||||||||||||||||||||||||||||||||
| 8.2. Comparability - over time | ||||||||||||||||||||||||||||||||||||||||||||||||||||||||||||||||||||||||||||||||||||||||||||||||||||||||||||
|
||||||||||||||||||||||||||||||||||||||||||||||||||||||||||||||||||||||||||||||||||||||||||||||||||||||||||||
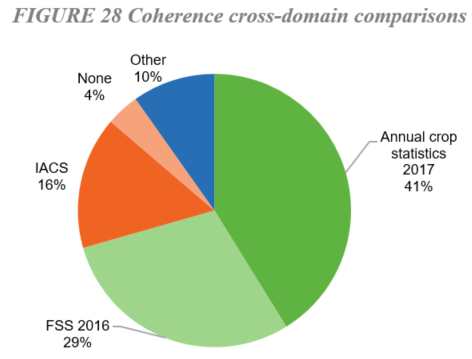
| 8.3. Coherence - cross domain | ||||||||||||||||||||||||||||||||||||||||||||||||||||||||||||||||||||||||||||||||||||||||||||||||||||||||||||
|
||||||||||||||||||||||||||||||||||||||||||||||||||||||||||||||||||||||||||||||||||||||||||||||||||||||||||||
| 8.4. Coherence - sub annual and annual statistics | ||||||||||||||||||||||||||||||||||||||||||||||||||||||||||||||||||||||||||||||||||||||||||||||||||||||||||||
| 8.5. Coherence - National Accounts | ||||||||||||||||||||||||||||||||||||||||||||||||||||||||||||||||||||||||||||||||||||||||||||||||||||||||||||
| 8.6. Coherence - internal | ||||||||||||||||||||||||||||||||||||||||||||||||||||||||||||||||||||||||||||||||||||||||||||||||||||||||||||
|
||||||||||||
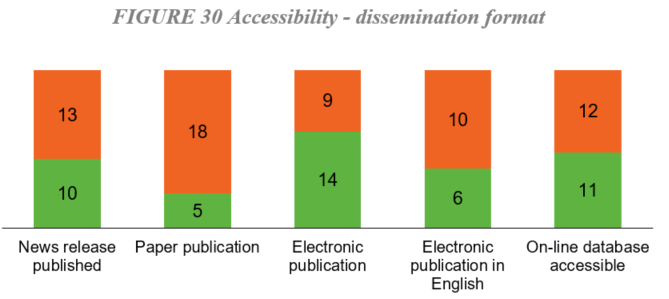
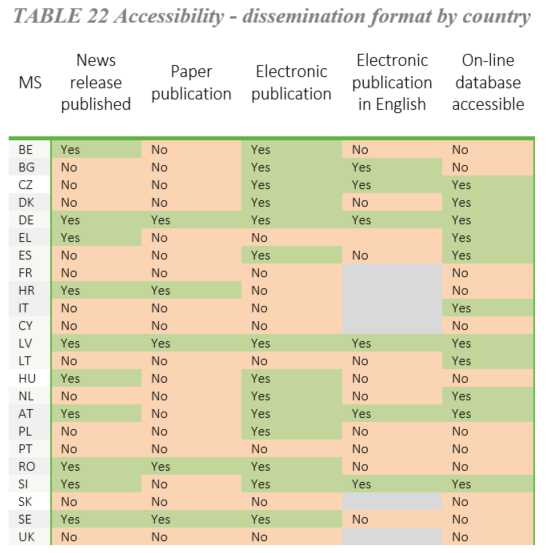
| 9.1. Dissemination format - News release | ||||||||||||
|
||||||||||||
| 9.2. Dissemination format - Publications | ||||||||||||
| Restricted from publication | ||||||||||||
| 9.3. Dissemination format - online database | ||||||||||||
| Restricted from publication | ||||||||||||
| 9.4. Dissemination format - microdata access | ||||||||||||
| Restricted from publication | ||||||||||||
| 9.5. Dissemination format - other | ||||||||||||
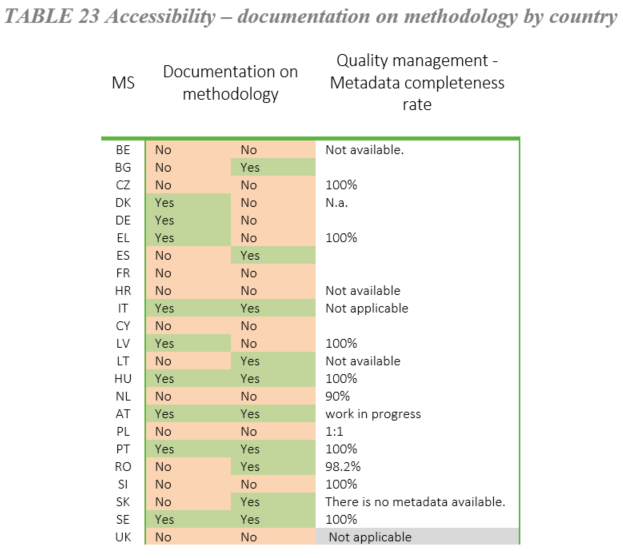
| 9.6. Documentation on methodology | ||||||||||||
|
||||||||||||
| 9.7. Quality management - documentation | ||||||||||||
| Restricted from publication | ||||||||||||
|
||||||||||||||||||||||||||||||||||||||||||||||||
|
||||||||||||||||||||||||||||||||||||||||||||||||
|
||||
| 11.1. Confidentiality - policy | ||||
| Restricted from publication | ||||
| 11.2. Confidentiality - data treatment | ||||
|
||||
|
|||
|
|||
| orch_esms - Orchard |
|||
|
|||
| Annex_2_Tables_Regulation_1337_2011 Annex_3_B5proposal_ORCHARD_DataFileDefinition_v3 Annex_4_Validation-rules_orchards_130321 Annex_5_SIF_Orchard Survey results_2002_EU-15 Annex_6_SIF_2007OrchardSurveyMainResults Annex_1_ Regulation 1337_2011 ANNEX ORCHARD STATISTICS - LIST OF REPORTED DATA SOURCES |
|||