Reference metadata describe statistical concepts and methodologies used for the collection and generation of data. They provide information on data quality and, since they are strongly content-oriented, assist users in interpreting the data. Reference metadata, unlike structural metadata, can be decoupled from the data.
Department for statistical production DIAE/DCSE/SEC
1.3. Contact name
Confidential because of GDPR
1.4. Contact person function
Confidential because of GDPR
1.5. Contact mail address
ISTAT
Department for statistical production DIPS/DCSE/SEC
Via Tuscolana 1776 - 00173 Rome - Italy
1.6. Contact email address
Confidential because of GDPR
1.7. Contact phone number
Confidential because of GDPR
1.8. Contact fax number
Confidential because of GDPR
2.1. Metadata last certified
4 March 2025
2.2. Metadata last posted
4 March 2025
2.3. Metadata last update
4 March 2025
3.1. Data description
Data on the Information and Communication Technologies (ICT) usage and e-commerce in enterprises are survey data. They are collected by the National Statistical Institutes or Ministries and are in principle based on Eurostat's annual model questionnaires on ICT usage and e-commerce in enterprises.
The legal basis for ICT enterprise statistics for survey year 2024 is Commission Implementing Regulation (EU) 2023/1507 of 20 July 2023 laying down the technical specifications of data requirements for the topic 'ICT usage and e-commerce' for the reference year 2024. Large part of the data collected is used to measure the progress in the implementation of one of the main political priorities of the European Commission for 2019 to 2024 – A Europe fit for the digital age.
Furthermore, ICT data facilitate the monitoring of the EU’s digital targets for 2030, set by the Digital Decade Policy Programme. Four of the key performance indicators (KPIs) of the current programme stem from the statistics for which the implementing and delegated acts are enclosed for adoption: Artificial Intelligence, cloud, big data (data analytics) and the digital intensity index for businesses (DII) - a composite indicator reflecting the digital transformation of business. The aim of the European survey on ICT usage and e-commerce in enterprises is to collect and disseminate harmonised and comparable information at European level.
Name of data collection
Rilevazione sulle tecnologie dell'informazione e della comunicazione nelle imprese
All economic activities in the scope of Annex of the Commission Regulation are intended to be included in the general survey, covering enterprises with 10 or more employees and self-employed persons. These activities are:
Section C – “Manufacturing”
Section D, E – “Electricity, gas, steam and air conditioning supply”, “Water supply, sewerage, waste management and remediation activities”
Section F – “Construction”
Section G – “Wholesale and retail trade; repair of motor vehicles and motorcycles”
Section H – “Transportation and storage”
Section I – “Accommodation and food service activities”
Section J – “Information and communication”
Section L – “Real estate activities”
Section M – “Professional, scientific and technical activities”
Section N – "Administrative and support service activities"
Group 95.1 – “Repair of computers and communication equipment”.
For micro-enterprises see the sub-concepts below.
3.3.1. Coverage-sector economic activity for micro-enterprises - All NACE Rev. 2 categories are covered
Micro-enterprises are not included in the survey
3.3.2. Coverage sector economic activity for micro-enterprises - If not all activities were covered, which ones were covered?
3.4. Statistical concepts and definitions
The model questionnaire on ICT usage and e-commerce in enterprises provides a large variety of variables covering among others the following topics:
Access to and use of the Internet
E-commerce and e-business
ICT specialists and skills
ICT security
Artificial Intelligence.
The annual model questionnaires and the European businesses statistics compliers’ manual for ICT usage and e-commerce in enterprises comprise definitions and explanations regarding the topics of the survey.
3.5. Statistical unit
Statistical unit used for analysis is the enterprise but the questionnaire is sent to single legal units included in the enterprise as reported by BR on enterprises and BR on legal units
3.6. Statistical population
Target Population
As required by Annex of the Commission Implementing Regulation, enterprises with 10 or more employees and self-employed persons are covered by the survey.
For micro-enterprises see the sub-concepts below.
3.6.1. Coverage of micro-enterprises
No
3.6.2. Breakdown between size classes [0 to 1] and [2 to 9]
No
3.6.3. If for micro-enterprises different size delimitation was used, please indicate it.
Not applicable.
3.7. Reference area
Detailed information on the provision of data on NUTS 2 regional level is available in “Annex I. Completeness“.
All the territory of the country is considered.
3.8. Coverage - Time
Years 2023 and 2024.
3.9. Base period
Not applicable
Percentages of enterprises, Percentages of turnover, Percentages of employees and self-employed persons, Million euro (for selected indicators in some countries).
The reference periods defined in the model questionnaire are followed in the national survey.
6.1. Institutional Mandate - legal acts and other agreements
Complementary national legislation constituting the legal basis for the survey on the use of ICT in enterprises:
Legislative decree 6 September 1989, n. 322, "Rules on National Statistical System and on the reorganization of the National Statistical Institute" - art. 6 (duties of the offices statistics), art. 6-bis (processing of personal data), art. 7 (obligation to provide statistical data), art. 8 (official secrecy of employees of statistical offices), art. 9 (provisions for the protection of statistical secrecy), art. 11 (sanctions administrative), art. 13 (National Statistical Programme);
Regulation (EU) 2016/679 of the European Parliament and of the Council of 27 April 2016 on protection of individuals with regard to data processing personal data, as well as to the free movement of such data and that repeals Directive 95/46/EC (General Regulation on data protection);
Legislative Decree 10 August 2018, n. 101 “Provisions for the adaptation of the national legislation to the provisions of regulation (EU) 2016/679 of European Parliament and of the Council, of 27 April 2016”, relating to the protection of natural persons with regard to the processing of personal data (General Regulation on data protection)
The data may be communicated by Istat, exclusively for statistical purposes, to subjects of the National Statistical System (art.6, paragraph 1, letter b), Legislative Decree no. 322/1989) and to the Commission European (EUROSTAT) (Reg. 2023/1507); the same data may also be communicated for the purposes of scientific research, under the conditions and according to the methods established by the art. 5 ter of Legislative Decree no. 33/2013.
7.1. Confidentiality - policy
Regulation (EC) No 223/2009 on European statistics (recital 24 and Article 20(4)) of 11 March 2009 (OJ L 87, p. 164), stipulates the need to establish common principles and guidelines ensuring the confidentiality of data used for the production of European statistics and the access to those confidential data with due account for technical developments and the requirements of users in a democratic society.
At national level:
Legislative references:
Legislative Decree 30 June 2003, n. 196, "Code regarding the protection of personal data" - art. 4 (definitions), Art. 104-110 (treatment for statistical or scientific purposes);
"Code of ethics and good conduct for the processing of personal data for statistical and scientific research carried out as part of the National Statistical System" (all. A.3 of the Code regarding the protection of personal data - Leg. 30 June 2003, n. 196);
In the letter sent to legal units we assure that the data collected, protected by statistical confidentiality and, in the case of personal information, subject to the law on the protection of such data may be used for subsequent treatments, exclusively for statistical purposes by the subjects of the National Statistical System. May also be communicated for the purposes of scientific research subject to the conditions and in the manner prescribed by art.7 of the Code of conduct on the processing of personal data within the framework of the National Statistical System. The same data will be disseminated in an aggregated form,in such a way that can not be traced to individuals who provide them or to which they relate.
Data are transmitted via eDamis (encrypted) and delivered to a secure environment where they are treated. Flags are added for confidentiality in case results must not be disclosed.
At national level:
For this survey we use general criterion about minimum number of enterprises by breakdowns.
8.1. Release calendar
The release is out of official calendar but it is planned for December 2024-January 2025.
Online release is foreseen in December via Istat web site.
The release consist in publication on homepage of Istat' website of a brief important result linked to:
- Statistical Report on results;
- Methodological note;
- Data dissemination in the data wharehouse IstatData
Annual
10.1. Dissemination format - News release
National dissemination of results
Release in January 2025: Statistical Report linked to Data dissemination
10.2. Dissemination format - Publications
National dissemination of results
ICT release is foreseen in January 2025: Statistical Report and Data dissemination in the data wharehouse IstatData
10.3. Dissemination format - online database
See detailed section 10.3.1.
10.3.1. Data tables - consultations
Results for selected variables collected in the framework of this survey are available for all participating countries on Digital economy and society of Eurostat website.
At national level:
Results for selected variables collected in the framework of this survey are available on national Istat data wharehouse on website area dedicated to ICT Survey.
10.4. Dissemination format - microdata access
Istat provides microdata files from its surveys free of charge for study and research purposes or for statistical-scientific purposes, in compliance with the regulations in force.
The files released are those available at the time of the request and may be subject to statistical revisions.
The European businesses statistics compilers’ manual for ICT usage and e-commerce in enterprises provides guidelines and clarifications for the implementation of the surveys.
At national level:
It is possible to find Survey description in Istat Information system on quality of statistical production processes.
In order to assist respondents, Istat makes all information about surveys available online (link for ICT2024): questionnaires, survey forms, memoranda and other documents on how to fill in and return the questionnaires
10.6.1. Metadata completeness - rate
Not requested
10.7. Quality management - documentation
Not available.
11.1. Quality assurance
The European businesses statistics compliers’ manual for ICT usage and e-commerce in enterprises provides guidelines and standards for the implementation of the surveys. It is updated every year according to the changed contents of the model questionnaires.
At national level:
At national level, quality is assured by guidelines, test and pop-up note on online questionnaire and rules implemented linked with filling in the model, contact center workers training, scheduling the reminders, monitoring data collection.
11.2. Quality management - assessment
At European level, the recommended use of the annual Eurostat model questionnaire aims at improving comparability of the results among the countries that conduct the survey on ICT usage and e-commerce in enterprises. Moreover, the European businesses statistics compilers’ manual for ICT usage and e-commerce in enterprises provides guidelines and clarifications for the implementation of the surveys.
At national level:
At national level Eurostat recommendation are implemented, legal units are helped with contact center, faq, guidelines.
12.1. Relevance - User Needs
Istat uses working groups for the preparation of the National Statistical Program (Psn). Six sectors have been identified, coordinated by directors, who deal with the activities related to the preparation of the Psn. Each sector is then divided into thematic areas coordinated by experts (Istat service managers or other experts in the field).
The working group in which is included the ICT survey is responsible to analyze the supply and demand for statistical information for the Psn. The participants are from other public Institutions or private sector.
12.2. Relevance - User Satisfaction
At national level we don't measure this topic yet.
12.3. Completeness
Detailed information is available in “ Annex I. Completeness “ - related to questionnaire, coverage, additional questions, regional data.
12.3.1. Data completeness - rate
Not requested
13.1. Accuracy - overall
Comments on reliability and representativeness of results and completeness of dataset
These comments reflect overall standard errors reported for the indicators and breakdowns in section 13.2.1 (Sampling error - indicators) and the rest of the breakdowns for national and European aggregates, as well as other accuracy measurements. The estimated standard error should not exceed 2pp for the overall proportions and should not exceed 5pp for the proportions related to the different subgroups of the population (for those NACE aggregates for the calculation and dissemination of national aggregates). If problems were found, these could have implications for future surveys (e.g. need to improve sampling design, to increase sample sizes, to increase the response rates).
More detailed information is available in “ Annex II. Accuracy “ - related to European aggregates, comments on reliability and use of flag.
13.2. Sampling error
For calculation of the standard error see 13.2.1.1.
13.2.1. Sampling error - indicators
Standard error (for selected indicators and breakdowns)
Precision measures related to variability due to sampling, unit non-response (the size of the subset of respondents is smaller than the size of the original sample) and other (imputation for item non-response, calibration etc.) are not (yet) required from the Member states for all indicators. Eurostat will make basic assumptions to compute these measures for all indicators produced (e.g. stratified random sampling assuming as strata the crossing of the variables “Number of employees and self-employed persons” and “Economic Activity” as it was defined in the 3 tables of section 18.1).
More detailed information is available in“ Annex III. Sample and standard error tables 2024 “ – worksheets starting with “Standard error".
13.2.1.1. Sampling error indicator calculation
Calculation of the standard error
Various methods can be used for the calculation of the standard error for an estimated proportion. The aim is to incorporate into the standard error the sampling variability but also variability due to unit non-response, item non-response (imputation), calibration etc. In case of census / take-all strata, the aim is to calculate the standard errors comprising the variability due to unit non-response and item non-response.
a) Name and brief description of the applied estimation approach
The coefficient of variation is given by the square root of the variance of the estimator out of its expected value.
It is estimated by the ratio of the square root of the estimated sampling variance to the estimated value of the variable of interest. Standard errors are calculated using the Taylor linearization technique (ReGenesees, is the software used to calculate standard errors, confidence intervals for Totals, Means, absolute and relative Frequency Distributions, Ratios)
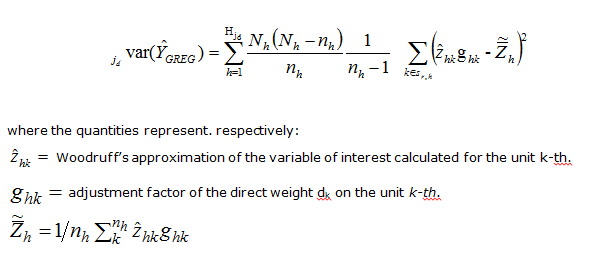
b) Basic formula
c)Main reference in the literature
Särndal. C. E.. Swensson. B. and Wretman. J.. 1992, Model Assisted Survey Sampling, Springer-Verlag, New York.
Särndal. C. E.. Swensson. B. and Wretman. J.. 1989, The weighted residual technique for estimating the variance of the general regression estimator of the finite population total. Biometrika. vol.76. n.3. pp. 527-537.
d)How has the stratification been taken into account?
The estimation of the sampling variance has taken into account sampling design and changes of strata.
e)Which strata have been considered?
Strata are defined as combination of Economic Activities, Size Classes (defined by number of persons employed) and Administrative Regions.
13.3. Non-sampling error
See detailed sections below.
13.3.1. Coverage error
See concept 18.1.1. A) Description of frame population.
13.3.1.1. Over-coverage - rate
The rate of enterprises out of scope is 4%.
13.3.1.2. Common units - proportion
Not requested
13.3.2. Measurement error
No measurement errors were detected.
13.3.3. Non response error
See detailed sections below.
13.3.3.1. Unit non-response - rate
See detailed sub-concepts below.
13.3.3.1.1. Unit response
The following table contains the number of units (i.e. enterprises), by type of response to the survey and by the percentage of these values in relation to the gross sample size.
Type of response
Enterprises
0-9 (or 2-9) employees and self-employed persons
10 or more employees and self-employed persons
Number
%
Number
%
Gross sample size (as in section 3.1 C)
100%
26869
100%
1. Response (questionnaires returned by the enterprise)
18861
70.2%
1.1 Used for tabulation and grossing up (Net sample or Final Sample; as in section 3.1 D)
17789
66.2%
1.2 Not used for tabulation
1072
4%
1.2.1 Out of scope (deaths, misclassified originally in the target population, etc.)
1072
4%
1.2.2 Other reasons (e.g. unusable questionnaire)
0
0%
2. Non-response (e.g. non returned mail, returned mail by post office)
8008
29.8%
Comments on unit response, if unit response is below 60%
13.3.3.1.2. Methods used for minimizing unit non-response
a) activities for preventing unit non-response: to guarantee on statistical confidentiality, written description of survey objectives, special care in writing clear instructions to fill-in questionnaires, establishing telephone numbers and thematic email for further explanations, survey presentation letter signed by Istat’s President or Head of Directorate, to specify that survey is mandatory for enterprises;
b) follow-ups of non-respondent units (reminders by telephone, postal services and e-mailing system);
c) since 2016 usage of centralised contact center that is trained on specific technical topics (usage of FAQ); enterprises can open a 'ticket' to be recontacted by unit involved in the survey for specific and problems directly linked with ICT concepts.
13.3.3.1.3. Methods used for unit non-response treatment
1. No treatment for unit non-response
2. Treatment by re-weighting
2.1 Re-weighting by the sampling design strata considering that non-response is ignorable inside each stratum (the naïve model)
2.2 Re-weighting by identified response homogeneity groups (created using sample-level information)
2.3 Re-weighting through calibration/post-stratification (performed using population information) by the groups used for calibration/post-stratification
X
3. Treatment by imputation (done distinctly for each variable/item)
4. Method(s) and the model(s) corresponding to the above or other method(s) used for the treatment of unit non-response. (e.g. Re-weighting using Horvitz-Thompson estimator, ratio estimator or regression estimator, auxiliary variables)
The method used for treatment considers:
auxiliary variables: no. of enterprises, no. of employed; known totals of auxiliary variables calculated from Italian updated BR (ASIA 2020-ENT);
calibration domains;
in the calibration process distance function used is the raking function, corresponding to the "multiplicative method" of Deville, Särndal, Sautory, 1993; (Ref. Deville, J.C., Särndal, C.E., Sautory, O. - 1993, "Generalized Raking Procedures in Survey Sampling", Journal of the American Statistical Association, Vol. 88, No. 423, pp. 1013-1020)
sigma2 corresponds to no. of persons employed (Sigma2 is the argument used to take into account a possible heteroskedasticity effect in the calibration model; it corresponds to the 1/q_k unit-weights appearing inside the distance measures of Deville, J.C., Särndal, C.E. 1992. (Ref. Deville, J.C., Särndal, C.E. - 1992 "Calibration Estimators in Survey Sampling", Journal of the American Statistical Association, Vol. 87, No. 418, pp. 376-382).
13.3.3.1.4. Assessment of unit non-response bias
Not available.
13.3.3.2. Item non-response - rate
Not available.
13.3.3.2.1. Methods used for item non-response treatment
1. No treatment for item non-response
2. Deductive imputation An exact value can be derived as a known function of other characteristics.
X
3. Deterministic imputation (e.g. mean/median, mean/median by class, ratio-based, regression-based, single donor nearest-neighbour) Deterministic imputation leads to estimators with no random component, that is, if the imputation were to be re-conducted, the outcome would be the same.
X
4. Random imputation (e.g. hot-deck, cold-deck) Random imputation leads to estimators with a random component, that is, if the imputation were re-conducted, it would have led to a different result.
5. Re-weighting
X
6. Multiple imputation In multiple imputation each missing value is replaced (instead of a single value) with a set of plausible values that represent the uncertainty of the right value to impute. Multiple imputation methods offer the possibility of deriving variance estimators by taking imputation into account. The incorporation of imputation into the variance can be easily derived based on variability of estimates among the multiply imputed data sets.
7. Method(s) and the model(s) corresponding to the above or other method(s) used for the treatment of item non-response.
We use the following editing and imputation procedures:
-deterministic error and outlier detection and imputation based on deterministic rules (IF-THEN);
-deterministic imputation based on previous year answers (if possible), median values, re-weighting in case of quantitative variable.
13.3.3.2.2. Questions or items with item response rates below 90% and other comments
Other comments relating to the item non-response
Additional issues concerning "item non-response" calculation (e.g. method used in national publications).
Not available.
Questions and items with low response rates (cut-off value is 90%) and item non-response rate.
Not applicable.
13.3.4. Processing error
No processing errors were detected.
13.3.5. Model assumption error
Not requested
14.1. Timeliness
See detailed section in the Full metadata report.
14.1.1. Time lag - first result
Not applicable
14.1.2. Time lag - final result
Data are to be delivered to Eurostat in the fourth quarter of the reference year (due date for the finalised dataset is 5th October). European results are released before the end of the survey year or in the beginning of the year following the survey year (T=reference year, T+0 for indicators referring to the current year, T+12 months for other indicators referring to the previous year e.g. e-commerce).
At national level:
Data are published nationally in December 2024, the time lag will be T+0 for indicators referring to 2024 (most of variables), T+12 months for indicators referring to 2023 (e.g. e-commerce).
14.2. Punctuality
See detailed section below.
14.2.1. Punctuality - delivery and publication
Data were delivered to Eurostat on 3 October 2024; 2 days before the deadline.
15.1. Comparability - geographical
The model questionnaire is generally used by the countries that conduct the survey on ICT usage and e-commerce in enterprises. Due to (small) differences in translation, in the used survey vehicle, in non-response treatment or different routing through the questionnaire, some results for some countries may be of reduced comparability. In these cases, notes are added in the data.
Detailed information on differences in the wording of the questions in the national questionnaires is available in “ Annex I. Completeness “ - worksheets related to questionnaire, coverage, additional questions.
Comparability between regions:
Data on NUTS 2 regional level were not delivered to Eurostat even if data on regional level were published by Istat.
Detailed information on the provision of data on NUTS 2 regional level is available in “Annex I. Completeness“ – worksheets related to regional data.
15.1.1. Asymmetry for mirror flow statistics - coefficient
Not applicable
15.2. Comparability - over time
See detailed section in the Full metadata report.
15.2.1. Length of comparable time series
The length of comparable time series depends on the module and the variable considered within each survey module. Additional information is available in annexes attached to the European metadata.
No comment at national level, with exception for the fact that introduction of enterprise statistical unit in year 2021 may have an impact on the comparability over time of the results delivered to Eurostat since before year 2021 to 2021 onwards.
15.3. Coherence - cross domain
Not applicable
15.3.1. Coherence - sub annual and annual statistics
Not applicable
15.3.2. Coherence - National Accounts
Not applicable
15.4. Coherence - internal
Not applicable
Restricted from publication
17.1. Data revision - policy
At the moment of publication, the statistics are classified as final so we do not need of any revision policy for ICT survey.
17.2. Data revision - practice
Changes in the methodology used in data collection or in the definition of variables are indicated in a note when data are published.
Corrections are possible in case of relevant errors in collected data, computation errors; in this case it is published a note on the website or on the document with which the corrected data are released.
17.2.1. Data revision - average size
Not requested
18.1. Source data
A) Frame population description and distribution
For more information see concept 18.1.1.
B) Sampling design - Sampling method
Description of the sampling method used (e.g. stratified random sample, quota sampling, cluster sampling; one-stage or two-stage sampling) and information which variables were used to stratify, the categories of those variables, in particular for the NACE Rev. 2 categories related to the "possible calculation of European aggregates", and the final number of strata:
use of stratified random sample for statistical unit Enterprise (Ent), with strata = 35 Nace sectors (see note 1) x 2 ICT sectors (see note 2) x 4 size classes (see note 3) x 21 regions.
The sample allocation is calculated by applying a multivariate and multi-domain technique (Bethel, 1989). The solution is optimal with respect to two variables (see note 4) and four domains (see note 5), by imposing stronger constraints on the expected coefficients of variations for the couple “variable‑domain” than those required.
We take a census of enterprises with at least one of the following conditions: 250 and more persons employed; Nace= 47911; Nace=47 and no. persons employed≥49.5; Ateco=61.
(2) 2 ICT-sectors: 26.1, 26.2, 26.3, 26.4, 26.8, 46.5, 58.2, 61, 62, 63.1 e 95.1; other sectors.
(3) 4 Size classes in terms of persons employed: 10-49;50-99;100-249; ≥250.
(4) The two variables are: number of persons employed and turnover.
(5) The four domains are: 35 Nace sectors; 2 ICT-sectors; 4 major sectors (Industry, Energy, Construction, Services) x 4 size classes; 4 major sectors x 21 regions
C) Gross sample distribution
More detailed information is available in “ Annex III. Sample and standard error tables 2024 “ (Worksheet: GROSS SAMPLE)
D) Net sample distribution
More detailed information is available in “ Annex III. Sample and standard error tables 2024 “ (Worksheet: NET SAMPLE)
18.1.1. Sampling design & Procedure frame
A) Description of frame population
a) When was the sample for the ICT usage and e-commerce in enterprise survey drawn?
April 2024
b) Last update of the Business register that was used for drawing the sample of enterprises for the survey:
June 2023
c) Indication if the frame population is the same as, or is in some way coordinated with, the one used for the Structural Business Statistics (different snapshots):
It is the same
d) Description if different frames are used during different stages of the statistical process (e.g. frame used for sampling vs. frame used for grossing up):
Frame used for sampling (2021) is different from that one used for grossing up (2022)
e) Indication the shortcomings in terms of timeliness (e.g. time lag between last update of the sampling frame and the moment of the actual sampling), geographical coverage, coverage of different subpopulations, data available etc., and any measures taken to correct it, for this survey.
BR is referred to 2021 at the moment of sampling
B) Frame population distribution
More detailed information is available in “ Annex III. Sample and standard error tables 2024 “ (Worksheet: FRAME POPULATION)
18.2. Frequency of data collection
Annual
18.3. Data collection
See detailed sections below.
18.3.1. Survey period
Survey / Collection
Date of sending out questionnaires
Date of reception of the last questionnaire treated
General survey
9 May 2024
18 July 2024
Micro-enterprises
Not applicable
Not applicable
18.3.2. Survey vehicle – general survey
General survey - Stand-alone survey
18.3.3. Survey vehicle – micro-enterprises
Not applicable
18.3.4. Survey type
We have one stand-alone web survey based on self-compilation of web questionnaire (html questionnaire).
Enterprises have possibility to fill online the questionnaire using a web site dedicated to data collection named 'Portale delle imprese' (Business Portal) (website: Imprese istat)
In this Portale, enterprises have one ID and password to view all open/closed surveys in which they are involved and they can delegate specific respondents to answer to one or more surveys, modify own personal details and activity status.
A facsimile of the questionnaire can be downloaded as a pdf from the web site but this form is not accepted for answering.
Since 2024 we have been developing the web model with a platform called Gino.
18.3.5. Survey participation
Mandatory
18.4. Data validation
We use Eurostat Server based EDIT validation.
18.5. Data compilation
Grossing-up procedures
All estimates are obtained on the basis of a final weight for each respondent calculated with calibration weights procedure (calibration estimators)
which guarantees that for given domains of population, the estimates of the total number of enterprises and the total number of persons employed are exactly equal to the known totals
of these two auxiliary variables, coming from the Italian Business Register (ASIA-ENT) - year of reference 2020.
This method reduces the bias caused by the total non response.
The final weight wk is obtained as a product of three factors:
wk = dk g1,k g2,k
where:
dk is the direct weight (the reciprocal of the inclusion probability);
g1,k is the total non-response correcting factor and is equal to nh/mh where nh is the number of sampled units and mh is the number of respondents belonging to the homogeneity group h (defined by cross classifying Nace grouping and size classes of persons employed as recorded in the updated frame);
g2,k is the post-stratification factor.
The software for estimation is a R application developed in ISTAT (ReGenesees - R evolved Generalised software for sampling estimates and errors in surveys; R-based software system for design-based and modelassisted
analysis of complex sample surveys). For documentation on software see following website: ISTAT website - regenesees.
18.5.1. Imputation - rate
Not available.
18.6. Adjustment
Not applicable
18.6.1. Seasonal adjustment
Not applicable
Problems encountered and lessons to be learnt.
19.1. Documents
Questionnaire in national language
x
Questionnaire in English (if available)
National reports on methodology (if available)
Analysis of key results, backed up by tables and graphs in English (if available)
Data on the Information and Communication Technologies (ICT) usage and e-commerce in enterprises are survey data. They are collected by the National Statistical Institutes or Ministries and are in principle based on Eurostat's annual model questionnaires on ICT usage and e-commerce in enterprises.
The legal basis for ICT enterprise statistics for survey year 2024 is Commission Implementing Regulation (EU) 2023/1507 of 20 July 2023 laying down the technical specifications of data requirements for the topic 'ICT usage and e-commerce' for the reference year 2024. Large part of the data collected is used to measure the progress in the implementation of one of the main political priorities of the European Commission for 2019 to 2024 – A Europe fit for the digital age.
Furthermore, ICT data facilitate the monitoring of the EU’s digital targets for 2030, set by the Digital Decade Policy Programme. Four of the key performance indicators (KPIs) of the current programme stem from the statistics for which the implementing and delegated acts are enclosed for adoption: Artificial Intelligence, cloud, big data (data analytics) and the digital intensity index for businesses (DII) - a composite indicator reflecting the digital transformation of business. The aim of the European survey on ICT usage and e-commerce in enterprises is to collect and disseminate harmonised and comparable information at European level.
Name of data collection
Rilevazione sulle tecnologie dell'informazione e della comunicazione nelle imprese
4 March 2025
The model questionnaire on ICT usage and e-commerce in enterprises provides a large variety of variables covering among others the following topics:
Access to and use of the Internet
E-commerce and e-business
ICT specialists and skills
ICT security
Artificial Intelligence.
The annual model questionnaires and the European businesses statistics compliers’ manual for ICT usage and e-commerce in enterprises comprise definitions and explanations regarding the topics of the survey.
Statistical unit used for analysis is the enterprise but the questionnaire is sent to single legal units included in the enterprise as reported by BR on enterprises and BR on legal units
Target Population
As required by Annex of the Commission Implementing Regulation, enterprises with 10 or more employees and self-employed persons are covered by the survey.
For micro-enterprises see the sub-concepts below.
Detailed information on the provision of data on NUTS 2 regional level is available in “Annex I. Completeness“.
All the territory of the country is considered.
The reference periods defined in the model questionnaire are followed in the national survey.
Comments on reliability and representativeness of results and completeness of dataset
These comments reflect overall standard errors reported for the indicators and breakdowns in section 13.2.1 (Sampling error - indicators) and the rest of the breakdowns for national and European aggregates, as well as other accuracy measurements. The estimated standard error should not exceed 2pp for the overall proportions and should not exceed 5pp for the proportions related to the different subgroups of the population (for those NACE aggregates for the calculation and dissemination of national aggregates). If problems were found, these could have implications for future surveys (e.g. need to improve sampling design, to increase sample sizes, to increase the response rates).
More detailed information is available in “ Annex II. Accuracy “ - related to European aggregates, comments on reliability and use of flag.
Percentages of enterprises, Percentages of turnover, Percentages of employees and self-employed persons, Million euro (for selected indicators in some countries).
Grossing-up procedures
All estimates are obtained on the basis of a final weight for each respondent calculated with calibration weights procedure (calibration estimators)
which guarantees that for given domains of population, the estimates of the total number of enterprises and the total number of persons employed are exactly equal to the known totals
of these two auxiliary variables, coming from the Italian Business Register (ASIA-ENT) - year of reference 2020.
This method reduces the bias caused by the total non response.
The final weight wk is obtained as a product of three factors:
wk = dk g1,k g2,k
where:
dk is the direct weight (the reciprocal of the inclusion probability);
g1,k is the total non-response correcting factor and is equal to nh/mh where nh is the number of sampled units and mh is the number of respondents belonging to the homogeneity group h (defined by cross classifying Nace grouping and size classes of persons employed as recorded in the updated frame);
g2,k is the post-stratification factor.
The software for estimation is a R application developed in ISTAT (ReGenesees - R evolved Generalised software for sampling estimates and errors in surveys; R-based software system for design-based and modelassisted
analysis of complex sample surveys). For documentation on software see following website: ISTAT website - regenesees.
A) Frame population description and distribution
For more information see concept 18.1.1.
B) Sampling design - Sampling method
Description of the sampling method used (e.g. stratified random sample, quota sampling, cluster sampling; one-stage or two-stage sampling) and information which variables were used to stratify, the categories of those variables, in particular for the NACE Rev. 2 categories related to the "possible calculation of European aggregates", and the final number of strata:
use of stratified random sample for statistical unit Enterprise (Ent), with strata = 35 Nace sectors (see note 1) x 2 ICT sectors (see note 2) x 4 size classes (see note 3) x 21 regions.
The sample allocation is calculated by applying a multivariate and multi-domain technique (Bethel, 1989). The solution is optimal with respect to two variables (see note 4) and four domains (see note 5), by imposing stronger constraints on the expected coefficients of variations for the couple “variable‑domain” than those required.
We take a census of enterprises with at least one of the following conditions: 250 and more persons employed; Nace= 47911; Nace=47 and no. persons employed≥49.5; Ateco=61.
(2) 2 ICT-sectors: 26.1, 26.2, 26.3, 26.4, 26.8, 46.5, 58.2, 61, 62, 63.1 e 95.1; other sectors.
(3) 4 Size classes in terms of persons employed: 10-49;50-99;100-249; ≥250.
(4) The two variables are: number of persons employed and turnover.
(5) The four domains are: 35 Nace sectors; 2 ICT-sectors; 4 major sectors (Industry, Energy, Construction, Services) x 4 size classes; 4 major sectors x 21 regions
C) Gross sample distribution
More detailed information is available in “ Annex III. Sample and standard error tables 2024 “ (Worksheet: GROSS SAMPLE)
D) Net sample distribution
More detailed information is available in “ Annex III. Sample and standard error tables 2024 “ (Worksheet: NET SAMPLE)
Annual
See detailed section in the Full metadata report.
The model questionnaire is generally used by the countries that conduct the survey on ICT usage and e-commerce in enterprises. Due to (small) differences in translation, in the used survey vehicle, in non-response treatment or different routing through the questionnaire, some results for some countries may be of reduced comparability. In these cases, notes are added in the data.
Detailed information on differences in the wording of the questions in the national questionnaires is available in “ Annex I. Completeness “ - worksheets related to questionnaire, coverage, additional questions.
Comparability between regions:
Data on NUTS 2 regional level were not delivered to Eurostat even if data on regional level were published by Istat.
Detailed information on the provision of data on NUTS 2 regional level is available in “Annex I. Completeness“ – worksheets related to regional data.