|
|
|
||||||||||||||||||||||||||||||||||||||||||||||||||||||||||||||||||||||||||||||||||||||||||||||||||||||||
| For any question on data and metadata, please contact: Eurostat user support |
|
|||
| 1.1. Contact organisation | Eurostat, the statistical office of the European Union |
||
| 1.2. Contact organisation unit | Unit E1: Agriculture and fisheries |
||
| 1.5. Contact mail address | |||
|
||||||||||||||||||||
In the following paragraphs the main statistical definitions as well as the coverage boundaries of the data collection are identified. Although the definitions are defined in the Landings regulation there are cases in which the national practice differs from the standard definition. Deviations from statistical classification, unit definition or geographical coverage might cause issues in terms of data comparability. |
||||||||||||||||||||
| 2.1. Data description | ||||||||||||||||||||
The Landings regulation requires the countries to submit statistical data on total quantities and unit values of the fishery products landed in their ports split by the nationality of the vessel and by the presentation and the intended use of the product. The countries are required to provide the data on annual basis within six months after the end of the reference calendar year. Eurostat produces landing statistics on the basis of the national figures. |
||||||||||||||||||||
| 2.2. Classification system | ||||||||||||||||||||
Data are broken down by: 1) species of aquatic organisms identified using the 3-alpha codes as defined by the FAO (ASFIS List of Species for Fishery Statistics Purposes); 2) flag state of the fishing vessels carrying out landings (Annex II to the Regulation); 3) ‘presentation’ of the products i.e. processed state of the fisheries product or part thereof e.g. fresh fillets, frozen headed and gutted, smoked, etc. (Annex III to the Regulation); 4) intended use of the products i.e. how landed fish are intended to be used e.g. for human consumption, industrial uses, bait, etc. (Annex IV to the Regulation). |
||||||||||||||||||||
| 2.3. Coverage - sector | ||||||||||||||||||||
Fishery products (NACE classification 03.11 Marine fishing) landed on the country territory by the EU/EFTA States vessels. The landings by national vessels in non-EU/non-EEA country are also included in case landings are transported further to the EU/EEA countries. |
||||||||||||||||||||
| 2.4. Statistical concepts and definitions | ||||||||||||||||||||
For the purposes of this Regulation, the following definitions shall apply1: 1) ‘Community fishing vessels’ means fishing vessels flying the flag of a Member State and registered in the Community; 2) ‘EFTA fishing vessels’ means fishing vessels flying the flag of, or registered in, an EFTA country 3) ‘Unit value’ means: I. the value at first sale of the fishery products landed (in national currency) divided by the quantity landed (in tonnes), or II. for fishery products not immediately sold, the average price per tonne in national currency, estimated using an appropriate method figures. 4) Landed quantities are expressed in Tonnes Product Weight (TPW). 5) Unit values are reported as unit price in national currency per tonne.
[1] A broader glossary with definitions related to the Fisheries Statistics is available on: https://ec.europa.eu/eurostat/statistics-explained/index.php?title=Category:Fisheries_glossary |
||||||||||||||||||||
| 2.5. Statistical unit | ||||||||||||||||||||
The basic statistical units are the individual fishing vessels. This definition applies to most reporting countries with the exception of:
Table 2 Statistical units - exceptions to the standard definition
|
||||||||||||||||||||
| 2.6. Statistical population | ||||||||||||||||||||
All vessels registered to the reporting country or to other/EFTA country landing fishery products in the ports of the reporting country. By analysing the definitions reported in the NQRs they appear mostly in line with the Regulation, the only exceptions are the definitions reported by Denmark and Romania where it is not clearly stated whether they also include in their data collection landings from non EU/EFTA vessels:
Table 3 Statistical population - exceptions to the standard definition
|
||||||||||||||||||||
| 2.7. Reference area | ||||||||||||||||||||
The reference area is aggregated into 2 categories: the geographical area of the country concerned and the eventual special member state territory(-ies) included. The analysis of the geographical reference area on the NQR provided the following results:
Table 4 Geographical area covered - exceptions to the standard definition
With regards to the special territories, following special territories are included:
Table 5 Countries reporting special territories
|
||||||||||||||||||||
| 2.8. Coverage - Time | ||||||||||||||||||||
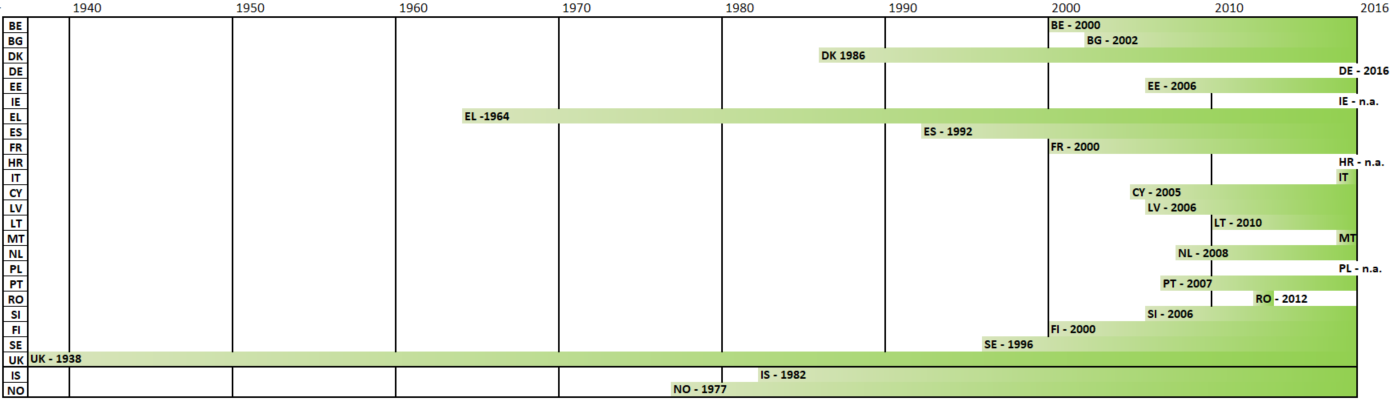
The length of the time series of the landings statistics varies as shown in Table 6.
Table 6 Time coverage for landings statistics
The country with the longest time series of data is the UK where the collection of landings statistics started in 1938, followed by EL (1964), NO (1977) IS (1982), and DK (1986). |
||||||||||||||||||||
| 2.9. Base period | ||||||||||||||||||||
not applicable |
||||||||||||||||||||
|
||||||||||||||||||||||||||||||||||||||||||||||||||||||||||||||||||||||||||||||||||||||||||||||
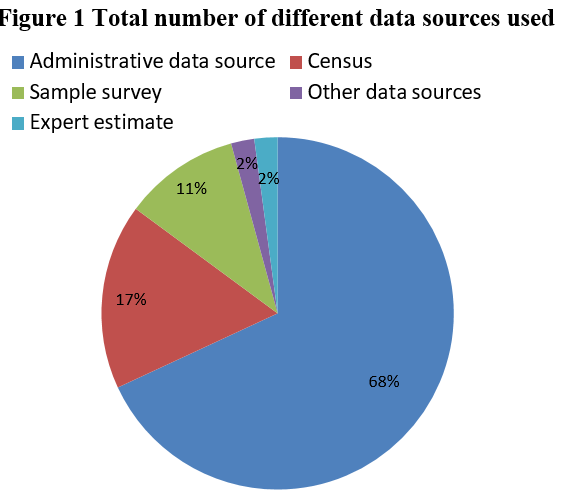
The statistical data on landings of fishery products are based on an array of data sources. The quality report provides the following set of sources as possible options: - Administrative data; - Census; - Sample surveys; - Expert(s) estimate(s); - Other data sources. |
||||||||||||||||||||||||||||||||||||||||||||||||||||||||||||||||||||||||||||||||||||||||||||||
| 3.1. Source data | ||||||||||||||||||||||||||||||||||||||||||||||||||||||||||||||||||||||||||||||||||||||||||||||
The countries reported in total 47 different sources. Around 68% of data are collected from administrative sources, 17% from censuses, followed by information collected via sample surveys. Other sources as well as expert estimate contribute to a lesser extent (Figure 1).
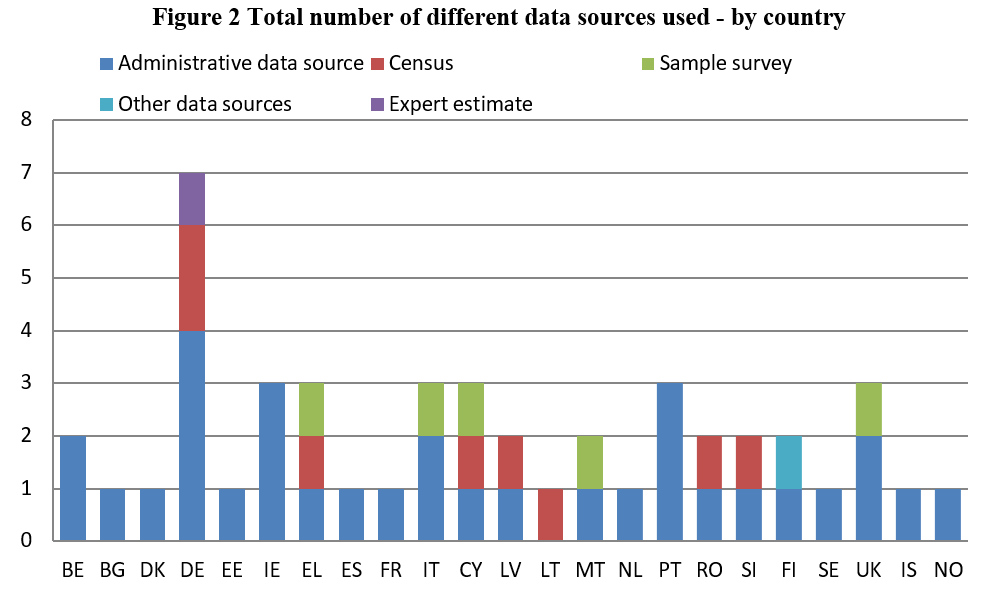
The number and type of sources reported by the countries are displayed in Figure 2. The number of sources per country varied from 1 source to 7 in Germany2. The countries reported on average 2.04 data sources per country. The figures are not always necessary fully comparable as it is not always easy to share the same perception of what a data source is. A detailed list of data sources is in Annex 1.
3.1.1. Administrative data sourcesAdministrative data sources are the most used type of data source: amongst the 23 countries, only Lithuania did not report any administrative data source. The main administrative sources by country are listed in Table 7. Even if in some countries more than one administrative data source was used, in the NQR it is asked to provide the information of the main one.
Table 7 Name of the administrative sources by country
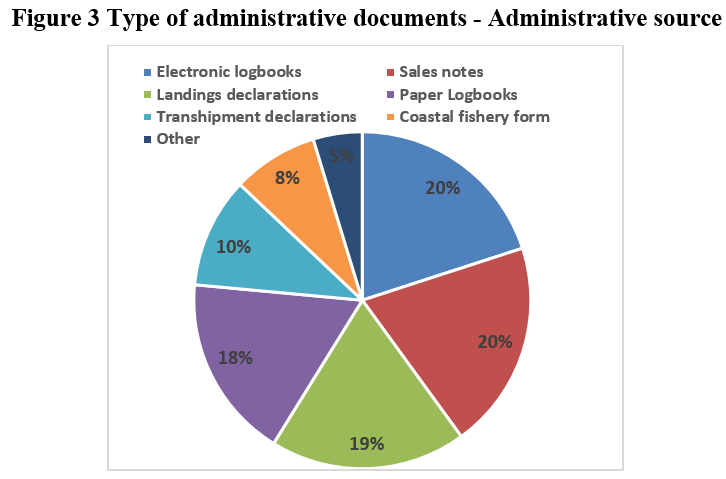
3.1.1.1 Type of administrative data source used
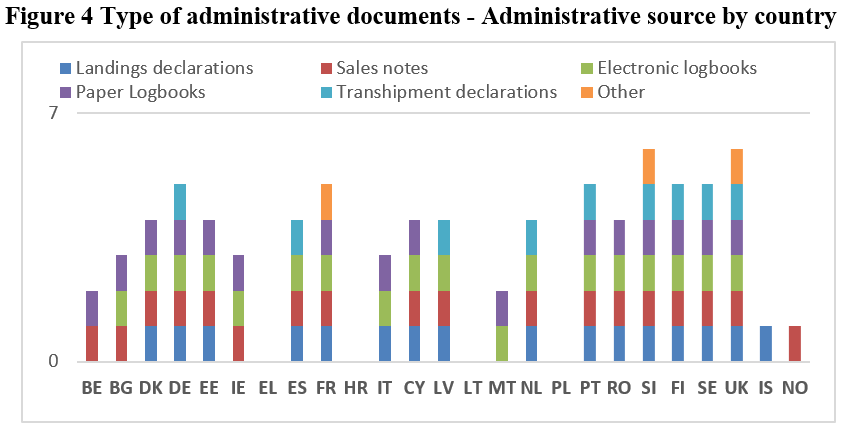
Electronic logbooks together with sales notes are the most common type used in 20% of the cases, followed by landings declarations (19%) and paper logbooks (18%) (Figure 3). Transhipment declarations, coastal forms and other documents are less commonly used.
The breakdown by type of document by country is presented in Figure 4.
3.1.1.2 Administrative source - Accordance with the current EU Regulation
All countries declared that the data are collected in accordance with the rules set in the current EU Regulations (EC) 1224/2009 and (EU) 404/2011 for each of the fleet segments. Apparently national practices are in line with the EU rules.
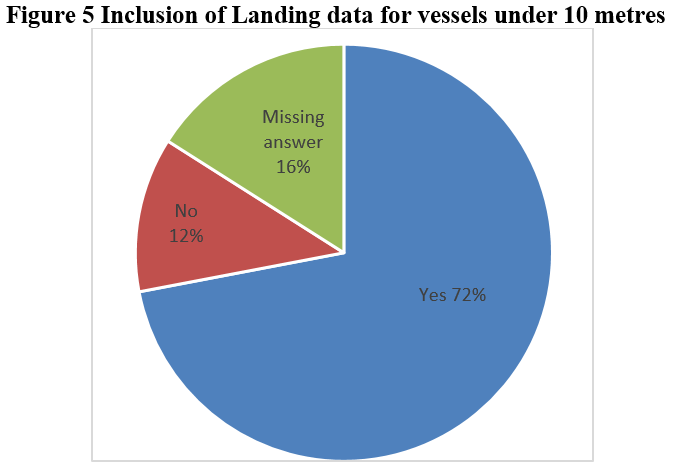
3.1.1.3 Administrative source – Size of the vessels
The majority of the countries include vessels shorter than 10 meters into their data collection (57%).
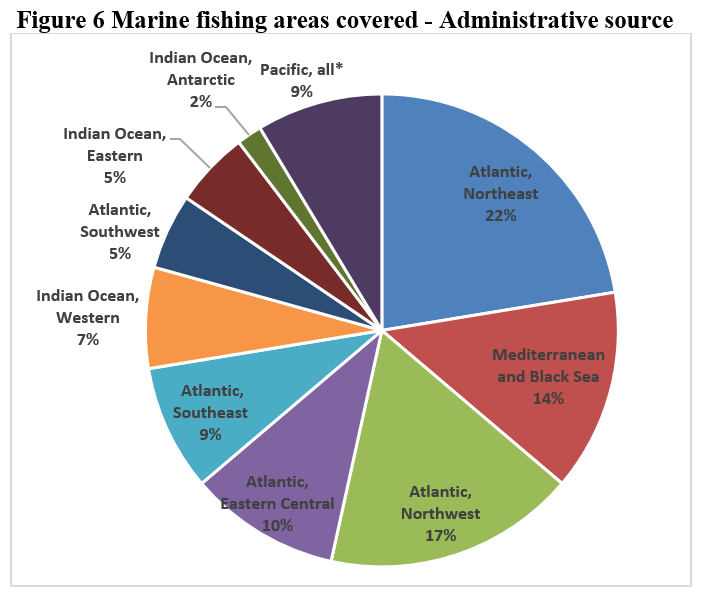
3.1.1.4 Administrative source - Marine fishing areas covered
Data from the administrative sources also include information on the marine fishing areas covered by the national data. Most countries cover the maritime areas of: Atlantic, Northeast (22%), Atlantic, Northwest (17%), Mediterranean and Black Sea (14%), Atlantic, Eastern Central (10%) (Figure 6). All other marine fishing areas are covered by less than 10% of countries.
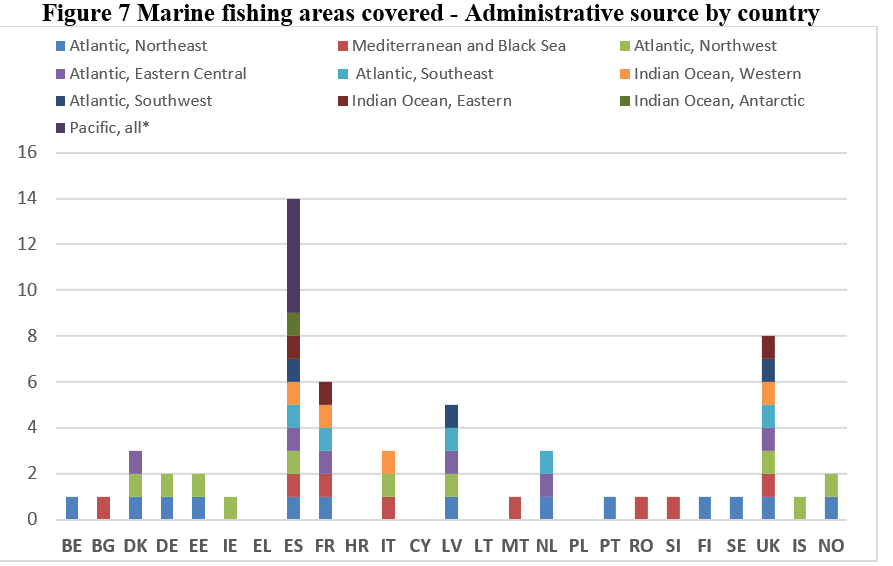
The breakdown of marine areas covered by each of the countries is presented in Figure 7:
Spain with 14 fishing regions covers the largest number of fishing marine areas (including all Pacific areas), followed by the United Kingdom. EL, CY, HR, LT and PL did not provide details on the marine fishing areas covered by their data collections
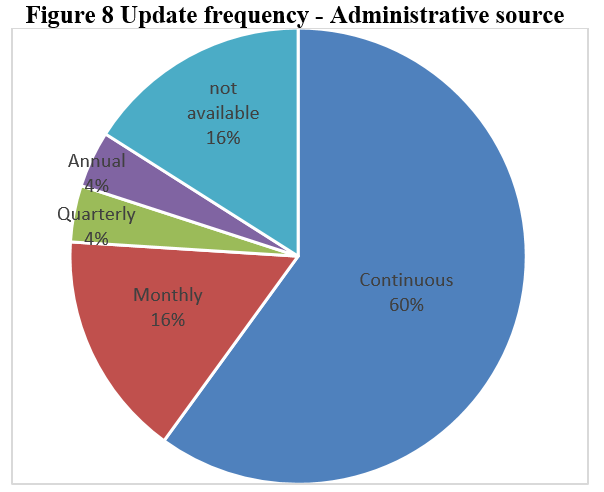
3.1.1.5 Administrative sources - Update frequencyThe update frequency of the administrative sources varies considerably (Figure 8). Half of countries reported a continuous update of the administrative sources (60%); 16% of countries update their data on monthly basis, lower percentages are reported for quarterly and annual updates (4% of cases, respectively). One third of the countries (16%) left this question unanswered.
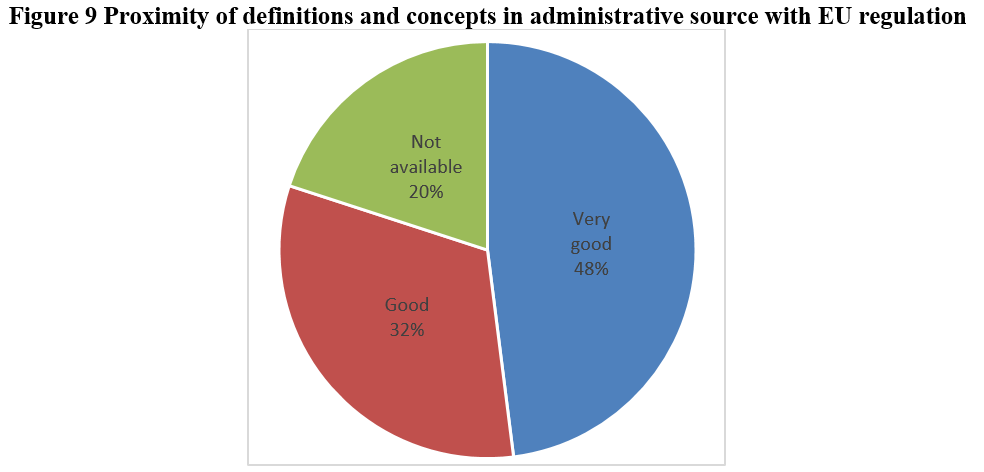
3.1.1.6 Administrative source - Proximity of definitions and concepts in administrative source with EU regulation
Most countries reported a “very good” level (48%) or good level (32%) when asked on the proximity of definitions and concepts in administrative source with the EU regulation. 20% of countries did not answer the question (Figure 9).
Countries were asked to provide details about the eventual differences between administrative source and statistical definitions and concepts.
Four countries provided some examples of such discrepancies: - DK : Sampling; - EE; administrative; - IE Some differences in FAO code uses (e.g. ANF is generally used for all anglerfish); - IT: Source of information
3.1.2. CensusCensus is used in 7 countries.
3.1.2.1. Name and scope of the national census data sourcesThe names and scopes of the national censuses on landings of fishery products are indicated in Table 8. Table 8 Names and main scopes of the census sources on landings of fishery products
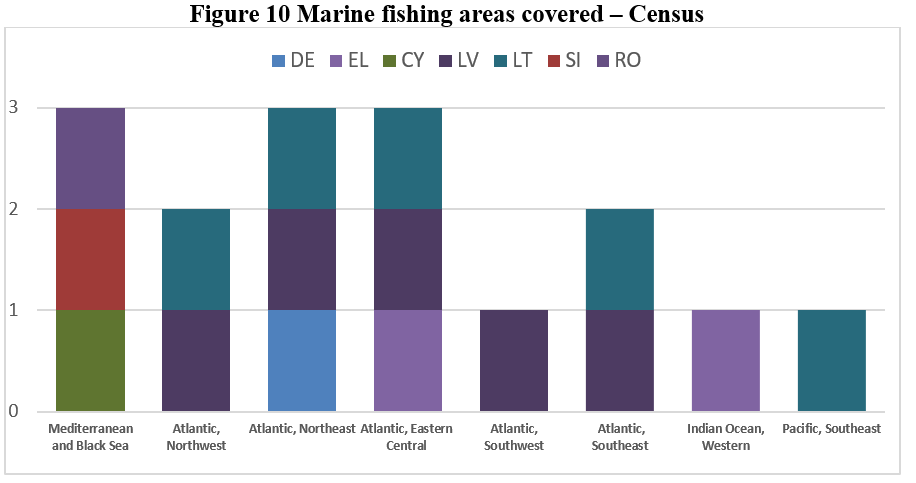
3.1.2.2. Marine fishing areas covered – CensusThe marine fishing areas covered by the censuses are illustrated in Figure 10.
3.1.3. Sample surveysSample surveys have been indicated to be part of the data sources in 5 countries. 3.1.3.1. Sample surveys - Population size and sample sizeTable 9 indicates the population and sample sizes used by the countries in sample surveys. Table 9 Population size and sample size
3.1.3.2. Sampling basis and sampling designTable 12 illustrates other details concerning the sample surveys. All countries report to have a “list” as sampling basis. The majority of the countries use a stratified sample design (EL, IT, MT), while Cyprus uses a random sampling. In Italy the sample survey is specified to be multivariate.
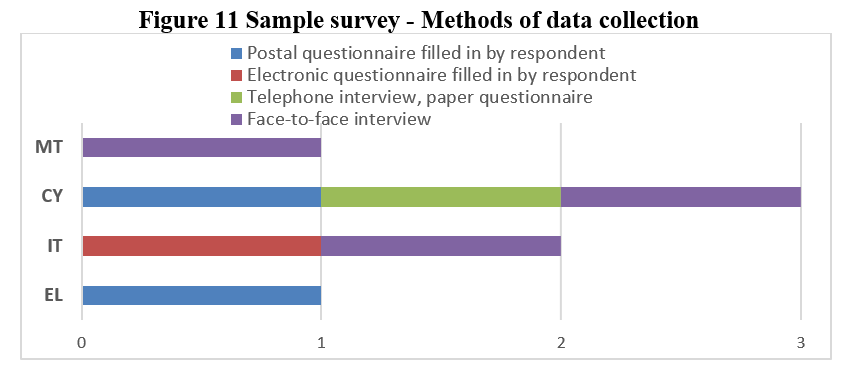
3.1.3.3. Sample survey -Methods of data collectionSeveral data collection methods are used in the sample surveys by the countries (Figure 11)
3.1.4.Expert estimates
Expert estimates are used for statistical data on landings of fishery products only in Germany.
[2] DE reported 2 sources in question 3.1.1 “Total number of different data sources”; this amount is inconsistent with the sum of the figures provided for the sources 3.1.2 “Census” (2), 3.1.4 “Administrative” (4) and 3.1.5 “Experts” (1). |
||||||||||||||||||||||||||||||||||||||||||||||||||||||||||||||||||||||||||||||||||||||||||||||
| 3.2. Frequency of data collection | ||||||||||||||||||||||||||||||||||||||||||||||||||||||||||||||||||||||||||||||||||||||||||||||
| Restricted from publication | ||||||||||||||||||||||||||||||||||||||||||||||||||||||||||||||||||||||||||||||||||||||||||||||
| 3.3. Data collection | ||||||||||||||||||||||||||||||||||||||||||||||||||||||||||||||||||||||||||||||||||||||||||||||
| Restricted from publication | ||||||||||||||||||||||||||||||||||||||||||||||||||||||||||||||||||||||||||||||||||||||||||||||
| 3.4. Data validation | ||||||||||||||||||||||||||||||||||||||||||||||||||||||||||||||||||||||||||||||||||||||||||||||
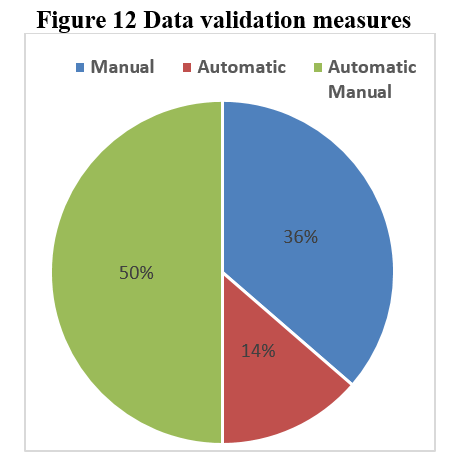
21 countries reported that the data are validated before the transmission to Eurostat. The logical consistency of the data is checked. The validation is done both manually and automatically. The combination of automatic and manual measures was the most used validation procedure utilised by 50% of the countries (Figure 12).
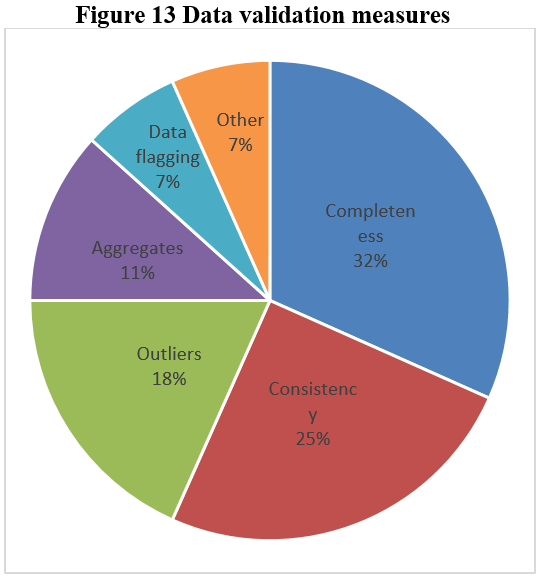
3.2.1. Data validation targetsData validation rules implemented by the countries can target several aspects of the data quality: - Completeness; - Consistency; - Outliers; - Aggregates; - Data flagging. The criteria targeted by the countries are predominantly completeness (32%), consistency (25%) and outliers (18%) (Figure 13).
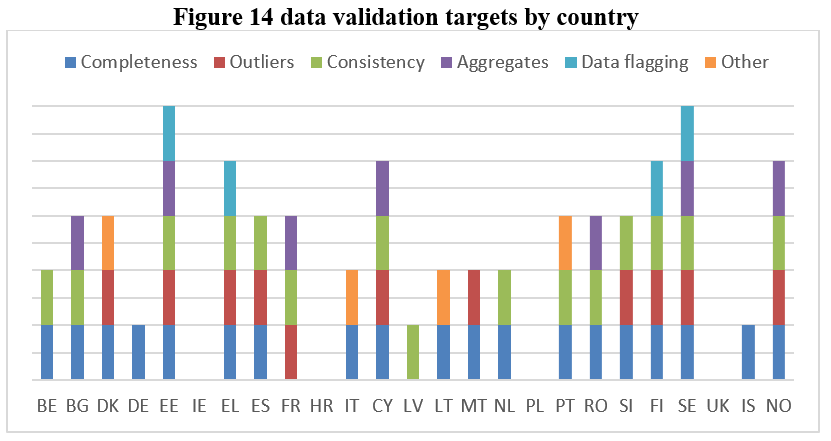
The mix of criteria targeted as well as the number of data validation targets vary between the countries, as shown in Figure 14.
|
||||||||||||||||||||||||||||||||||||||||||||||||||||||||||||||||||||||||||||||||||||||||||||||
| 3.5. Data compilation | ||||||||||||||||||||||||||||||||||||||||||||||||||||||||||||||||||||||||||||||||||||||||||||||
| Restricted from publication | ||||||||||||||||||||||||||||||||||||||||||||||||||||||||||||||||||||||||||||||||||||||||||||||
| 3.6. Adjustment | ||||||||||||||||||||||||||||||||||||||||||||||||||||||||||||||||||||||||||||||||||||||||||||||
| Restricted from publication | ||||||||||||||||||||||||||||||||||||||||||||||||||||||||||||||||||||||||||||||||||||||||||||||
|
||||||||||||||||||||||||||||||||||||||||||||||||||||||||||||||||||||||||||||||||||||||||||||||||||||||||||||||||||||||||||||||||||||||||||||||||||||||||||||||||||||||||||||||||||||||||||||||||||||||||||||||||||||||||
The quality management section is assessed with the analysis of two main aspects: quality assurance and quality assessment. |
||||||||||||||||||||||||||||||||||||||||||||||||||||||||||||||||||||||||||||||||||||||||||||||||||||||||||||||||||||||||||||||||||||||||||||||||||||||||||||||||||||||||||||||||||||||||||||||||||||||||||||||||||||||||
| 4.1. Quality assurance | ||||||||||||||||||||||||||||||||||||||||||||||||||||||||||||||||||||||||||||||||||||||||||||||||||||||||||||||||||||||||||||||||||||||||||||||||||||||||||||||||||||||||||||||||||||||||||||||||||||||||||||||||||||||||
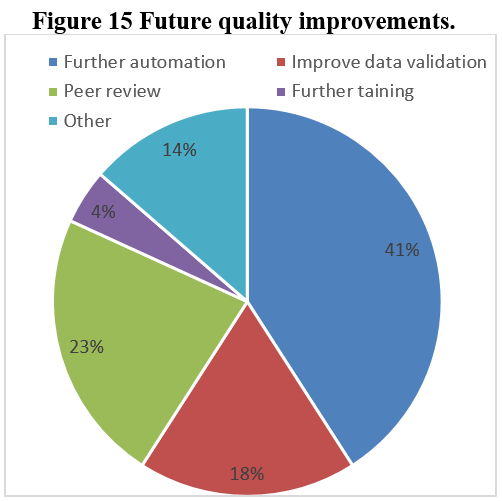
58% of the countries reported that they have a quality management system for landings statistics and 34% did not, while 8% of the countries (namely Croatia and Poland) did not answer the question. 31% of countries declared that a peer review has been already carried out, against 61% which answered no, and 8% of the countries (HR, PL) which did not respond. The future quality improvement actions envisaged are reported in Figure 15. Further automation is envisaged to take place in 41% of the countries, peer review and improvement of data validation are foreseen in 23% and 18% of the countries respectively; other improvements are foreseen in 14% responses.
Other quality management improvements are indicated in Table 10. Table 10 Specifications on quality management improvement
|
||||||||||||||||||||||||||||||||||||||||||||||||||||||||||||||||||||||||||||||||||||||||||||||||||||||||||||||||||||||||||||||||||||||||||||||||||||||||||||||||||||||||||||||||||||||||||||||||||||||||||||||||||||||||
| 4.2. Quality management - assessment | ||||||||||||||||||||||||||||||||||||||||||||||||||||||||||||||||||||||||||||||||||||||||||||||||||||||||||||||||||||||||||||||||||||||||||||||||||||||||||||||||||||||||||||||||||||||||||||||||||||||||||||||||||||||||
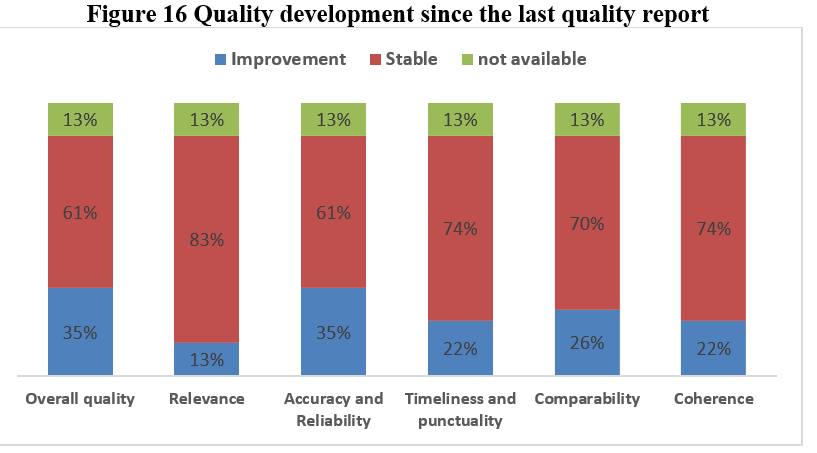
35% of the countries have indicated that the overall quality of landings statistics has improved since the last quality report (three years ago). Figure 16 shows an overall situation of the quality improvements.
Accuracy and reliability (35%), followed by comparability (26%) recorded the highest improvement shares. Table 11 provides the country specific details.
Table 11 Evolution of the quality of the landings statistics
More information on the quality management can be found in section 4 of the national quality reports.
[1]With reference to the Efficiency gains, Slovenia declared that quality of this data delivery was stable compared to previous delivery because major quality improvements were already previously achieved. |
||||||||||||||||||||||||||||||||||||||||||||||||||||||||||||||||||||||||||||||||||||||||||||||||||||||||||||||||||||||||||||||||||||||||||||||||||||||||||||||||||||||||||||||||||||||||||||||||||||||||||||||||||||||||
|
|||||||||||||||||||||||||||||||||||||||||||||||||||||||||||||||
The relevance is analysed in the quality report through user needs, the user satisfaction and data completeness. |
|||||||||||||||||||||||||||||||||||||||||||||||||||||||||||||||
| 5.1. Relevance - User Needs | |||||||||||||||||||||||||||||||||||||||||||||||||||||||||||||||
The user needs are assessed by monitoring if there are any unmet user needs. The analysis reveals that user needs are generally well met. The only exception is Ireland where “data protection” and “resources” are identified as unmet user needs. |
|||||||||||||||||||||||||||||||||||||||||||||||||||||||||||||||
| 5.2. Relevance - User Satisfaction | |||||||||||||||||||||||||||||||||||||||||||||||||||||||||||||||
In order to measure the user satisfaction four countries have carried out user satisfaction surveys (EE, EL, MT and UK) (Figure 15). According to such surveys, users are generally satisfied with the landings statistics (highly satisfied in EL). In Estonia such surveys are conducted annually.
Table 12 User satisfaction surveys.
|
|||||||||||||||||||||||||||||||||||||||||||||||||||||||||||||||
| 5.3. Completeness | |||||||||||||||||||||||||||||||||||||||||||||||||||||||||||||||
The completeness of the final data on landings for year 2016 has been analysed. The overall completeness rate of data was 93%. The completeness rate is indicated in Table 13. The possible reasons lowering data completeness are several: difficulties in calculation/estimation of prices, measurement of error, coverage, non-response error, etc.
Table 13 Data completeness rates
|
|||||||||||||||||||||||||||||||||||||||||||||||||||||||||||||||
| 5.3.1. Data completeness - rate | |||||||||||||||||||||||||||||||||||||||||||||||||||||||||||||||
| Restricted from publication | |||||||||||||||||||||||||||||||||||||||||||||||||||||||||||||||
|
|||||||||||||||||||||||||||||||||||||||||||||||||||||||
| 6.1. Accuracy - overall | |||||||||||||||||||||||||||||||||||||||||||||||||||||||
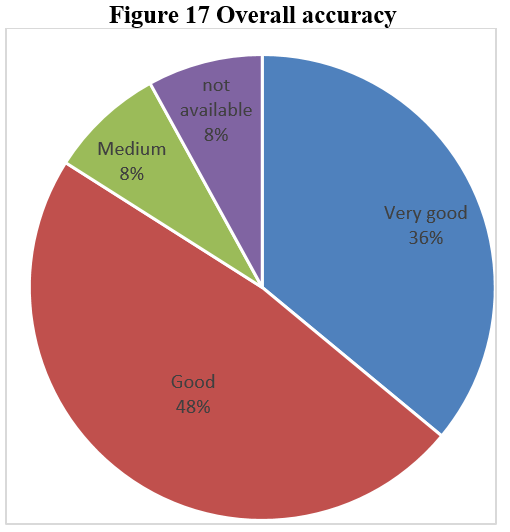
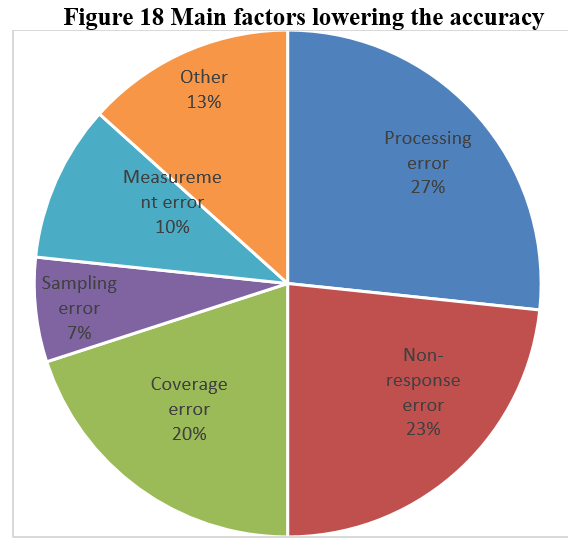
The accuracy was assessed to be very good in 36% of the countries, good in 48% and medium in 8%. Another 8% of countries (HR, PL) did not answer the question. Figure 18 illustrates the factors lowering the accuracy of landings statistics: processing error (27%) and non-response errors (23%) are the main factors influencing negatively the overall accuracy, followed by coverage errors (20%), measurement and sampling errors (10% and 7% respectively).
|
|||||||||||||||||||||||||||||||||||||||||||||||||||||||
| 6.2. Sampling error | |||||||||||||||||||||||||||||||||||||||||||||||||||||||
Figures on sampling error are reported in Table 16: Greece and Cyprus used the ‘comparisons with other sources” and Italy and Malta used the ‘relative standard error” to assess the sampling error. The most common method used to derive the extrapolation factor was the basic weight (together with the non-response in Cyprus). |
|||||||||||||||||||||||||||||||||||||||||||||||||||||||
| 6.2.1. Sampling error - indicators | |||||||||||||||||||||||||||||||||||||||||||||||||||||||
| Restricted from publication | |||||||||||||||||||||||||||||||||||||||||||||||||||||||
| 6.3. Non-sampling error | |||||||||||||||||||||||||||||||||||||||||||||||||||||||
The non-sampling error analysis is done for a set of parameters: - Coverage error (for census, sample surveys and administrative data); - Measurement error (for census and sample surveys); - Non-response error (for census and sample surveys); - Processing error (for census and sample surveys); - Model assumption error (for census and sample surveys). Coverage, measurement and non-response errors will be analysed in the following sections of the document. |
|||||||||||||||||||||||||||||||||||||||||||||||||||||||
| 6.3.1. Coverage error | |||||||||||||||||||||||||||||||||||||||||||||||||||||||
The countries reported that there is no bias caused by coverage errors. |
|||||||||||||||||||||||||||||||||||||||||||||||||||||||
| 6.3.1.1. Over-coverage - rate | |||||||||||||||||||||||||||||||||||||||||||||||||||||||
| Restricted from publication | |||||||||||||||||||||||||||||||||||||||||||||||||||||||
| 6.3.1.2. Common units - proportion | |||||||||||||||||||||||||||||||||||||||||||||||||||||||
| Restricted from publication | |||||||||||||||||||||||||||||||||||||||||||||||||||||||
| 6.3.2. Measurement error | |||||||||||||||||||||||||||||||||||||||||||||||||||||||
Table 14 and Table 15 illustrate the actions taken in order to prevent measurement errors in census and sample surveys respectively.
Table 14 Actions taken to prevent the measurement errors - Census
In general terms it can be stated that the use of electronic forms, which has become more popular, reduces the number of measurement errors. Most of the surveys have a long history with the same questionnaire. This also decreases the measurement errors which tend to be more frequent if the survey or the questionnaire is new to the respondents/surveyors; on average the number of years in use of the questionnaire is quite long. Almost all countries have explanatory documents at the disposal of the surveyors and respondents but helpdesks, FAQ and hotlines are scarcely used. Table 15 Actions taken to prevent the measurement errors - Sample surveys
|
|||||||||||||||||||||||||||||||||||||||||||||||||||||||
| 6.3.3. Non response error | |||||||||||||||||||||||||||||||||||||||||||||||||||||||
The unit level non-response is in most countries 0%. Table 16 Unit level non-response rates - Census
Most countries take actions to reduce the non-response rate such as follow-up interviews, reminders, imputations and legal actions. The non-response errors are also assessed for the sample surveys (Table 17). Countries which have responded to this question declared unit non-response rates of a maximum of 5% (Italy). The measures adopted to reduce non-response rates are different for each country. Table 17 Unit level non-response rates Sample Survey
|
|||||||||||||||||||||||||||||||||||||||||||||||||||||||
| 6.3.3.1. Unit non-response - rate | |||||||||||||||||||||||||||||||||||||||||||||||||||||||
| Restricted from publication | |||||||||||||||||||||||||||||||||||||||||||||||||||||||
| 6.3.3.2. Item non-response - rate | |||||||||||||||||||||||||||||||||||||||||||||||||||||||
| Restricted from publication | |||||||||||||||||||||||||||||||||||||||||||||||||||||||
| 6.3.4. Processing error | |||||||||||||||||||||||||||||||||||||||||||||||||||||||
| Restricted from publication | |||||||||||||||||||||||||||||||||||||||||||||||||||||||
| 6.3.4.1. Imputation - rate | |||||||||||||||||||||||||||||||||||||||||||||||||||||||
| Restricted from publication | |||||||||||||||||||||||||||||||||||||||||||||||||||||||
| 6.3.5. Model assumption error | |||||||||||||||||||||||||||||||||||||||||||||||||||||||
Not applicable |
|||||||||||||||||||||||||||||||||||||||||||||||||||||||
| 6.4. Seasonal adjustment | |||||||||||||||||||||||||||||||||||||||||||||||||||||||
Not applicable |
|||||||||||||||||||||||||||||||||||||||||||||||||||||||
| 6.5. Data revision - policy | |||||||||||||||||||||||||||||||||||||||||||||||||||||||
Data revision policies are illustrated in Table 18. Table 18 Data revision – policy
|
|||||||||||||||||||||||||||||||||||||||||||||||||||||||
| 6.6. Data revision - practice | |||||||||||||||||||||||||||||||||||||||||||||||||||||||
Data revisions have not been a common practice in the countries (Table 23). Nevertheless there are some cases in which some revision occurred, namely in EL, IT, CY and NL. The reasons pointed out by the countries were: rationalisation of codes of species, increase of information from foreign vessels as well as corrections of primary data from administrative sources. The impact of these revisions was considered important in Greece and in the Netherlands (it affected 1% of total landing volume). Table 19 Data revision – practice.
|
|||||||||||||||||||||||||||||||||||||||||||||||||||||||
| 6.6.1. Data revision - average size | |||||||||||||||||||||||||||||||||||||||||||||||||||||||
not applicable |
|||||||||||||||||||||||||||||||||||||||||||||||||||||||
|
||||||||||||||||||||||||||||||||||||||||||||||||||||||||||||||||||||||||||||||||
| 7.1. Timeliness | ||||||||||||||||||||||||||||||||||||||||||||||||||||||||||||||||||||||||||||||||
Regulation (EC) No 1921/2006 sets up the data transmission calendar for landings statistics. According to the figures in DK, IE and CY there is no time lag between initial and final results of data transmission. The estimated time lag is of 2 weeks in BE, 1 month in EE and DE, ~100 days in EL, 4 months in FI, 6 months in SE, 9 in ES, LV and UK, 1 year in IT and PT (Table 20). The main reasons for the time lag are data quality checks, validation and data cleaning. Table 20 Timeliness of data
|
||||||||||||||||||||||||||||||||||||||||||||||||||||||||||||||||||||||||||||||||
| 7.1.1. Time lag - first result | ||||||||||||||||||||||||||||||||||||||||||||||||||||||||||||||||||||||||||||||||
| Restricted from publication | ||||||||||||||||||||||||||||||||||||||||||||||||||||||||||||||||||||||||||||||||
| 7.1.2. Time lag - final result | ||||||||||||||||||||||||||||||||||||||||||||||||||||||||||||||||||||||||||||||||
| Restricted from publication | ||||||||||||||||||||||||||||||||||||||||||||||||||||||||||||||||||||||||||||||||
| 7.2. Punctuality | ||||||||||||||||||||||||||||||||||||||||||||||||||||||||||||||||||||||||||||||||
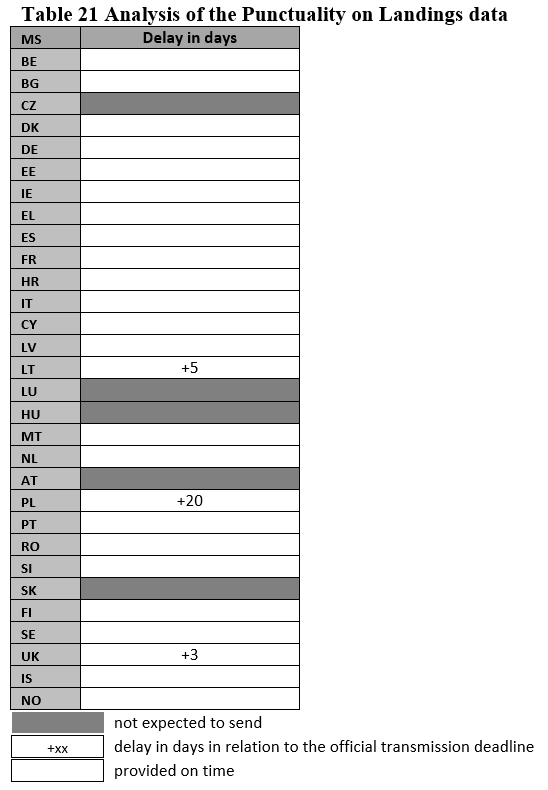
The punctuality of the data transmissions is assessed by Eurostat on the basis of received transmissions in EDAMIS. The assessment is done for the transmissions linked to reference year 2016 (Table 21).
|
||||||||||||||||||||||||||||||||||||||||||||||||||||||||||||||||||||||||||||||||
| 7.2.1. Punctuality - delivery and publication | ||||||||||||||||||||||||||||||||||||||||||||||||||||||||||||||||||||||||||||||||
| Restricted from publication | ||||||||||||||||||||||||||||||||||||||||||||||||||||||||||||||||||||||||||||||||
|
|||||||||||||||||||||||||||||||||||||||||||||
| 8.1. Comparability - geographical | |||||||||||||||||||||||||||||||||||||||||||||
not applicable |
|||||||||||||||||||||||||||||||||||||||||||||
| 8.1.1. Asymmetry for mirror flow statistics - coefficient | |||||||||||||||||||||||||||||||||||||||||||||
not applicable |
|||||||||||||||||||||||||||||||||||||||||||||
| 8.2. Comparability - over time | |||||||||||||||||||||||||||||||||||||||||||||
The comparability of the landings statistics over time is good, in particular since 2006 when Regulation (EC) No 1921/2006 came into force. Indeed only Greece, the Netherlands and Slovenia reported about breaks in the time-series in the last few years (Table 22). Table 22 Breaks in time-series
|
|||||||||||||||||||||||||||||||||||||||||||||
| 8.2.1. Length of comparable time series | |||||||||||||||||||||||||||||||||||||||||||||
| Restricted from publication | |||||||||||||||||||||||||||||||||||||||||||||
| 8.3. Coherence - cross domain | |||||||||||||||||||||||||||||||||||||||||||||
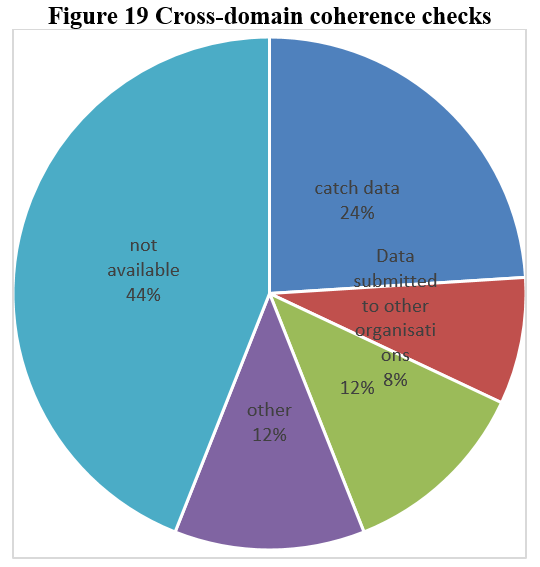
The importance of the cross-domain coherence has been stressed by Eurostat. 14 countries indicated some sort of cross-domain coherence check, the majority of them indicated that they made cross-domain checks with catch data (24%), data submitted to other organisations (8%), while 12% countries compute 2 different kinds of checks, with catch data and other data and another 12% compare the landings data with other data sources. (Figure 19). 44% of the countries did not provide an answer.
The cross-checks accomplished by the countries are detailed in Table 23.
Table 23 Cross-domain coherence
|
|||||||||||||||||||||||||||||||||||||||||||||
| 8.4. Coherence - sub annual and annual statistics | |||||||||||||||||||||||||||||||||||||||||||||
| Restricted from publication | |||||||||||||||||||||||||||||||||||||||||||||
| 8.5. Coherence - National Accounts | |||||||||||||||||||||||||||||||||||||||||||||
| Restricted from publication | |||||||||||||||||||||||||||||||||||||||||||||
| 8.6. Coherence - internal | |||||||||||||||||||||||||||||||||||||||||||||
| Restricted from publication | |||||||||||||||||||||||||||||||||||||||||||||
|
|||
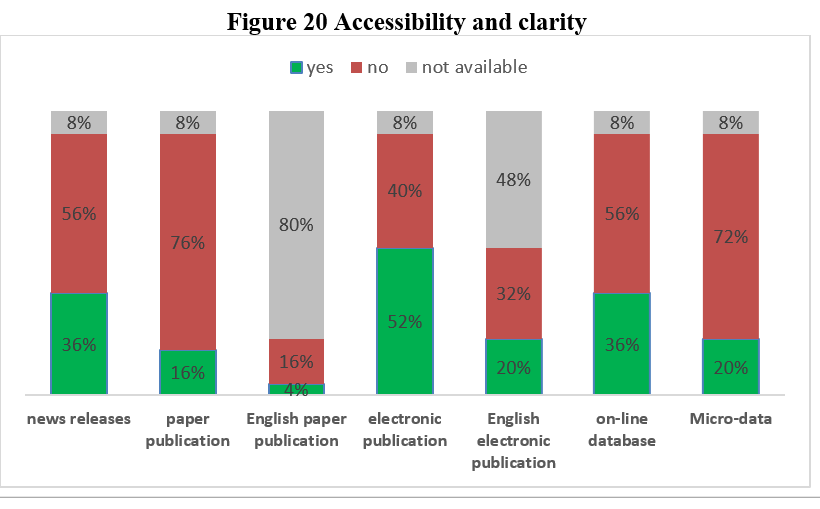
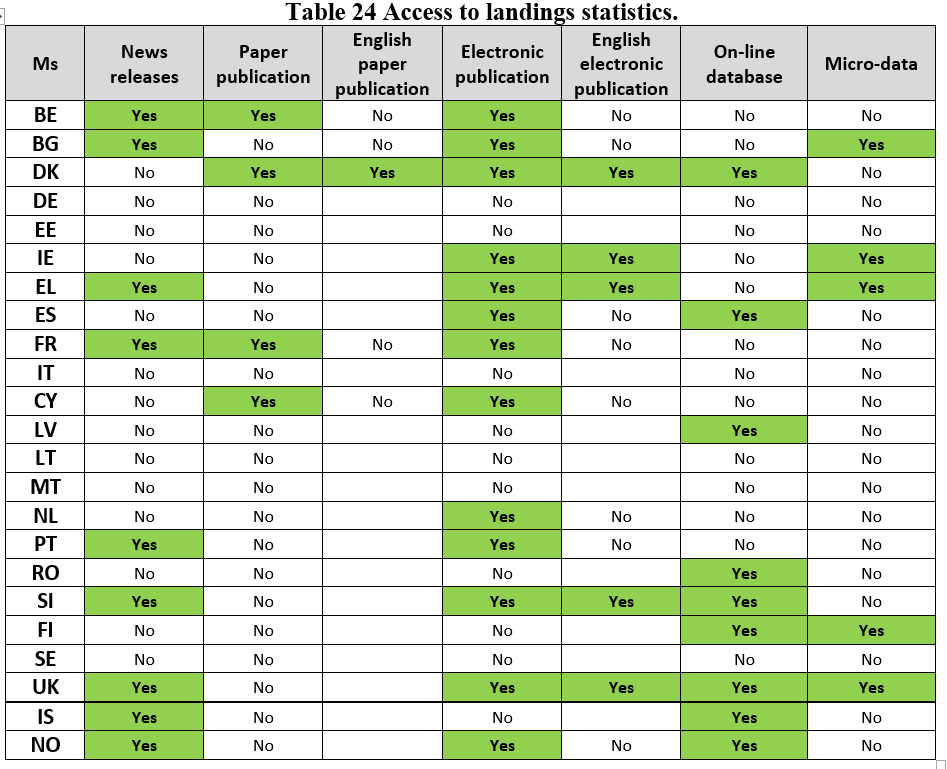
36% of the countries declared to make the landings statistics available to the data users in news releases, 16% via paper publications, and 52% via electronic publication (Figure 24)[1]. In order to ease the readability of data for a wider audience, several countries made available an English version of their publications too: this happens more frequently for the online publications (20% of the countries) rather than the printed ones (only 4% of the countries). Most countries have also a website dedicated to landings statistics (36%). 20% of the countries declared to give access to the micro data.
Table 24 reports the accessibility data broken down by countries.
[1] These percentages should not be summed up as a country could make data available on a combination of means (e.g. BE used news releases, paper and electronic publications as illustrated in Table 24) |
|||
| 9.1. Dissemination format - News release | |||
| Restricted from publication | |||
| 9.2. Dissemination format - Publications | |||
| Restricted from publication | |||
| 9.3. Dissemination format - online database | |||
| Restricted from publication | |||
| 9.3.1. Data tables - consultations | |||
| Restricted from publication | |||
| 9.4. Dissemination format - microdata access | |||
| Restricted from publication | |||
| 9.5. Dissemination format - other | |||
| Restricted from publication | |||
| 9.6. Documentation on methodology | |||
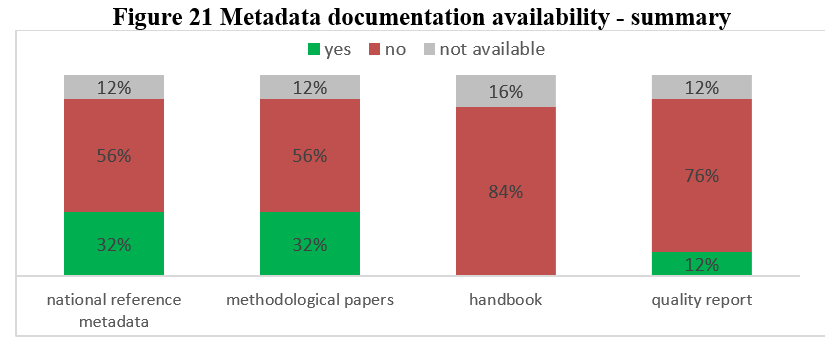
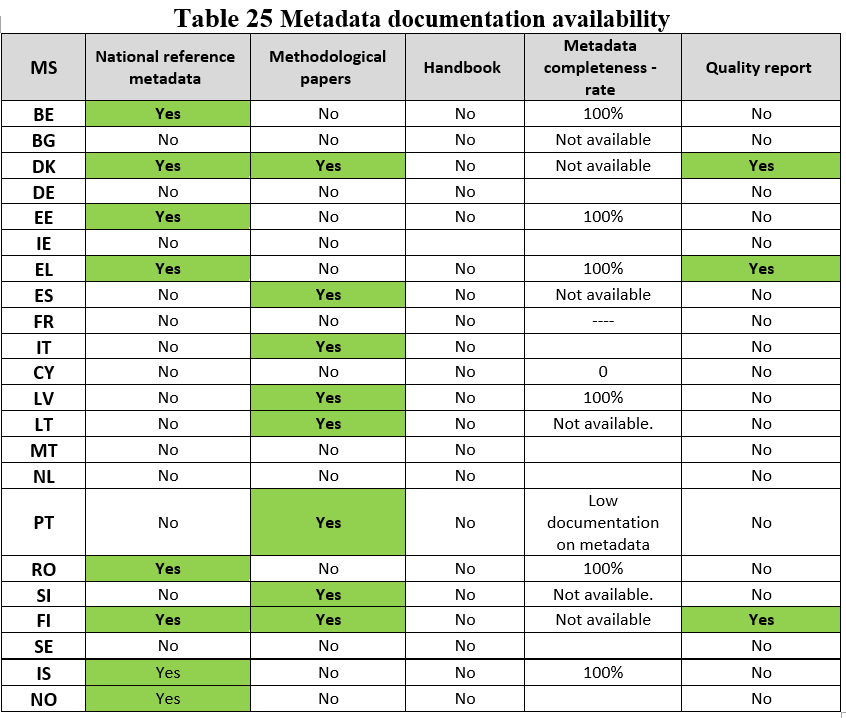
With regards to the documentation on methodology, 32% countries declared that national reference metadata were available against 56% who answered no (12% did not answer the question).
32% of countries declared that methodological papers are available and 12 % have published a quality report. Only few countries made an estimation of their metadata completeness rate, this was 100% in BE, EE, EL, RO and IS.
More country-specific details are available in the Accessibility and Clarity section of the quality reports.
|
|||
| 9.7. Quality management - documentation | |||
| Restricted from publication | |||
| 9.7.1. Metadata completeness - rate | |||
| Restricted from publication | |||
| 9.7.2. Metadata - consultations | |||
| Restricted from publication | |||
|
||||||||||||||||||||||||||||||||||||||||||||||||||||||||||||||||||||||||||||||||||||||||||||||||||||||||||||||||||||||||||||||||||||||||||||||||||||||||||||||||||||||||||||||||||||||||||||||||||||||||||||||||||||||||||||||||||||||||||||||||||||||||||||||||||||||||||||||||||||||||||||||||||||||||||||||||||||||||||||||||||||||||||||||||||
This section covers the efficiency gains as well as the burden reduction, in comparison with the previous quality reports.
10.1.Efficiency gains
10 countries declared to have improved – to some extent - the efficiency of the data collection for landings statistics in the last few years.
By observing which kind of improvements were recorded, the further automation appears to be the most frequent one (6 countries), followed by increased use of administrative data (4 countries), further training (3 countries). Italy made efficiency gains in on-line surveys (figure 26 and Table 26). 13 countries did not record any efficiency gain while 3 countries (Ireland, Croatia, and Poland) did not answer the question.
Table 26 Efficiency gains in the last few years by country
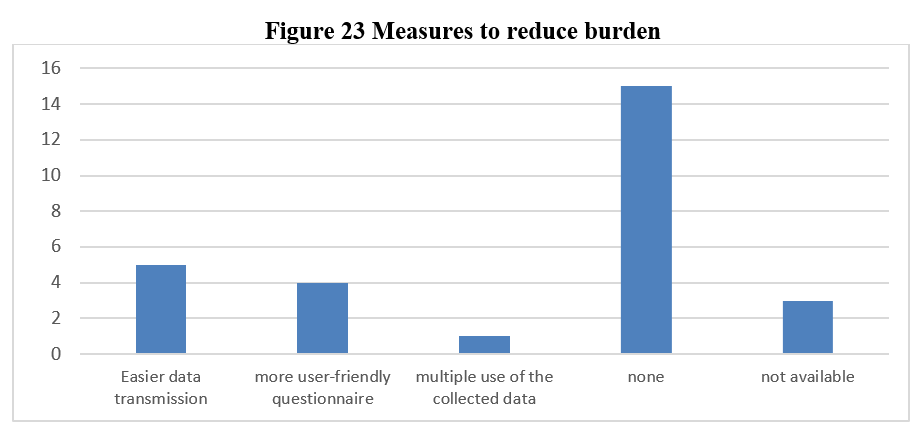
10.2.Burden reduction
Burden reduction measures have been implemented by 8 countries during the last few years. The most common burden reduction measures are “easier data transmission” (5 countries), “more user-friendly questionnaires” (4 countries) and “multiple use of the collected data”. 15 countries did not implement any measure to lower the burden while 3 left this section blank.
Table 27 shows the measures applied in order to reduce burden on data collection.
Table 27 Burden reduction measures.
|
||||||||||||||||||||||||||||||||||||||||||||||||||||||||||||||||||||||||||||||||||||||||||||||||||||||||||||||||||||||||||||||||||||||||||||||||||||||||||||||||||||||||||||||||||||||||||||||||||||||||||||||||||||||||||||||||||||||||||||||||||||||||||||||||||||||||||||||||||||||||||||||||||||||||||||||||||||||||||||||||||||||||||||||||||
|
|||
| 11.1. Confidentiality - policy | |||
not assessed EU level |
|||
| 11.2. Confidentiality - data treatment | |||
not assessed at EU level |
|||
|
|||
none |
|||
|
|||
|
|||
| Annex 1 - Landings reported data sources |
|||