|
 |
| For any question on data and metadata, please contact: Eurostat user support |
|
|||
| 1.1. Contact organisation | Federal Statistical Office of the Federal Republic of Germany |
||
| 1.2. Contact organisation unit | Division G1 – Agriculture and Forestry, Fisheries |
||
| 1.5. Contact mail address | Bonn Branch Office |
||
|
|||
| 2.1. Metadata last certified | 19/01/2022 | ||
| 2.2. Metadata last posted | 19/01/2022 | ||
| 2.3. Metadata last update | 19/01/2022 | ||
|
|||
| 3.1. Data description | |||
The dataset describes the structure of agricultural holdings by providing the general characteristics of farms and farmers and information on their land, livestock and labour force. It also contains information on production methods, rural development measures and agro-environmental aspects that look at the impact of agriculture on the environment. The data are used by public, researchers, farmers and policy-makers to analyse and interpret the state of the farming sector and the impact of agriculture on the environment. The data follow up the changes in the agricultural sector and provide a basis for decision-making in the Common Agricultural Policy (CAP) and other European Union policies. The statistical unit is the agricultural holding (farm), the definition follows article 2 of Regulation (EU) 2018/1091. The aggregated results are disseminated through statistical tables. The data are presented at different regional levels and allow a comparison over time. |
|||
| 3.2. Classification system | |||
The classifications of variables are available in Annex III of Regulation (EU) 2018/1091 and in Commission Implementing Regulation (EU) 2018/1874. The farm typology means a uniform classification of the holdings based on their type of farming and their economic size. Both are determined on the basis of the standard gross margin (SGM) (until 2007) or standard output (SO) (from 2010 onward) which is calculated for each crop and animal per region. The farm type is determined by the relative contribution of the different productions to the total standard gross margin or the standard output of the holding. The territorial classification uses the NUTS classification to break down the regional data. The regional data of core variables are available at NUTS level 3 and the regional data of the module data are available at level 2. |
|||
| 3.3. Coverage - sector | |||
The statistic covers agricultural holdings that fit the definition in article 2 of Regulation (EU) 2018/1091 and do the agricultural activities as listed in item 3.5 below and meet the minimum coverage requirements (thresholds) as listed in item 3.6 below. |
|||
| 3.4. Statistical concepts and definitions | |||
The list of core variables is set in Annex III of Regulation (EU) 2018/1091. The descriptions of the core variables as well as the lists and descriptions of the variables for the modules collected in 2020 are set in Commission Implementing Regulation (EU) 2018/1874. The following groups of variables are collected in 2020:
|
|||
| 3.5. Statistical unit | |||
See sub-category below. |
|||
| 3.5.1. Definition of agricultural holding | |||
The agricultural holding is a single unit, both technically and economically, that has a single management and that undertakes economic activities in agriculture in accordance with Regulation (EC) No 1893/2006 belonging to groups:
Agricultural holdings that produce olive oil from olives for personal use are included in the scope of the regulation, but are not relevant for Germany in the context of the IFS 2020. The breeding and keeping of ostriches, emus and rabbits, as well as bee-keeping are not relevant for Germany, too. |
|||
| 3.6. Statistical population | |||
See sub-categories below. |
|||
| 3.6.1. Population covered by the core data sent to Eurostat (main frame and if applicable frame extension) | |||
The thresholds of agricultural holdings are available in the annex. Annexes: 3.6.1. Thresholds of agricultural holdings |
|||
| 3.6.1.1. Raised thresholds compared to Regulation (EU) 2018/1091 | |||
| Yes | |||
| 3.6.1.2. Lowered and/or additional thresholds compared to Regulation (EU) 2018/1091 | |||
| No | |||
| 3.6.2. Population covered by the data sent to Eurostat for the modules “Labour force and other gainful activities”, “Rural development” and “Machinery and equipment” | |||
The subset of the population of agricultural holdings defined in item 3.6.1 which is part of the main frame i.e. above at least one of the thresholds set in Regulation (EU) 2018/1091. The above answer holds for the modules ‘Labour force and other gainful activities’ and ‘Rural development’. The module ‘Machinery and equipment’ is not collected in 2020. |
|||
| 3.6.3. Population covered by the data sent to Eurostat for the module “Animal housing and manure management” | |||
The subset of the population of agricultural holdings is defined in item 3.6.2. |
|||
| 3.7. Reference area | |||
See sub-categories below. |
|||
| 3.7.1. Geographical area covered | |||
The entire territory of the country. |
|||
| 3.7.2. Inclusion of special territories | |||
The entire territory of the country. |
|||
| 3.7.3. Criteria used to establish the geographical location of the holding | |||
| Other | |||
| 3.7.4. Additional information reference area | |||
The location of the holding was, in most cases, the parcel on which the farm building was located. If farm buildings were located on multiple parcels, the holding location was the parcel on which the most important farm buildings or buildings were located. |
|||
| 3.8. Coverage - Time | |||
Farm structure statistics in Germany cover the period from the 1930s onwards. The results are comparable to a limited extent, as the survey characteristics and thresholds have changed over time. Older time series are described in the previous quality reports (national methodological reports). |
|||
| 3.9. Base period | |||
The 2020 data are processed (by Eurostat) with 2017 standard output coefficients (calculated as a 5-year average of the period 2015-2019). For more information, please consult the definition of the standard output. |
|||
|
|||
Two kinds of units are generally used:
|
|||
|
|||
See sub-categories below. |
|||
| 5.1. Reference period for land variables | |||
The land variables refer to the reference year 2020. In the case of successive crops, the land variables refer to a crop that is harvested during the reference year, regardless of when the crop is sown. |
|||
| 5.2. Reference period for variables on irrigation and soil management practices | |||
A 12-month period for variables on irrigation ending on the December 31 2019. Variables on soil management practices are not part of the IFS 2020. |
|||
| 5.3. Reference day for variables on livestock and animal housing | |||
The reference day is the March 1st of the reference year 2020. |
|||
| 5.4. Reference period for variables on manure management | |||
A 12-month period ending on March 1st 2020. This period includes the reference day used for livestock and animal housing. |
|||
| 5.5. Reference period for variables on labour force | |||
A 12-month period ending on the 29th February within the reference year 2020. The calendar year 2019 is the reference period of the other gainful activities. |
|||
| 5.6. Reference period for variables on rural development measures | |||
The three-year period ending on the December 31, 2020. |
|||
| 5.7. Reference day for all other variables | |||
The reference day first of March of the reference year 2020. |
|||
|
|||
| 6.1. Institutional Mandate - legal acts and other agreements | |||
See sub-categories below. |
|||
| 6.1.1. National legal acts and other agreements | |||
| Legal act | |||
| 6.1.2. Name of national legal acts and other agreements | |||
|
|||
| 6.1.3. Link to national legal acts and other agreements | |||
| 6.1.4. Year of entry into force of national legal acts and other agreements | |||
|
|||
| 6.1.5. Legal obligations for respondents | |||
| Yes | |||
| 6.2. Institutional Mandate - data sharing | |||
Due to the German federal system, the IFS 2020 was conducted as a decentralised statistic. The development of the survey instruments and the methodological preparation is mainly the task domain of the Federal Statistical Office, while the Statistical Offices of the Länder are responsible for the implementation, data collection, validation assuring quality and dissemination for the Bundesland and lower regional units. This distribution of responsibilities requires a close collaboration between the Statistical Offices. Basically each Bundesland is the owner of his data and the rules of data sharing are defined by law. In order to reduce the burden, other national authorities provide data such as bovine variables of the Herkunfts- und Informationssystem für Tiere (HIT, Bovine Register), land variables of the Integriertes Verwaltungs- und Kontrollsystem (InVeKoS, Integrated Administration and Control System) or data of the European Agricultural Fund for Rural Development (ELER) or InVeKoS. |
|||
|
|||
| 7.1. Confidentiality - policy | |||
The individual data collected are generally kept confidential in compliance with Article 16 of the Federal Statistics Law. Only in exceptional cases explicitly regulated by law individual data can be transferred (e.g. the provision of anonymised individual data to the research data centres of the Federal Statistical Office and the Statistical Offices of the Länder, for universities and other independent, academic institutions), without citing names or addresses (factually anonymised individual data). |
|||
| 7.2. Confidentiality - data treatment | |||
See sub-categories below. |
|||
| 7.2.1. Aggregated data | |||
See sub-categories below. |
|||
| 7.2.1.1. Rules used to identify confidential cells | |||
| p% rule (A contributor is able to derive an estimate of some other contributor within p% of its true value) | |||
| 7.2.1.2. Methods to protect data in confidential cells | |||
| Cell suppression (Completely suppress the value of some cells) Rounding: controlled, deterministic or random (Round each cell value to a pre-specified rounding base) |
|||
| 7.2.1.3. Description of rules and methods | |||
A number of steps must be done to ensure compliance with this legal requirement. To prevent individual information about holdings from being disclosed in the nationally published tables, the results were subject to harmonised, nationwide confidentiality. During the generation of the published tables, primary confidentiality was carried out automatically based on the p-percent rule. Primary confidentiality is applied for total (full survey) and representative (sample survey) tables. Results of the sample survey were published in a rounded version. For variables we published in thousands with one position after decimal point. For number of agricultural holdings with two positions after decimal point. The coarsening effect of rounding was taken into account by means of a relevant adjustment of the p-percent rule. Results of the full surveyed components of the IFS 2020 were published without any rounding. To prevent the disclosure of the primarily suppressed table elements by forming sums or differences in the tables, so-called secondary suppressions were carried out (secondary confidentiality) in addition to the primary suppressions. The secondary confidentiality was carried out manually by the Federal Statistical Office and the Statistical Offices of the Länder. The suppressed table elements based on primary or secondary confidentiality are marked with a dot in the publication tables. Tabulation and confidentiality were realized by using the AGRATAB Management Tool (AMT) and Geheimhaltungsmanagementtool (GHMAN). Both are Java applications developed especially for this purpose. While AMT supports the entire process of tabulation including primary confidentiality, GHMAN enables manual entry of secondary confidentiality in the table cells. |
|||
| 7.2.2. Microdata | |||
See sub-categories below. |
|||
| 7.2.2.1. Use of EU methodology for microdata dissemination | |||
| Yes | |||
| 7.2.2.2. Methods of perturbation | |||
| None | |||
| 7.2.2.3. Description of methodology | |||
The individual data collected are generally kept confidential in compliance with Article 16 of the Federal Statistics Law. Only in exceptional cases explicitly regulated by law can individual data be transmitted. The names and addresses of the respondents are never passed on to third parties. The transmission of information collected to the responsible supreme federal or Länder authorities in the form of tables with statistical results is allowed according to Article 98 (1) of the Law on Agricultural Statistics in conjunction with Article 16 (4) of the Federal Statistics Law. This applies even if individual table cells only identify a single case. Under Article 16 (6) of the Federal Statistics Law, it is possible to provide individual data (microdata) to universities or other institutions tasked with independent scientific research for scientific projects if individual data can only be assigned to the respondents or parties concerned with a disproportionately large investment of time, cost and labour. Research institutions may, in addition, apply to the research data centres of the Federal Statistical Office and the Statistical Offices of the Länder where they have various ways of obtaining access to data, such as the on-site use (via safe centres or remote access) or off-site use (scientific use files, public use files). The research data centres are obliged to ensure statistical confidentiality when offering access to microdata for scientific use. They may not release results that allow conclusions on individual cases. For this reason, the research data centres check every result that is produced within an on-site use of microdata for statistical confidentiality. This happens according to set rules. If results allow conclusions on individual cases, these results will to be blocked. (You can find more information of the regulations on the analysis of microdata here: https://www.forschungsdatenzentrum.de/sites/default/files/RDC_regulations-microdata.pdf .) |
|||
|
|||
| 8.1. Release calendar | |||
First preliminary results of the IFS 2020 were published in a press conference in January 2021. The final results of the IFS 2020 were gradually published between May and October 2021. Since various publication products (e.g., updates to statistical reports/ database table, agricultural statistics atlas and StoryMaps) were planned, a central publication date in the annual release calendar was omitted. Press releases on selected topics of the IFS 2020 results were announced in the weekly preview. |
|||
| 8.2. Release calendar access | |||
Not applicable for the result of the IFS 2020. (You can find more information of the current preview (weekly and annual release calendar) here: https://www.destatis.de/EN/Press/_node.html.) |
|||
| 8.3. Release policy - user access | |||
In Germany there is an extensive set of tables, which are created due to the process described above. The whole content of these tables is available for everyone: politicians, public authorities, the business community and all citizens. The results are published online, which is a credo for the publication of information by the Federal Statistical System in Germany. You can retrieve data and publications by theme in an interactive form or read the daily press releases on the website www.destatis.de. In addition to this, the results on a lower regional level are published on the websites of the Statistical Offices of the Bundesländer. In GENESIS-Online (www.destatis.de/genesis) you should find all the data of the Federal Statistical Office updated daily in two languages. The result tables are available in Excel, HTML and CSV format. Data for lower regional units were published in Regionaldatenbank Deutschland (https://www.regionalstatistik.de/genesis/online). Furthermore, selected topics of the IFS 2020 were presented in ten StoryMaps. Furthermore, the Atlas Agrarstatistik Deutschland was updated. |
|||
| 8.3.1. Use of quality rating system | |||
| Yes, another quality rating system | |||
| 8.3.1.1. Description of the quality rating system | |||
For total results, there is no quality rating system. The quality rating system of representative results is based on the relative standard errors. For reasons of clarity, the standard errors (in %) were not published as error calculation results. Instead, a corresponding alphabetic character is placed after the representative resultant values, which represents the respective error class of the simple relative standard error. Allocation of the error classes of the simple relative standard errors: A: to under ± 2 percent Results that have error class E were replaced in the national publication tables by the character “/” because the estimation error is too high and the numerical value thus is not reliable enough. The error marking is intended to enable users to sufficiently estimate the reliability for their purposes. |
|||
|
|||
The frequency of the IFS is every three to four years. |
|||
|
|||
| 10.1. Dissemination format - News release | |||
See sub-categories below. |
|||
| 10.1.1. Publication of news releases | |||
| Yes | |||
| 10.1.2. Link to news releases | |||
|
|||
| 10.2. Dissemination format - Publications | |||
See sub-categories below. |
|||
| 10.2.1. Production of paper publications | |||
| No | |||
| 10.2.2. Production of on-line publications | |||
| Yes, but not in English | |||
| 10.2.3. Title, publisher, year and link | |||
The Federal Statistical Office publishes between May and October 2021 the following statistical reports (Fachserien) as PDF or Excel files:
|
|||
| 10.3. Dissemination format - online database | |||
See sub-categories below. |
|||
| 10.3.1. Data tables - consultations | |||
Not available. |
|||
| 10.3.2. Accessibility of online database | |||
| Yes | |||
| 10.3.3. Link to online database | |||
In the GENESIS-Online (DE, EN) you will find soon selected results of the IFS 2020. Navigating to > Themes >> 4 Economic sectors >>> 41 Agriculture, forestry, fisheries >>>> 41141 Census of agricultural holdings: main survey
In Regionaldatenbank (DE) you will find selected lower regional results of the IFS 2020. Navigation to > 4 Wirtschaftsbereiche >> 41 Land- und Forstwirtschaft, Fischerei >>> 411 Struktur der land- und forstwirtschaftl. Betriebe >>>> 41141 Agrarstrukturerhebung/Landwirtschaftszählung |
|||
| 10.4. Dissemination format - microdata access | |||
See sub-category below. |
|||
| 10.4.1. Accessibility of microdata | |||
| Yes | |||
| 10.5. Dissemination format - other | |||
Selected topics of the IFS 2020 were presented in ten StoryMaps. Furthermore, the Atlas Agrarstatistik Deutschland was updated. In the following overview tables information on specific topics of the IFS 2020 were presented:
|
|||
| 10.5.1. Metadata - consultations | |||
Not requested. |
|||
| 10.6. Documentation on methodology | |||
See sub-categories below. |
|||
| 10.6.1. Metadata completeness - rate | |||
Not requested. |
|||
| 10.6.2. Availability of national reference metadata | |||
| Yes | |||
| 10.6.3. Title, publisher, year and link to national reference metadata | |||
Explanations of the metadata is part of the production methods (Fachserie 3 Reihe 2. S. 6) and quality report. |
|||
| 10.6.4. Availability of national handbook on methodology | |||
| Yes | |||
| 10.6.5. Title, publisher, year and link to handbook | |||
The national handbook is part of the production methods (Fachserie 3 Reihe 2. S. 6 – Annex 9). |
|||
| 10.6.6. Availability of national methodological papers | |||
| Yes | |||
| 10.6.7. Title, publisher, year and link to methodological papers | |||
Explanations of the content, the methodology and procedures of the IFS 2020 were published 2021 in the production methods (Fachserie 3 Reihe 2. S. 6). |
|||
| 10.7. Quality management - documentation | |||
The quality report was published in 2021 and contains metadata and quality characteristics. |
|||
|
|||
| 11.1. Quality assurance | |||
See sub-categories below. |
|||
| 11.1.1. Quality management system | |||
| Yes | |||
| 11.1.2. Quality assurance and assessment procedures | |||
| Training courses Use of best practices Quality guidelines Peer review Other |
|||
| 11.1.3. Description of the quality management system and procedures | |||
Due to the increasing quantity of data requirements - which are growing over the time - it is sometimes difficult to collect high-quality data. The willingness of respondents decreases due to fatigue, annoyance or lack of understanding and therefore the quality suffers. Despite all digital innovations and quality management, this must be observed. Having said this, German statistics are naturally embedded in the European statistical system. This quality policy is based on four levels of quality assurance, namely principles, indicators, methods, tools, sector-specific quality assurance and established by Regulation (EC) No 223/2009. It aims to ensure and continuously improve the quality of European statistics whilst verifying that they meet user needs. The guidelines focusing on quality:
The European Statistics Code of Practice (CoP) is the cornerstone of the quality framework and sets the standards for developing, producing and disseminating European statistics.
The QAF serves as a guidance and complement on how to implement the CoP. Like the CoP, it applies to statistical authorities of the ESS, which comprises the European Union Statistical Authority (Eurostat), the National Statistical Institutes (NSIs) and Other National Authorities (ONAs) responsible for the development, production and dissemination of European Statistics. The QAF represents a collection of methods, tools and good practices that are suggested for use and/or are already in use in (some of) the statistical authorities of the ESS, where they have proved to be useful. The aim of the QAF is to accompany the CoP by providing guidance and examples in the form of more detailed methods and tools as well as good practices for the high-level principles and indicators outlined in the CoP. The Federal Statistical Office applies a variety of systematic quality assurance measures. Those measures ensure that we produce high-quality statistical information on the basis of methodologically sound and efficient production processes. With its Statistical Quality Offensive, the Federal Statistical Office has introduced a comprehensive quality management system based on Total Quality Management (TQM). The conceptual framework is the EFQM (European Foundation for Quality Management) Excellence Model. The EFQM Model for Excellence provides us with the basic structure for this assessment and review of the capability and service delivery and fulfilment (performance) of the overall organisation. 1. Peer Reviews The purpose of the ESS peer review is to monitor the compliance with the ES CoP of all partners of the ESS and to identify forward-looking recommendations for improvement. The peer reviews will therefore cover Eurostat, the NSIs and other national authorities (ONAs) responsible for the development, production and dissemination of European Statistics. The peer review will focus on all areas of the ES CoP and cover a carefully selected number of ONAs from each country. The product level will not be monitored. 2. Quality guidelines (Quality Reports) Since 2005, the Federal Statistical Office has offered Quality Reports on all federal statistics. Through that medium, users are provided with standard-format information on the methods and definitions applied and on the quality of statistical results. Also, the quality reports contain information on other publications and contacts. Such additional information may be used by users to properly interpret the data and to better assess the information value of the data obtained. 3. Other (Quality manual) The quality of statistical data has always been of great importance in official statistics. The Statistical Offices are recognised as the leading providers of high-quality statistical information about Germany. The aim is to continue to guarantee and expand the quality level achieved. For this reason, the Statistical Offices of the Federation and the Länder have developed and approved a quality manual. The Quality manual describes the framework for ensuring data quality in official German statistics. On the one hand, it is intended to inform users of statistical data on the quality assurance of statistical results and, on the other hand, to serve as a guideline for employees of the Statistical Offices of the Federation and the Länder and other offices in Germany that produce official statistics. |
|||
| 11.1.4. Improvements in quality procedures | |||
Developing quality indicators or experimental statistics, e.g. geospatial aspects in statistics. |
|||
| 11.2. Quality management - assessment | |||
Not available |
|||
|
|||
| 12.1. Relevance - User Needs | |||
Main users:
– Eurostat (ESTAT) – Directorate-General for Agricultural and Rural Development (DG AGRI) – Directorate-General for the Environment (DG ENV) – Directorate-General for Climate Action (DG CLIMA) – Directorate-General for Health and Food Safety (DG SANTE) – Joint Research Centre (JRC) – European Environment Agency (EEA)
– Federal Office of Agriculture and Food (BLE) – Johann Heinrich von Thünen Institut, Federal Research Institute for Rural Areas, Forestry and Fisheries
– German Farmers’ Association (DBV) – German Horticultural Association (ZVG)
– Food industry – Agricultural technology Furthermore, communities, Chambers and offices of Agriculture, agricultural holdings, media and press representatives, political parties and interested private individuals are also the users of these statistics. |
|||
| 12.1.1. Main groups of variables collected only for national purposes | |||
The national legislators supplement the programme of variables for the IFS 2020 by the Agricultural Statistics Law by:
All land variables were collected as total area including organic area. Furthermore some area have a detailed subdivision such as permanent crops under glass or high accessible cover and were broken down in orchards for pome fruits, orchards for stone fruits, orchards for berry and nurseries
Cultivation of summer catch crop in 2019 and winter catch crops from winter 2019 until May 2020.
The leased UAA and the relevant annual rents were broken down by the types of use arable land, permanent grassland and other UAA. In addition, first leases in the last two years were listed as a separate item on the questionnaire. The rented UAA within an entire rented farm was identified separately. Furthermore, the annual lease payments were requested.
In addition to the irrigable outdoor area, the actual irrigated outdoor area was surveyed too.
All livestock variables were also collected for animals in organic husbandry. Furthermore, the number of places on the farm used in the last 12 months according to the respective types of poultry was surveyed.
Climate-relevant data were added in the section on animal housing such as - dairy cows / other cattle: average annual and daily grazing time - kind of stable of pig housing: outdoor stable, force-ventilated stable with / without certificated waste air purification plants
For the purpose of emissions reporting this section requested additional variables on the amount, application techniques, storage types and types of manure.
The gender expression ‘diverse’ was asked but not published. Furthermore, the potential holding succession was collected.
Comparison of the holdings net income with the external net income of the holder/spouse
As in the previous agriculture structure survey 2016, the type of determination of profit and of turnover taxation was indicated here. In addition, the support programs of the rural development were collected in our national census not just in the sample in order to obtain regional results. The IFS2020 is a sample. |
|||
| 12.1.2. Unmet user needs | |||
The international and national data requirements are defined by the amendment of the national Law on Agricultural Statistics. The mission is to provide objective and independent statistical information of high quality. However, the burden on survey should be within a tolerable range. Therefore, the integration of new variables is a balance act. If we would follow every single data need, the IFS-system would collapse. In a nutshell, all main data needs were met. |
|||
| 12.1.3. Plans for satisfying unmet user needs | |||
Not applicable |
|||
| 12.2. Relevance - User Satisfaction | |||
The international variables for the IFS 2020 were carried out by Eurostat in coordination with the national statistical offices. At the national level, variables are implemented in cooperation with the Federal Ministry of Food and Agriculture of Germany, which involves the ministries of the Länder via the Statistical Committee. In addition, the federal ministries, the Statistical Offices of the Länder, the central associations and representatives from economy and science are represented in the Statistical Advisory Committee, which shall advise the Federal Office on statistical matters and represent the interests of the users of federal statistics. The detailed discussion of individual statistics and of special methodological and technical questions take place in the technical committee Agricultural Statistics of the Statistical Advisory Committee. |
|||
| 12.2.1. User satisfaction survey | |||
| No | |||
| 12.2.2. Year of user satisfaction survey | |||
Not applicable |
|||
| 12.2.3. Satisfaction level | |||
| Not applicable | |||
| 12.3. Completeness | |||
Information on low- and zero prevalence variables is available on Eurostat's website. |
|||
| 12.3.1. Data completeness - rate | |||
Not applicable for Integrated Farm Statistics as the not collected variables, not-significant variables and not-existent variables are completed with 0. |
|||
|
|||
| 13.1. Accuracy - overall | |||
See categories below. |
|||
| 13.2. Sampling error | |||
See sub-categories below. |
|||
| 13.2.1. Sampling error - indicators | |||
| Restricted from publication | |||
| 13.2.2. Reasons for non-compliant precision requirements in relation to Regulation (EU) 2018/1091 | |||
Not applicable. In the IFS, there are no cases where the estimated RSEs are above the determined thresholds. |
|||
| 13.2.3. Methodology used to calculate relative standard errors | |||
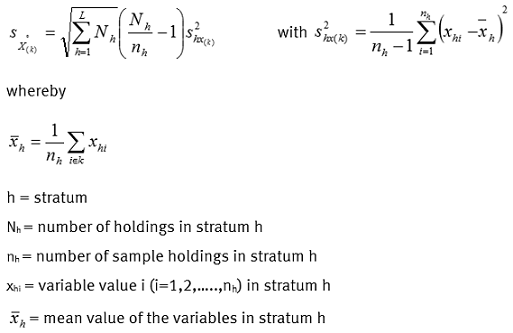
To assess the quality of results gained from a sample, they must be statistically evaluated by means of error calculation. Therefore, the national results of the IFS are produced using a processing program in which a calculation of the simple relative standard errors is integrated on the basis of the individual values for representative results. The simple relative standard error is used as the measure for the size of the random error and calculated in a stratified random sample using the following formula:
For reasons of clarity, the standard errors (in %) were not published as error calculation results. Instead, a corresponding alphabetic character is placed after the representative resultant values, which stands for the respective error class of the simple relative standard error. For more information see item 8.3.1.1. Description of the quality rating system. RSEs were only calculated for sample surveyed characteristics. |
|||
| 13.2.4. Impact of sampling error on data quality | |||
| Low | |||
| 13.3. Non-sampling error | |||
See sub-categories below. |
|||
| 13.3.1. Coverage error | |||
See sub-categories below. |
|||
| 13.3.1.1. Over-coverage - rate | |||
The over-coverage rate is available in the annex. The over-coverage rate is unweighted. Annexes: 13.3.1.1. Over-coverage rate and Unit non-response rate |
|||
| 13.3.1.1.1. Types of holdings included in the frame but not belonging to the population of the core (main frame and if applicable frame extension) | |||
| Below thresholds during the reference period Temporarily out of production during the reference period Ceased activities Merged to another unit |
|||
| 13.3.1.1.2. Actions to minimize the over-coverage error | |||
| Removal of ineligible units from the records, leaving unchanged the weights for the other units | |||
| 13.3.1.1.3. Additional information over-coverage error | |||
Over-coverage occurs when holdings do not or no longer belong to the survey population and are therefore not (or no longer) obligated to respond in the survey. In order to prevent this, holdings that are identified as below the threshold or that have abandoned agricultural production are labelled accordingly in the Farm Register and no longer considered when drawing the sampling frame. The Farm Register is regularly updated by the Statistical Offices of the Länder. Moreover, the questionnaire contains a question whether the holding reaches the coverage thresholds. Holdings which do not fulfil the thresholds are marked during data processing and excluded from further data processing. |
|||
| 13.3.1.2. Common units - proportion | |||
Not requested. |
|||
| 13.3.1.3. Under-coverage error | |||
See sub-categories below. |
|||
| 13.3.1.3.1. Under-coverage rate | |||
Errors can basically occur during the determination of the survey population regardless of the method. Under-coverage can occur when holdings that are agricultural holdings in the legal sense are not identified as such and are therefore not surveyed. The Farm register, which serves as the basis for determining the population, is regularly updated by the statistical offices of the Länder. Primarily various administrative sources as well as information from past surveys are used to update the register. In order to prevent multiple listings (particularly when adding new respondents), a duplicate search is conducted in the Farm Register. The integrated duplicate search (carried out using the names and locations of the holdings) and constant comparisons with various administrative sources practically exclude multiple listings of the same unit. If a number of holdings are listed under one address – not necessarily an error – this situation is checked immediately (e.g. by telephone). In case of doubt they were surveyed as new respondents. Accordingly, we consider the degree of under-coverage being very low. |
|||
| 13.3.1.3.2. Types of holdings belonging to the population of the core but not included in the frame (main frame and if applicable frame extension) | |||
| New births New units derived from split |
|||
| 13.3.1.3.3. Actions to minimise the under-coverage error | |||
Cf. item 13.3.1.3.1. Under-coverage rate |
|||
| 13.3.1.3.4. Additional information under-coverage error | |||
Not available |
|||
| 13.3.1.4. Misclassification error | |||
| No | |||
| 13.3.1.4.1. Actions to minimise the misclassification error | |||
The variables used for the classification are surveyed and checked in the IFS 2020. So misclassification errors cannot occur in this survey. |
|||
| 13.3.1.5. Contact error | |||
| No | |||
| 13.3.1.5.1. Actions to minimise the contact error | |||
The respondents can enter changes of address or correct errors in the address in the questionnaire. The address changes provided are checked for postal correctness, then transferred to the Farm Register and promptly displayed during the processing procedure. |
|||
| 13.3.1.6. Impact of coverage error on data quality | |||
| Low | |||
| 13.3.2. Measurement error | |||
See sub-categories below. |
|||
| 13.3.2.1. List of variables mostly affected by measurement errors | |||
The main reasons for missing or erroneous information in the IFS 2020 are the size of the questionnaire and the complexity of the survey. The same problem will occur in the IFS 2023. Furthermore, in the IFS 2020 some variables are considered sensitive by respondents (e.g. ownership or the breakdown of the number of employees and working hours, the manure management), which lessens response willingness. In addition, and in despite of the great care that was taken in preparing the questionnaire, comprehension difficulties frequently occurred in the questionnaire sections manure management, other gainful activities and areas under high accessible protective covers including greenhouses, as identified by the large number of follow-up enquiries. All measurement errors were corrected – if recognised as such, for example through distinct deviations from previous year or experienced values – during data editing. Moreover, a pre-test was conducted with voluntary farmers to improve the questionnaire. In the context of the pre-test, the performance and the usability (understanding / user-friendliness) of the online-questionnaire were tested. |
|||
| 13.3.2.2. Causes of measurement errors | |||
| Complexity of variables Sensitivity of variables Unclear questions Respondents’ inability to provide accurate answers |
|||
| 13.3.2.3. Actions to minimise the measurement error | |||
| Pre-testing questionnaire Pre-filled questions Explanatory notes or handbooks for enumerators or respondents On-line FAQ or Hot-line support for enumerators or respondents Training of enumerators |
|||
| 13.3.2.4. Impact of measurement error on data quality | |||
| Moderate | |||
| 13.3.2.5. Additional information measurement error | |||
Not available |
|||
| 13.3.3. Non response error | |||
See sub-categories below. |
|||
| 13.3.3.1. Unit non-response - rate | |||
The unit non-response rate is in the annex of item 13.3.1.1. The unit non-response rate is unweighted. |
|||
| 13.3.3.1.1. Reasons for unit non-response | |||
| Refusal to participate Inability to participate (e.g. illness, absence) |
|||
| 13.3.3.1.2. Actions to minimise or address unit non-response | |||
| Follow-up interviews Reminders Legal actions Imputation Weighting |
|||
| 13.3.3.1.3. Unit non-response analysis | |||
A non-response analysis was not conducted. |
|||
| 13.3.3.2. Item non-response - rate | |||
Item non-responses were primarily solved/corrected by means of telephone follow-ups with the farmers. There is no summary of the results on non-responses items. |
|||
| 13.3.3.2.1. Variables with the highest item non-response rate | |||
There were problems with response willingness mainly with variables considered as sensitive such as ownership, the breakdown of the number of workers and work hours and farm manure which required a comparatively large amount of follow-ups with the respondents. |
|||
| 13.3.3.2.2. Reasons for item non-response | |||
| Refusal Skip of due question Farmers do not know the answer |
|||
| 13.3.3.2.3. Actions to minimise or address item non-response | |||
| Follow-up interviews Reminders Legal actions Imputation Weighting |
|||
| 13.3.3.3. Impact of non-response error on data quality | |||
| Low | |||
| 13.3.3.4. Additional information non-response error | |||
Although answering the survey was obligatory, nevertheless it happened that a survey respondent refused to answer. To increase the willingness to provide information several reminders were sent by the Statistical Offices of the Länder, before – in the last instance – fines were issued. Some missing values were supplemented by using an imputation method. |
|||
| 13.3.4. Processing error | |||
See sub-categories below. |
|||
| 13.3.4.1. Sources of processing errors | |||
| Internet problems affecting filled-in web questionnaires Imputation methods Data processing |
|||
| 13.3.4.2. Imputation methods | |||
| Cold-deck imputation Previous data for the same unit |
|||
| 13.3.4.3. Actions to correct or minimise processing errors | |||
The plausibility checks minimised possible processing errors. The AGRA2010 processing program was the main instrument for completeness and plausibility checks. This program stores more than 800 obligatory and facultative error tests and many automated corrections. In the following, we explain the differentiation of these error messages.
Automatically adjusted errors are errors that can be corrected without a doubt and unequivocally based on the available information without follow-up interviews or data matching (e.g. by inserting missing total values). |
|||
| 13.3.4.4. Tools and staff authorised to make corrections | |||
All subsequent work on the data (follow-ups, corrections, input of data from administrative sources, etc.) was done by the staff members of the Statistical Offices of the Länder using the AGRA2010 processing and data editing program for agricultural statistics. |
|||
| 13.3.4.5. Impact of processing error on data quality | |||
| Low | |||
| 13.3.4.6. Additional information processing error | |||
Processing errors occur during processing of statistics, for example during signing, data capture or corrections made during data editing. To prevent processing errors, the programs used were tested extensively. To prevent signature errors or data capture errors, corresponding signature and value range checks were recorded in the data editing program. |
|||
| 13.3.5. Model assumption error | |||
No model assumption were applied. |
|||
|
|||
| 14.1. Timeliness | |||
See sub-categories below. |
|||
| 14.1.1. Time lag - first result | |||
The preliminary national results from the Main Survey of Land Use, which encompassed topics only referring to agricultural land use, were published approx. 5 months after the survey's reference day. The period between the beginning of the survey and publication of the first results from the entire feature set of the IFS 2020 was 16 months. Key figures were published earlier in the January 2021 press conference. |
|||
| 14.1.2. Time lag - final result | |||
The publication of the final results (Fachserie) of the IFS 2020 was divided up into 16 parts (series) (cf. Section 10.2.3 Title, publisher, year and link.) and carried out in a number of steps. The first set of Fachserien was published 6 months and the last 10 months after the end of the reference year. |
|||
| 14.2. Punctuality | |||
See sub-categories below. |
|||
| 14.2.1. Punctuality - delivery and publication | |||
See sub-categories below. |
|||
| 14.2.1.1. Punctuality - delivery | |||
Not requested. |
|||
| 14.2.1.2. Punctuality - publication | |||
The results of the IFS 2020 were delivered to Eurostat on time on December 15th 2021. The national publication of the national results was also on time with the first press release on January, 21th 2021 and the last, final results were published in October, 18th 2021. |
|||
|
||||||||||||||||||||||
| 15.1. Comparability - geographical | ||||||||||||||||||||||
See sub-categories below. |
||||||||||||||||||||||
| 15.1.1. Asymmetry for mirror flow statistics - coefficient | ||||||||||||||||||||||
Not applicable, because there are no mirror flows in Integrated Farm Statistics. |
||||||||||||||||||||||
| 15.1.2. Definition of agricultural holding | ||||||||||||||||||||||
See sub-categories below. |
||||||||||||||||||||||
| 15.1.2.1. Deviations from Regulation (EU) 2018/1091 | ||||||||||||||||||||||
No deviations |
||||||||||||||||||||||
| 15.1.2.2. Reasons for deviations | ||||||||||||||||||||||
Not applicable |
||||||||||||||||||||||
| 15.1.3. Thresholds of agricultural holdings | ||||||||||||||||||||||
See sub-categories below. |
||||||||||||||||||||||
| 15.1.3.1. Proofs that the EU coverage requirements are met | ||||||||||||||||||||||
| Restricted from publication | ||||||||||||||||||||||
| 15.1.3.2. Differences between the national thresholds and the thresholds used for the data sent to Eurostat | ||||||||||||||||||||||
No differences. |
||||||||||||||||||||||
| 15.1.3.3. Reasons for differences | ||||||||||||||||||||||
Not applicable. |
||||||||||||||||||||||
| 15.1.4. Definitions and classifications of variables | ||||||||||||||||||||||
See sub-categories below. |
||||||||||||||||||||||
| 15.1.4.1. Deviations from Regulation (EU) 2018/1091 and EU handbook | ||||||||||||||||||||||
Yes |
||||||||||||||||||||||
| 15.1.4.1.1. The number of working hours and days in a year corresponding to a full-time job | ||||||||||||||||||||||
The information is available in the annex. Annexes: 15.1.4.1.1. AWU |
||||||||||||||||||||||
| 15.1.4.1.2. Point chosen in the Annual work unit (AWU) percentage band to calculate the AWU of holders, managers, family and non-family regular workers | ||||||||||||||||||||||
The information is available in the annex of item 15.1.4.1.1. |
||||||||||||||||||||||
| 15.1.4.1.3. AWU for workers of certain age groups | ||||||||||||||||||||||
The information is available in the annex of item 15.1.4.1.1. |
||||||||||||||||||||||
| 15.1.4.1.4. Livestock coefficients | ||||||||||||||||||||||
|
||||||||||||||||||||||
| 15.1.4.1.5. Livestock included in “Other livestock n.e.c.” | ||||||||||||||||||||||
In Germany we included equidae to the other livestock n.e.c.. Furthermore, we included pullets to the laying hens. |
||||||||||||||||||||||
| 15.1.4.2. Reasons for deviations | ||||||||||||||||||||||
Due to a more detailed subdivision of area variables the national classification of the general type of farming* differs slightly from the IFS. * Commission delegated regulation (EU) No 1198/2014
The national livestock units are harmonised with the other national agricultural statistics. Furthermore, these national livestock units have not been adjusted. Therefore, a time comparison is possible. |
||||||||||||||||||||||
| 15.1.5. Reference periods/days | ||||||||||||||||||||||
See sub-categories below. |
||||||||||||||||||||||
| 15.1.5.1. Deviations from Regulation (EU) 2018/1091 | ||||||||||||||||||||||
Deviations from Regulation (EU) 2018/1091 are
|
||||||||||||||||||||||
| 15.1.5.2. Reasons for deviations | ||||||||||||||||||||||
In order to ensure comparability over time of the variables of other gainful activities and irrigated area, a different reference period was selected. |
||||||||||||||||||||||
| 15.1.6. Common land | ||||||||||||||||||||||
| The concept of common land exists | ||||||||||||||||||||||
| 15.1.6.1. Collection of common land data | ||||||||||||||||||||||
| Yes | ||||||||||||||||||||||
| 15.1.6.2. Reasons if common land exists and data are not collected | ||||||||||||||||||||||
Not applicable |
||||||||||||||||||||||
| 15.1.6.3. Methods to record data on common land | ||||||||||||||||||||||
| Common land is included in separate records representing virtual entities without managers. | ||||||||||||||||||||||
| 15.1.6.4. Source of collected data on common land | ||||||||||||||||||||||
| Surveys | ||||||||||||||||||||||
| 15.1.6.5. Description of methods to record data on common land | ||||||||||||||||||||||
The Regulation (EC) 1391 defines common land as a virtual unit created for the purposes of data collection and compilation, which includes the agricultural land used by agricultural holdings but not directly owned by them, i.e. land for which common rights exist (commons). It does not include common land that is leased or given for cultivation free of charge. This belongs to leased land or land received for cultivation free of charge and does not belong to common land. Each common land unit has a holder. Common land only exists in Bavaria. |
||||||||||||||||||||||
| 15.1.6.6. Possible problems in relation to the collection of data on common land and proposals for future data collections | ||||||||||||||||||||||
We do not experience problems to collect data on common land. |
||||||||||||||||||||||
| 15.1.7. National standards and rules for certification of organic products | ||||||||||||||||||||||
See sub-categories below. |
||||||||||||||||||||||
| 15.1.7.1. Deviations from Council Regulation (EC) No 834/2007 | ||||||||||||||||||||||
All holdings that farm organically according to Regulation (EC) No 834/2007* were classified here. The definitions are the same as those in the EU guidelines. * Council Regulation (EC) No 834/2007 of 28 June 2007 on organic production and labelling of organic products |
||||||||||||||||||||||
| 15.1.7.2. Reasons for deviations | ||||||||||||||||||||||
Not applicable |
||||||||||||||||||||||
| 15.1.8. Differences in methods across regions within the country | ||||||||||||||||||||||
No differences across regions within the country. |
||||||||||||||||||||||
| 15.2. Comparability - over time | ||||||||||||||||||||||
See sub-categories below. |
||||||||||||||||||||||
| 15.2.1. Length of comparable time series | ||||||||||||||||||||||
Since the last adjustment of the survey design and coverage limits for the FSS 2010, the data collected can be considered comparable. The last change was in the threshold category poultry, where the number of poultry were replaced by the holding places for poultry. For the IFS surveys prior to that, the possibilities for comparison exist, but some aspects have to be considered. |
||||||||||||||||||||||
| 15.2.2. Definition of agricultural holding | ||||||||||||||||||||||
See sub-categories below. |
||||||||||||||||||||||
| 15.2.2.1. Changes since the last data transmission to Eurostat | ||||||||||||||||||||||
| There have been no changes | ||||||||||||||||||||||
| 15.2.2.2. Description of changes | ||||||||||||||||||||||
Regulation (EU) 2018/1091 newly considers agricultural holdings with only fur animals. However in our country fur animals is a not significant variable, therefore this change has no impact to our definition of agricultural holding. |
||||||||||||||||||||||
| 15.2.3. Thresholds of agricultural holdings | ||||||||||||||||||||||
See sub-categories below. |
||||||||||||||||||||||
| 15.2.3.1. Changes in the thresholds of holdings for which core data are sent to Eurostat since the last data transmission | ||||||||||||||||||||||
| There have been no changes | ||||||||||||||||||||||
| 15.2.3.2. Description of changes | ||||||||||||||||||||||
Not applicable |
||||||||||||||||||||||
| 15.2.4. Geographical coverage | ||||||||||||||||||||||
See sub-categories below. |
||||||||||||||||||||||
| 15.2.4.1. Change in the geographical coverage since the last data transmission to Eurostat | ||||||||||||||||||||||
| There have been no changes | ||||||||||||||||||||||
| 15.2.4.2. Description of changes | ||||||||||||||||||||||
Not applicable |
||||||||||||||||||||||
| 15.2.5. Definitions and classifications of variables | ||||||||||||||||||||||
See sub-categories below. |
||||||||||||||||||||||
| 15.2.5.1. Changes since the last data transmission to Eurostat | ||||||||||||||||||||||
| There have been some changes but not enough to warrant the designation of a break in series | ||||||||||||||||||||||
| 15.2.5.2. Description of changes | ||||||||||||||||||||||
In IFS, there is a new class (“shared ownership”) for the legal personality of the holding compared to FSS 2016, which trigger fluctuations of holdings in the classes of sole holder holdings and group holdings.
In IFS, the pullets and pullet chicks are part of laying hens. In FSS 2016, pullets and pullet chicks were part of other poultry.
In FSS 2016, deer were included in this class, but in IFS they are classified separately. Also in FSS 2016, there was a class for the collection of equidae. That has been dropped and equidae are included in IFS in "other livestock n.e.c."
In FSS 2016, turkeys, ducks, geese, ostriches and other poultry were considered each one in a separate class with a coefficient of 0.03 for all the classes except for ostriches (coefficient 0.035). In IFS 2020, the coefficients were adjusted accordingly, with turkeys remaining at 0.03, ostriches remaining at 0.35, ducks adjusted to 0.01, geese adjusted to 0.02 and other poultry fowls n.e.c. adjusted to 0.001.
While in FSS only fully compliant (certified converted) animals were included, in IFS both animals under conversion and fully converted are to be included. |
||||||||||||||||||||||
| 15.2.6. Reference periods/days | ||||||||||||||||||||||
See sub-categories below. |
||||||||||||||||||||||
| 15.2.6.1. Changes since the last data transmission to Eurostat | ||||||||||||||||||||||
| There have been some changes but not enough to warrant the designation of a break in series | ||||||||||||||||||||||
| 15.2.6.2. Description of changes | ||||||||||||||||||||||
There is minor change: The reference period for “manure application techniques” was “Calendar year 2015” in FSS 2016 while the reference period for manure management is a 12-month period ending on March 1st 2020 in IFS2020. |
||||||||||||||||||||||
| 15.2.7. Common land | ||||||||||||||||||||||
See sub-categories below. |
||||||||||||||||||||||
| 15.2.7.1. Changes in the methods to record common land since the last data transmission to Eurostat | ||||||||||||||||||||||
| There have been some changes but not enough to warrant the designation of a break in series | ||||||||||||||||||||||
| 15.2.7.2. Description of changes | ||||||||||||||||||||||
Common land units have only been surveyed since the IFS 2020. |
||||||||||||||||||||||
| 15.2.8. Explanations for major trends of main variables compared to the last data transmission to Eurostat | ||||||||||||||||||||||
|
||||||||||||||||||||||
| 15.2.9. Maintain of statistical identifiers over time | ||||||||||||||||||||||
| No | ||||||||||||||||||||||
| 15.3. Coherence - cross domain | ||||||||||||||||||||||
See sub-categories below. |
||||||||||||||||||||||
| 15.3.1. Coherence - sub annual and annual statistics | ||||||||||||||||||||||
Not applicable to Integrated Farm Statistics, because there are no sub annual data collections in agriculture. |
||||||||||||||||||||||
| 15.3.2. Coherence - National Accounts | ||||||||||||||||||||||
Not applicable, because Integrated Farm Statistics have no relevance for national accounts. |
||||||||||||||||||||||
| 15.3.3. Coherence at micro level with data collections in other domains in agriculture | ||||||||||||||||||||||
See sub-categories below. |
||||||||||||||||||||||
| 15.3.3.1. Analysis of coherence at micro level | ||||||||||||||||||||||
| Yes | ||||||||||||||||||||||
| 15.3.3.2. Results of analysis at micro level | ||||||||||||||||||||||
The holding-ID is unique and therefore, in principle, the micro data can only be blended nationally with other agricultural statistics (e.g. livestock and area statistics). Comparisons with other data sources (previous land use, livestock surveys, FSS or administrative sources) were done for specific variables for data editing purposes. Striking deviations were then clarified by means of follow-ups with the respondents. |
||||||||||||||||||||||
| 15.3.4. Coherence at macro level with data collections in other domains in agriculture | ||||||||||||||||||||||
See sub-categories below. |
||||||||||||||||||||||
| 15.3.4.1. Analysis of coherence at macro level | ||||||||||||||||||||||
| Yes | ||||||||||||||||||||||
| 15.3.4.2. Results of analysis at macro level | ||||||||||||||||||||||
The IFS aggregates were compared to the aggregates from crop production and animal production statistics and were found coherent. |
||||||||||||||||||||||
| 15.4. Coherence - internal | ||||||||||||||||||||||
The data are internally consistent. This is ensured by the application of a wide range of validation rules. |
||||||||||||||||||||||
|
|||
See sub-categories below. |
|||
| 16.1. Coordination of data collections in agricultural statistics | |||
To lower the burden of the respondents and the Statistical Offices of the Länder and lessen costs, in IFS years the Survey of Land Use is conducted as an integrated element of the IFS. Additionally, the online reporting is mandatory. This obligation also lowered the survey costs. Reporting burden for the holdings was also reduced by using as many administrative data sources as possible. For example, data from the Integrated Administration and Control System, Bovine Register and European Agricultural Fund for Rural Development. Furthermore, the part of enterprise groups was derived from information available in statistical database. However, this procedure not always reduced the cost of data handling in the Statistical Offices, too. |
|||
| 16.2. Efficiency gains since the last data transmission to Eurostat | |||
| Further automation Increased use of administrative data |
|||
| 16.2.1. Additional information efficiency gains | |||
Not available |
|||
| 16.3. Average duration of farm interview (in minutes) | |||
See sub-categories below. |
|||
| 16.3.1. Core | |||
Not available. |
|||
| 16.3.2. Module ‘Labour force and other gainful activities‘ | |||
Not available. |
|||
| 16.3.3. Module ‘Rural development’ | |||
Not available. |
|||
| 16.3.4. Module ‘Animal housing and manure management’ | |||
Not available. |
|||
|
|||
| 17.1. Data revision - policy | |||
We define a data revision as all subsequent modifications to data that have already been released to the public. This is the case when at first preliminary statistical results are published and final results at a later time. On principle, preliminary data are always identified as such in all publications. Errors in publications can also be the reason for data revisions. The treatment of errors in publications is prescribed at the Federal Statistical Office in a special guideline (Richtlinie zum Umgang mit Veröffentlichungsfehlern). Should publication errors occur they are allocated to error categories – depending on the severity of the error – and treated depending on the error category. Corrected data are then identified in the national publications by a special signature. The Statistical Offices of the Länder have comparable guidelines for handling publication errors or use a comparable procedure for revisions. |
|||
| 17.2. Data revision - practice | |||
Preliminary results were published online for the integrated Survey of Land Use as part of the IFS 2020 and in a press conference, so there were two planned data revisions for the IFS 2020. Up to now, no publication errors emerged. |
|||
| 17.2.1. Data revision - average size | |||
Not requested. |
|||
|
|||
| Annexes: 18. Timetable statistical process |
|||
| 18.1. Source data | |||
See sub-categories below. |
|||
| 18.1.1. Population frame | |||
See sub-categories below. |
|||
| 18.1.1.1. Type of frame | |||
| List frame | |||
| 18.1.1.2. Name of frame | |||
The population for the IFS 2020 was established on the basis of the Farm Register which is regularly updated by results from various agricultural statistical surveys and by information from administrative sources such as the Herkunfts- und Informationssystem für Tiere (HIT, Bovine Register). The adds and outs (e.g. newly established or abandoned holdings) ascertained in intermediate years in the Farm Register, which result from the regular updates of survey units using administrative sources, were taken into consideration. With a population of 262,800 holdings, the sampling fraction is approx. 0.29 (n/N)*. * Ratio of the size of a sample (n) to the population size (N) |
|||
| 18.1.1.3. Update frequency | |||
| Continuous | |||
| 18.1.2. Core data collection on the main frame | |||
See sub-categories below. |
|||
| 18.1.2.1. Coverage of agricultural holdings | |||
| Census | |||
| 18.1.2.2. Sampling design | |||
Not applicable for 2020. |
|||
| 18.1.2.2.1. Name of sampling design | |||
| Not applicable | |||
| 18.1.2.2.2. Stratification criteria | |||
| Not applicable | |||
| 18.1.2.2.3. Use of systematic sampling | |||
| Not applicable | |||
| 18.1.2.2.4. Full coverage strata | |||
Not applicable for 2020. |
|||
| 18.1.2.2.5. Method of determination of the overall sample size | |||
Not applicable for 2020. |
|||
| 18.1.2.2.6. Method of allocation of the overall sample size | |||
| Not applicable | |||
| 18.1.3. Core data collection on the frame extension | |||
See sub-categories below. |
|||
| 18.1.3.1. Coverage of agricultural holdings | |||
| Not applicable | |||
| 18.1.3.2. Sampling design | |||
Not applicable |
|||
| 18.1.3.2.1. Name of sampling design | |||
| Not applicable | |||
| 18.1.3.2.2. Stratification criteria | |||
| Not applicable | |||
| 18.1.3.2.3. Use of systematic sampling | |||
| Not applicable | |||
| 18.1.3.2.4. Full coverage strata | |||
Not applicable |
|||
| 18.1.3.2.5. Method of determination of the overall sample size | |||
Not applicable |
|||
| 18.1.3.2.6. Method of allocation of the overall sample size | |||
| Not applicable | |||
| 18.1.4. Module “Labour force and other gainful activities” | |||
See sub-categories below. |
|||
| 18.1.4.1. Coverage of agricultural holdings | |||
| Sample | |||
| 18.1.4.2. Sampling design | |||
For IFS 2020 modules, a single-stage stratified random sample of holdings is used. No sub-samples are drawn, neither for individual survey variables. The following stratification variables are used for the stratification procedure: NUTS2 regions, the size classes of the utilised agricultural area, the relevant crop and livestock variables (e.g. cereals for the production of grain, bovine animals, the farming methods of the holdings (organic/conventional) and the field of specialization of holdings at NUTS2 level. The latter encompass holdings that stand out from the farm population through fields of specialization (e.g. large amounts of livestock, special crops, horticulture) or through the special importance of this production. There is also an additional stratum for the new holdings and common land units. |
|||
| 18.1.4.2.1. Name of sampling design | |||
| Stratified one-stage random sampling | |||
| 18.1.4.2.2. Stratification criteria | |||
| Unit size Unit location Unit specialization Unit legal status |
|||
| 18.1.4.2.3. Use of systematic sampling | |||
| Not applicable | |||
| 18.1.4.2.4. Full coverage strata | |||
The strata plan for the IFS2020 included various full coverage strata, e.g. holdings with large numbers of livestock and organic farming. This report does not contain a list of the full coverage strata for the NUTS2 regions since these are classified nationally as confidential. |
|||
| 18.1.4.2.5. Method of determination of the overall sample size | |||
According to the sampling fraction, the sample size for the IFS 2020 was 76 933 holdings. Since a sample of maximum 80 000 holdings is permitted by national law for the IFS 2020, only approximately 78 000 holdings were selected during the sampling procedure for the IFS in order to take all new holdings into consideration. |
|||
| 18.1.4.2.6. Method of allocation of the overall sample size | |||
| Neymann allocation | |||
| 18.1.4.2.7. If sampled from the core sample, the sampling and calibration strategy | |||
| Not applicable | |||
| 18.1.5. Module “Rural development” | |||
See sub-categories below. |
|||
| 18.1.5.1. Coverage of agricultural holdings | |||
| Sample | |||
| 18.1.5.2. Sampling design | |||
Cf. item 18.1.4.2 Sampling design |
|||
| 18.1.5.2.1. Name of sampling design | |||
| Stratified one-stage random sampling | |||
| 18.1.5.2.2. Stratification criteria | |||
| Unit size Unit location Unit specialization Unit legal status |
|||
| 18.1.5.2.3. Use of systematic sampling | |||
| Not applicable | |||
| 18.1.5.2.4. Full coverage strata | |||
Cf. item 18.1.4.2.4 Full coverage strata. |
|||
| 18.1.5.2.5. Method of determination of the overall sample size | |||
Cf. item 18.1.4.2.5 Method of determination of the overall sample size. |
|||
| 18.1.5.2.6. Method of allocation of the overall sample size | |||
| Neymann allocation | |||
| 18.1.5.2.7. If sampled from the core sample, the sampling strategy and calibration strategy | |||
| Not applicable | |||
| 18.1.6. Module “Animal housing and manure management module” | |||
See sub-categories below. |
|||
| 18.1.6.1. Coverage of agricultural holdings | |||
| Sample | |||
| 18.1.6.2. Sampling design | |||
Cf. item 18.1.4.2 Sampling design |
|||
| 18.1.6.2.1. Name of sampling design | |||
| Stratified one-stage random sampling | |||
| 18.1.6.2.2. Stratification criteria | |||
| Unit size Unit location Unit specialization Unit legal status |
|||
| 18.1.6.2.3. Use of systematic sampling | |||
| Not applicable | |||
| 18.1.6.2.4. Full coverage strata | |||
Cf. item 18.1.4.2.4 Full coverage strata. |
|||
| 18.1.6.2.5. Method of determination of the overall sample size | |||
Cf. item 18.1.4.2.5 Method of determination of the overall sample size. |
|||
| 18.1.6.2.6. Method of allocation of the overall sample size | |||
| Neymann allocation | |||
| 18.1.6.2.7. If sampled from the core sample, the sampling strategy and calibration strategy | |||
| Not applicable | |||
| 18.1.12. Software tool used for sample selection | |||
The preliminary assessments for the sample design were conducted using the statistical software SAS. The method of “controlled sampling” was used by the Statistical Offices of the Länder for the random selection of the sample holdings. Using the national STIA sampling program it was possible to draw any number of independent samples for this. For each of these samples an extrapolation of the stratification variables was carried out. The extrapolated results were then compared with the corresponding totals of the sampling frame and the sample with the least deviations compared with the corresponding total values of the control variables was chosen. |
|||
| 18.1.13. Administrative sources | |||
See sub-categories below. |
|||
| 18.1.13.1. Administrative sources used and the purposes of using them | |||
The information is available on Eurostat's website. |
|||
| 18.1.13.2. Description and quality of the administrative sources | |||
See the attached Excel file in the Annex. Annexes: 18.1.13.2. Description quality administrative source |
|||
| 18.1.13.3. Difficulties using additional administrative sources not currently used | |||
| None | |||
| 18.1.14. Innovative approaches | |||
The information is available on Eurostat's website. |
|||
| 18.2. Frequency of data collection | |||
The IFS is conducted every 3 to 4 years. |
|||
| 18.3. Data collection | |||
See sub-categories below. |
|||
| 18.3.1. Methods of data collection | |||
| Paper auto-questionnaire Telephone, non-electronic version Use of Internet |
|||
| 18.3.2. Data entry method, if paper questionnaires | |||
| Manual | |||
| 18.3.3. Questionnaire | |||
| Restricted from publication | |||
| 18.4. Data validation | |||
See sub-categories below. |
|||
| 18.4.1. Type of validation checks | |||
| Data format checks Completeness checks Routing checks Range checks Relational checks Comparisons with previous rounds of the data collection Comparisons with other domains in agricultural statistics |
|||
| 18.4.2. Staff involved in data validation | |||
| Staff from local departments | |||
| 18.4.3. Tools used for data validation | |||
The national AGRA2010 processing program was the main instrument for completeness and plausibility checks. This program stores more than 800 obligatory and facultative error tests and many automated corrections. |
|||
| 18.5. Data compilation | |||
Since the modules of IFS 2020 are a random sample, the data compiled must be extrapolated. The results of the sample were extrapolated using the Horvitz–Thompson estimator. The weight is the inverse value of the sampling fraction, i.e. per stratum N/n whereby N = stratum size and n = sample size per stratum. The smaller the sample size in each stratum, the greater the extrapolation factor. Holdings from a full coverage stratum, e.g. new holdings or holdings with large amounts of livestock and organic farming are given the weight 1. The extrapolation factor for sample holdings is adjusted for “true” non-responses. For this, a correction factor was included in the extrapolation method in the sample survey. Under the assumption that the “true” non-responses possess the same structure as the units that responded, the mathematical adjustment was made so that only the observed values of the effective sample size were used to identify the extrapolation factor, i.e. nstrata minus the number of “true” non-responses within strata. This correction extrapolation factor is not adjusted for not sample holdings. Therefore, the core data are not treated for non-response and that explains the slightly different population sizes using the data for core and the data for the modules. |
|||
| 18.5.1. Imputation - rate | |||
Not applicable. We use some imputations for different missing values, but we do not have an imputation rate. |
|||
| 18.5.2. Methods used to derive the extrapolation factor | |||
| Non-response adjustment | |||
| 18.6. Adjustment | |||
Covered under Data compilation. |
|||
| 18.6.1. Seasonal adjustment | |||
Not applicable to Integrated Farm Statistics, because it collects structural data on agriculture. |
|||
|
|||
See sub-categories below. |
|||
| 19.1. List of abbreviations | |||
AGRA2010 – Processing program for completeness and plausibility checks AgrStatG – Agrarstatistikgesetz (Law on Agricultural Statistics) AMT – AGRATAB Management Tool AWU – Annual working units BLE – Federal Office of Agriculture and Food BMEL – Federal Ministry of Food and Agriculture of Germany BStatG – Bundesstatistikgesetz (Federal Statistics Law) CAP – Common Agricultural Policy CoP – Code of Practice DBV – German Farmers’ Association DG AGRI – Directorate-General for Agricultural and Rural Development DG CLIMA – Directorate-General for Climate Action DG ENV – Directorate-General for the Environment DG SANTE – Directorate-General for Health and Food Safety EEA – European Environment Agency EFQM – European Foundation for Quality Management ELER – European Agricultural Fund for Rural Development ESTAT – Eurostat FAO – Food and Agriculture Organization of the United Nations FSS – Farm Structure Survey GbR – Gesellschaft bürgerlichen Rechts GHMAN – Geheimhaltungsmanagementtool HIT – Herkunfts- und Informationssystem für Tiere (Bovine Register) InVeKoS – Integriertes Verwaltungs- und Kontrollsystem (IACS) IACS – Integrated Administration and Control System IFS – Integrated Farm Statistics JRC – Joint Research Centre LSU – Livestock units NACE – Nomenclature of Economic Activities NUTS – Nomenclature of Territorial Units for Statistics OECD – Organisation for Economic Co-operation and Development ONAs – Other National Authorities QAF – Quality Assurance Framework SGM – Standard gross margin SO – Standard output STIA – Sampling program TQM – Total Quality Management UAA – Utilised agricultural area ZVG – German Horticultural Association |
|||
| 19.2. Additional comments | |||
No additional comments. |
|||
|
|||
|
|||