Farm structure (ef)

National Reference Metadata in ESS Standard for Quality Reports Structure (ESQRS)

Compiling agency: French ministry of agriculture and food  (Ministère de l'Agriculture et de l'Alimentation): http://agriculture.gouv.fr/ Statistical and Foresight Department (Service de la Statistique et de la Prospective): http://agreste.agriculture.gouv.fr/


Eurostat metadata
Reference metadata
1. Contact
2. Statistical presentation
3. Statistical processing
4. Quality management
5. Relevance
6. Accuracy and reliability
7. Timeliness and punctuality
8. Coherence and comparability
9. Accessibility and clarity
10. Cost and Burden
11. Confidentiality
12. Comment
Related Metadata
Annexes (including footnotes)


For any question on data and metadata, please contact: Eurostat user support

Download


1. Contact Top
1.1. Contact organisation

French ministry of agriculture and food  (Ministère de l'Agriculture et de l'Alimentation):

http://agriculture.gouv.fr/

Statistical and Foresight Department (Service de la Statistique et de la Prospective):

http://agreste.agriculture.gouv.fr/

1.2. Contact organisation unit

Department of agricultural, forest and agrifood statistics (Sous-direction des statistiques agricoles, forestières et agroalimentaires: SDSAFA)

Unit of structural, environmental and forestry statistics (Bureau des Statistiques Structurelles, Environnementales et Forestières: BSSEF)

1.5. Contact mail address

MAA- SG

SSP-BSSEF
Complexe agricole d'Auzeville
BP 32688
31326 CASTANET TOLOSAN


2. Statistical presentation Top
2.1. Data description
1. Brief history of the national survey 

The first farm structure survey was conducted in France in 1967 for European needs. Between 2000 and 2010 (census), there were 3 FSS : 2003, 2005 and 2007.

Since 2010 census, there were 2 FSS : FSS2013 and FSS2016.

FSS surveys include Eurostat's needs, and some national questions.

For the first time, the 2016 survey included the orchard survey for Eurostat needs (Regulation(EU) No 1337/2011). We carried out in 2013 an orchard census for these Eurostat needs.


2. Legal framework of the national survey 
- the national legal framework

The legal framework for French FSS survey is the Eurostat legal framework : Regulations 1166/2008 and 715/2014. 

In 2016, it also includes orchard statistics legal framework: Regulation 1337/2011.

The statistical service of the French Ministry of Agriculture , which is an integral part of the public statistics system, acted as contracting owner and project manager.

- the obligations of the respondents with respect to the survey

The law obliges farmers to give precise answers to the questions asked.
Failure to reply or a deliberately inaccurate response gives rise to court proceedings, and an administrative fine is imposed as the final penalty.

- the identification, protection and obligations of survey enumerators Survey interviewers are recruted by regional statistical services. They are bound by professional secrecy.
2.2. Classification system

[Not requested]

2.3. Coverage - sector

[Not requested]

2.4. Statistical concepts and definitions
List of abbreviations
BALSA: Database for agricultural statistics, our agricultural register (Base de Sondage pour la Statistique Agricole)
BDNI: National databasis for bovine animals identification (Base de Données Nationale d'Identification pour les Bovins)
CAP: Common Agricultural Policy
EDE: livestock identifier
FSS: Farm Structure Survey
IACS:  Integrated Administration and Control System, for Common Agricultural Policy --> CAP area declarations datablase. 
PACAGE: CAP identifier
SAA: Annual Agricultural Statistics (Statistique agricole annuelle)
SIRET: Identification system of business register Système d'identification du répertoire des établissements


Organisations 
SSP: Statistical and Foresight Department (Service de la Statistique et de la Prospective)
SDSAFA: Department of agricultural, forest and agrifood statistics (Sous-direction des statistiques agricoles, forestières et agroalimentaires)
BSSEF: Unit of structural, environmental and forestry statistics (Bureau des Statistiques Structurelles, Environnementales et Forestières)
BMIS: Unit of methods and information for statistics (Bureau des méthodes et de l'information statistique)
2.5. Statistical unit
The national definition of the agricultural holding

The FSS 2016 covers the entire scope of the EU Regulation.

See 2.6 for thresholds.

2.6. Statistical population
1. The number of holdings forming the entire universe of agricultural holdings in the country
  • In 2010, according to our census results, there were 491 000 agricultural holdings in mainland France and around 25 000 agricultural holdings in overseas departments (Guadeloupe, Martinique, La Réunion, Guyane).
  • FSS 2016 universe is our national agricultural register, which is our sampling database called BALSA. Balsa is constructed with 2010 census farms, plus administrative data and surveys results in order to update 2010 census and to add new farms. The total number of farms of this universe for FSS sample was 546 285.


2. The national survey coverage: the thresholds applied in the national survey and the geographical coverage

National Thresholds

The general threshold is 1 hectare of UAA, except for certain types of specialised production, where it is lower:

- The threshold is 20 ares for the following crops :

  • hop (B_1_6_2),
  • tobacco (B_1_6_1),
  • aromatic, medicinal and culinary plants (B_1_6_12)
  • vegetable, floral, fodder or industrial seeds
  • fresh vegetables, melons and strawberries outdoor - open field (B_1_7_1)
  • floral and ornamental crops (B_1_8)
  • permanent crops (vineyards, orchards, berry plantations) (B_4)
  • tree nurseries (B_4_5) : wine-producing, ornamental, orchard, forestry.

- If the holding does not own at least 1 ha of UAA or is not over the previous thresholds, the survey covers units that have :

Mainland France:

 at least:

... or which produced at least the following over the 2015 - 2016 agricultural production year:

  • 1 male breeder used regularly: stallion, donkey, bull, ram, boar, billygoat, etc.
  • 1 brood or mule mare
  • 1 cow (C_2_6 + C_2_99)
  • 2 bovine animals over the age of two years (C_2_4 + C_2_5)
  • 1 breeding sow (C_4_2)
  • a fattening house or breeding house for cattle, pigs, etc.
  • 6 breeding ewes (C_3_1_1)
  • 6 breeding nanny-goats (C_3_2_1)
  • 10 breeding doe rabbits (C_6)
  • 100 laying hens (all species) (C_5_2)
  • an incubation capacity of 1 000 eggs
  • 10 working beehives (C_7)
  • a fur farm breeding, for example, mink, coypu, chinchillas, goats and angora rabbits
  • a game farm producing game for slaughter or sale, excluding hunting


  • 2 horses for slaughter
  • 5 battery calves
  • 5 pigs (C_4)
  • 10 sheep for slaughter (C_3_1_99)
  • 10 goats for slaughter (C_3_2_99)
  • 200 rabbits for meat
  • 500 fattening poultry (all species) (C_5_1 + C_5_3)
  • 50 rick poultry
  • 10 000 eggs


  • 20 ares of asparagus
  • 20 ares of cabbage for sauerkraut
  • 15 ares of strawberries
  • 5 ares for market gardening (not intended only for own consumption) (B_1_7_1_2)
  • 5 ares of flower or ornamental crops (B_1_8)
  • 10 ares of vineyard producing protected designation of origin (PDO) wines (appellation d' origine protégée, formerly "AOC" [appellation d'origine côntrolée])
  • 10 ares of various crops under greenhouses or high cover (except tree nurseries) (B_1_7_2 + B_1_8_2)
  • 5 ares of champagne vineyards
  • 5 ares of tree nurseries (B_4_5) : wine-producing, ornamental, orchard, forestry


  • 2 tons of chicory
  • 1 ton of mushrooms (B_6_1)
  • cress for sale.


In the overseas departments:

at least:

...or which have been farmed over the 2015 - 2016 production year at least:

  • 1 male breeder used regularly: stallion, donkey, bull, ram, boar, billygoat, etc.
  • 1 brood or mule mare
  • 1 cow (C_2_6 + C_2_99)
  • 2 bovine animals over the age of two years (C_2_4 + C_2_5)
  • 1 breeding sow (C_4_2)
  • 6 breeding ewes (C_3_1_1)
  • 6 breeding nanny-goats (C_3_2_1)
  • 10 breeding doe rabbits (C_6)
  • 50 laying hens (all species) (C_5_2)
  • an incubation capacity of 1 000 eggs
  • 10 working beehives (C_7)
  • a fur farm breeding, for example, mink, coypu, chinchillas, goats and angora rabbits
  • a game farm producing game for slaughter or sale, excluding hunting


  • 2 horses for slaughter
  • 5 battery calves
  • 3 pigs (C_4)
  • 10 sheep for slaughter (C_3_1_99)
  • 10 goats for slaughter (C_3_2_99)
  • 200 rabbits for meat
  • 200 broilers (all species) (C_5_1)
  • 100 rick poultry (C_5_3)
  • 10 000 eggs


  • 10 ares of export variety bananas
  • 10 ares of pineapple or other semi-permanent crops of fruit (passion fruit, etc.)
  • 10 ares of sugar cane
  • 10 ares of various crops under greenhouses or high cover (excluding tree nurseries) (B_1_7_2 + B_1_8_2)
  • 5 ares geranium, vetiver, pepper, vanilla, etc.
  • 10 ares vineyard producing protected designation of origin (PDO) wines (appellation d' origine protégée], formerly "AOC" [appellation d'origine côntrolée])
  • 5 ares of fresh vegetables under vegetable or flower crop rotation (not intended for own consumption) (B_1_7_1_2)
  • 5 ares of flowers or ornamental crops (B_1_8)
  • 5 ares of tree nurseries: winegrowing, ornamental, orchard, forestry (B_4_5)


The survey uses a threshold of 1 hectare of utilised agricultural area, thus art 3.2 is not applicable.

The thresholds used for farms are lower than the ones proposed by the European regulation.

With these thresholds, holdings with at least 1000 poultry or 10 bovine animals are covered.

Geographical coverage

The geographical scope is mainland France and four overseas departments: Guadeloupe, Martinique, Guyana and Réunion.

In Guyana, the FSS only concerns coastal zone or  reachable areas ; which represents 50 % of total farms : based on 2010 census results, 3000 farms are excluded from the geographical scope since, there are less representative of Guyana agriculture, and collecting data in this area is very expensive (5 983 farms in total in Guyane in 2010).

In the French overseas departments, the territories of Saint-Martin, Saint-Barthélemy and Mayotte are excluded.


3. The number of holdings in the national survey coverage 
FSS 2016 : 456 520 holdings - 437 416 for mainland France.


4. The survey coverage of the records sent to Eurostat
There is no difference between the national coverage and the coverage of the records sent to Eurostat.


5. The number of holdings in the population covered by the records transferred to Eurostat
FSS 2016 : 456 520 holdings - 437 416 for mainland France.


6. Holdings with standard output equal to zero included in the records sent to Eurostat

There are 55 units (without weights) with a standard output equal to 0.

- 27 are with

- 4 units are with


7. Proofs that the requirements stipulated in art. 3.2 the Regulation 1166/2008 are met in the data transmitted to Eurostat
Th


8. Proofs that the requirements stipulated in art. 3.3 the Regulation 1166/2008 are met in the data transmitted to Eurostat

The thresholds used for farms are lower than the ones proposed by the European regulation:

•hops (B_1_6_2),

•tobacco (B_1_6_1),

•aromatic, medicinal and culinary plants (B_1_6_12)

•vegetable, floral, fodder or industrial seeds

•fresh vegetables, melons and strawberries outdoor – open field (B_1_7_1)

•floral and ornamental crops (B_1_8)

•permanent crops (vineyards, orchards, berry plantations)(B_4)

•tree nurseries (B_4_5): wine-producing, ornamental, orchard, forestry.

2.7. Reference area
Location of the holding. The criteria used to determine the NUTS3 region of the holding

The criteria used to determine the location of the holding is the location of its main agricultural building, or the location of the biggest parcel (physical size) if there are no buildings.


2.8. Coverage - Time
Reference periods/dates of all main groups of characteristics (both included in the EU Regulation 1166/2008 and surveyed only for national purposes)

The reference period for data on crops, production methods and labour is the 2015-2016 agricultural production year (1 November 2015 to 31 October 2016). 
For livestock, the date is 1 November 2016 or, in case of cull, the day before the cull.

For rural development measures : measures approved for 2014, 2015 or 2016.

2.9. Base period

[Not requested]


3. Statistical processing Top
1.Survey process and timetable


1. definition of survey objective and requirements:  
  1.1. formation of workgroups for survey organisation  September 2015
  1.2. consultation of users September - November 2015
2. survey design:   
  2.1. set-up organisation of the survey (e.g. detailed timetable, specification of resources, costs estimation)  June 2015
  2.2. design of the sampling frame and sampling procedures  September - December 2015
  2.3. design of data questionnaire  December 2015
  2.4. design of data processing procedures (e.g. CATI/CAPI/CAWI input programmes etc.)  February - September 2016
3. data collection:  
  3.0. sampling frame construction and sample selection  July 2016
  3.1. Documentation : Handbook preparation  June - September 2016
  3.2. recruitment of interviewers June - August 2016
  3.3. training of interviewers September 2016
  3.4. fieldwork October 2016 - February 2017
  3.5. evaluation and assessment of fieldwork  July 2017
4. data processing and validation:  
  4.2. data validation (at record level) December 2016 - April 2017
  4.3. data correction and imputation April 2017  - March 2018
5. data compilation:  
  5.1. weight calculation and estimation February 2017 - June 2018
  5.2. calculation of derived variables June - September 2017 (standard output, livestock units)
  5.3. calculation of quality indicators June 2017 - June 2018
  5.4. aggregation and tabulation June 2017 - June 2018
  5.5. validation of aggregated data June 2017 - June 2018
6. data analysis  October 2017 - July 2018
7. data dissemination  June 2018 and after


2. The bodies involved and the share of responsibilities among bodies

National organisation

The Statistical and Foresight Department (Service de la Statistique et de la Prospective) of French Ministry of Agriculture is in charge of FSS surveys  :

- a project manager is working with other people in the unit of structural, environmental and forestry statistics (BSSEF) ; 

- the Methods and Information technology Unit (BMIS) of the Statistical and Foresight Department provides support on sample selection, CAPI development, weights calculation, quality indicators.

- 1 person responsible for IT systems

- 1 person responsible for methods

Regional Organisation (NUTS 2 or merged NUTS 2)

In each French region (NUTS 2 or merged NUTS 2 areas: 13 in regions  + 5 in overseas areas), there is a regional statistic and economical service for data collection, data validation and data dissemination. They are in charge of recruiting, training interviewers, planning and monitoring the work of the interviewers, data collection and first level validation.

For FSS 2016, 881 interviewers took part in data collection.


3. Serious deviations from the established timetable (if any)

Weight calculation were longer than expected.

We did different weight calculation regarding first aggregated results.

See 3.5 for weight calculations and 6.3.1 for coverage issues.

3.1. Source data
1. Source of data

Our data source is BALSA. The scope of 2016 Farm Structure Survey is a total of 546 285.

BALSA was constructed with 2010 census farms, and has been updated since 2010 with:

  • administrative data : French business register, IACS (CAP area declarations database), BDNI data (Bovine animals register)
  • national survey results.

The 2016 data is collected for a sample of holdings for which some characteristics are taken from administrative sources.


2. (Sampling) frame

We used our agricultural statistical register (BALSA) for the FSS 2016 sample.  It is a list frame of agricultural holdings with several characteristics useful to realize samples:

- farm type based on 2010 census results which may have been updated. For a few farms, we used administrative information from business register  (NACE code);

- Agricultural area characteristics if any, from 2010 census results or from IACS;

- Information on animals if any, from 2010 census results or from our bovine register (BDNI);

Our Statistical register is updated with administrative data once a year. It was updated in July 2016 for the FSS 2016 sample.


3. Sampling design
3.1 The sampling design

FSS sample is a stratified sample. We used a single stage sampling. Sampling units are agricultural holdings.

The sample is a balanced sample by NUTS 3 on standard output,  legal status and type of farming for organic farms and non organic farms.

3.2 The stratification variables

The stratification is based on:

- NUTS3,

- Farm type :

  • 1) field crops
  • 2) Horticulture, vineyards
  • 3) Fruits and Other permanent crops
  • 4) Grazing livestock
  • 5) Granivores (Pigs and Poultry Distinguished in FR52)

- standard output :

  • Small farms : SO <= 25 000 €
  • Medium farms : 25 000 € < SO <= 100 000 €
  • Big farms : 100 000 € < SO up to 1 500 000 €

- organic production : YES / NO

Specific strata

Specific strata were defined for : 

- collective units

- vacant units

- FADN units

- full coverage strata

In total, there are 3 925 strata in FSS 2016 sample.

3.3 The full coverage strata

There are full coverage strata for :

- units with standard output above 1 500 000 € and / or

- with 50 permanent salaried people or more and / or

- producing 500 tons of mushrooms or more and / or

- producing 300 tons of endives (or chicons) or more in some regions - FR21 / FR22 / FR30 and / or

- unusual farms regarding their economical size (the size criterion depends on the region and the production considered)

- FADN farms (which were not selected in the sample: 5 701 units).

3.4 The method for the determination of the overall sample size

The sample size has been defined in order to meet several requirements: 

- the cost of the survey: maximum 70 000 units in total

- RSE by NUTS 2 under 5 % for productions in Annex IV of 1166/2008 Regulation;

- RSE by NUTS 2 under 5 % for other productions:

non dairy cows / breeding sows / vegetables - FR52

poultry - FR26

potatoes - FR22, FR30

sugar beet - FR30

other bovine - FR71,  FR43

sheep - FR61, FR63

- RSE by NUTS3 under 5 % for SO of organic farms; 

- RSE by NUTS3 under 2.5 % for SO of non organic farms;

- integration of the 7 500 FADN farms in the sample;

- RSE at the national level under 3 % for orchard characteristics.

3.5 The method for the allocation of the overall sample size
The sample was allocated by a Neyman allocation, using the standard output for calculating the standard deviation.
3.6 Sampling across time
A new sample was designed in 2016, different from FSS 2013 one as we have, now, an updated farm register (BALSA).
3.7 The software tool used in the sample selection
SAS software was used (MACRO CUBE - INSEE)
3.8 Other relevant information, if any
Common lands: in a full coverage strata in NUTS 2 with less than 100 common lands.

In other NUTS 2 areas (FR 61, FR 81, FR 82, FR 71); common lands are selected with a precision requirement of 10 % regarding the utilised agricultural area.

Vacant farms: in a full coverage strata in NUTS 2 regions with less than 50 vacant farms. In other NUTS 2 regions, we set a limit of 50 farms. 


4. Use of administrative data sources
 
Name Time reference  Updating  Legal basis
Business register   Once a year for our use National regulation - business code - R. 123-220 - R. 123-234
BDNI : National database for bovine animals identification 1st november 2016 Daily National regulation - rural code R. 212-16 and D. 212-19
CAP area declarations (IACS) April-May 2016 Once a year European regulation 1307/2013 direct payments
CAP - second pilar payments (Not yet used)   Once a year European regulation 1305/2013 rural development
Geographical information -areas facing natural or other specific constraints   2016 European regulation 1305/2013 rural development - article 32
4.2 Organisational setting on the use of administrative sources

The official statistical service (SSP) of the Ministry in charge for Agriculture (MAAF) is entitled by law to access administrative registers, such as SIRENE, data from CAP aid declarations (IACS), BDNI (national identification database), etc. 

Name Organisational setting Participation to the conceptual design
Business register Database managed by French National Institute of Statistics (INSEE) No
BDNI: National database for bovine animals identification Data collected by agricultural chambers (chambres d'agriculture) ; processed by French ministry of agriculture (French general directorate for food) No
CAP area declarations Data collected and processed by our national Services and Payment Agency (ASP)
No
CAP - second pilar payments Data collected and transmitted by our national Services and payment agency  No
Geographical information -areas facing natural or other specific constraints Data of the French Ministry of Agriculture No
4.3 The purpose of the use of administrative sources - link to the file

Please access the information in the file at the link: (link available as soon as possible)


4.4 Quality assessment of the administrative sources
  Method  Shortcoming detected Measure taken
- coherence of the reporting unit (holding) Business register: we use NAF code in order to select units which may be agricultural units for our agricultural register BALSA.
BDNI: identification number EDE is an identification number for a livestock. A farm may have several EDE. Thus several EDE where prefilled in FSS for a farm, with business register identification key. 
   
- coherence of definitions of characteristics BDNIThis database was used to obtain information on bovine herds which allowed a standardised description of the bovine population held by farmers on 1 November. All information on the age of the cattle is included in the BDNI.
 
CAP area declarations: CAP classification is different from FSS list of type of areas.

CAP area declarations:
We thus only prefill with 2015 data for some crops with a good matching in FSS and CAP declaration.

- coverage:      
 over-coverage   BDNI: 0,4% of FSS units with bovine animals in administrative data but not declared in FSS (97 units) BDNI: We considered that administrative data is true. We got bovine numbers from BDNI. 
 under-coverage  

CAP area declarations: ~= 80 % of farmers realise a CAP area declaration

BDNI 2 % of units with bovine animals declared in FSS but not in BDNI (478)

CAP data only used for farms with cap payments, for the others, we only have data from 2010 census or FSS 2013 if in the sample.

BDNI:We considered that administrative data is true. We put 0 for bovine in FSS. 

 misclassification      
 multiple listings Business register, BDNI, CAP declarations: we asked local supervisors to check administrative identifiers which were used for more than one farm in the sample and to correct it    
- missing data There are no missing data    
- errors in data The only errors that can appear would be due to erroneous identification numbers, but it is hard to measure.  BDNI: for 243 units, there are cows in BDNI but not declared in FSS BDNI: we used the breed declared in BDNI to know whether cows are dairy cows or not. 
- processing errors There are no processing errors that we know.     
- comparability No surprising incoherence was detected.    
- other (if any) Nothing to mention.     


4.5 Management of metadata

Our management of metadata depends on the sources, as different units from our services are involved.

Business register

Database managed by French National Institute of Statistics (INSEE)

BDNI: National database for bovine animals identification Metadata describing this source is stored and maintained over time in a text file
CAP area declarations Metadata describing this source is stored and maintained over time in a text file
CAP - second pillar payments Metadata describing this source is stored and maintained over time in a text file
Geographical information -areas facing natural or other specific constraints No metadata
4.6 Reporting units and matching procedures
Matching procedure Reporting unit Identifier  
Business register Establishment of a business SIRET: identification system of the business register  
BDNI Livestock identifier EDE: may be more than one for a SIRET Exact matching on SIRET
CAP data (IACS) Farm asking for payments PACAGE Exact matching on SIRET
4.7 Difficulties using additional administrative sources not currently used
No difficulties.
3.2. Frequency of data collection
Frequency of data collection

Between 2010 and 2020, FSS data is collected in 2013 and in 2016.

3.3. Data collection
1. Data collection modes

The FSS 2016 was conducted in face-to-face interviews. An interviewer visits holdings to get the required data.

We used computer-assisted personal interviewing (CAPI) on touch screen table PCs (Stylus).


2. Data entry modes
Electronic data capture during personal interview


3. Measures taken to increase response rates

When an interviewer was confronted with a first refusal, he/she had to inform the competent regional service, which tried to obtain a response. This procedure made it possible to solve most cases of refusal.

Regional services sent written reminder letters.


4. Monitoring of response and non-response
1

Number of holdings in the survey frame plus possible (new) holdings added afterwards

In case of a census 1=3+4+5

546 285

No holding introduced afterwards

 
2

Number of holdings in the gross sample plus possible (new) holdings added to the sample

Only for sample survey, in which case 2=3+4+5

71 341

No holding introduced afterwards

3 Number of ineligible holdings 4 623
3.1

Number of ineligible holdings with ceased activities

This item is a subset of 3.

4 623
4

Number of holdings with unknown eligibility status

4>4.1+4.2

4 341

4.1 Number of holdings with unknown eligibility status – re-weighted  4 341
4.2 Number of holdings with unknown eligibility status – imputed  0
5

Number of eligible holdings

5=5.1+5.2

62 377
5.1

Number of eligible non-responding holdings

5.1>=5.1.1+5.1.2

0
5.1.1 Number of eligible non-responding holdings – re-weighted 0
5.1.2 Number of eligible non-responding holdings – imputed 0
5.2 Number of eligible responding holdings 62 377
6

Number of the records in the dataset 

6=5.2+5.1.2+4.2

62 377


5. Questionnaire(s) - in annex
The questionnaire contains specific questions for overseas areas. Some questions are asked for mainland France but not for overseas departements.

The questionnaire contains specific questions for orchard Eurostat statistics needs.


Annexes:
3.3-5. FSS 2016 national questionnaire
3.4. Data validation
Data validation

We applied different levels of validation:

1) Validation rules integrated in the application (CAPI) 

There are different kinds of checks: minor or major errors, with or without compulsory comments.

There are data format checks, completeness checks, relational checks, consistency checks.

See annex for consistency checks.

Questionnaires involving major controls cannot be transmitted to the central server by the interviewer unless this is specifically requested.

In such cases, the regional service must correct the ongoing anomaly, possibly by asking the farmer to provide additional information.
Comments can be written by interviewer or statistical services in order to justify the persistence of an error.

2) Additional checks, during data collection, underlying some errors, for regional statistical services: Daily automatically updated with a specific online application related to CAPI.

  • checks on administrative identification numbers (EDE / PACAGE / SIRET) for multiple identifiers,
  • examination of maximum values at the NUTS 2 or merged NUTS 2 level for some characteristics,
  • other checks: if there seems to be no production; checks on collective units; specific checks for some erros on CAPI integrated validation rules etc.

3) Validation rules applied on CAPI extraction: central staff (the same as integrated in the CAPI application and other ones) (with SPSS); including Eurostat validation rules.

4) Eurostat validation rules applied on the FSS 2016 file created: central staff; after national validation (with SPSS)

5) Control of aggregated data:

central staff  and regional staff: comparisons with 2010 census results on main indicators at the NUTS 2 or 3 level. 

central staff only: comparisons with annual agricultural statistics results for main categories of UAA or some results on animals (heads). See 6.3.1 for weight calculation.


Our steps to produce datasets are:


Export from CAPI application (csv files)


Set of corrections; calculations; validations; format adjustment


Validated dataset


Used to produce 2 datasets: FSS 2016 file for EUROSTAT (csv file)/ FSS 2016 national files (sav files)


Annexes:
3.4. List of coherence checks within our CAPI questionnaire
3.5. Data compilation
Methodology for determination of weights (extrapolation factors)
1. Design weights

In each stratum, design weights are: the size of the population in the stratum by the size of the sample in the stratum:

                Nh/nh in stratum h

                N number of units in the population

                n number of units in the sample

2. Adjustment of weights for non-response
We applied re-weighting for non-response within response homogeneity groups (farm type, NUTS2 or NUTS2 aggregates (French regions)).
3. Adjustment of weights to external data sources

We did several weight adjustments, particularly because we had coverage problems, see 6.3.1.

External data sources  Period FSS adjusted characteristics Geographical level of adjustment
CAP area declarations  2016 Number of CAP declarants  NUTS 3
CAP area declarations  2016 Arable land NUTS 3
National Annual Agricultural Statistics 2016 Vineyards areas  NUTS 3
National Annual Agricultural Statistics 2016 Number of cows NUTS 3
National Annual Agricultural Statistics 2016 Number of breeding sows NUTS 3
National Annual Agricultural Statistics 2016 Number of ewes NUTS 3
National orchard census 2012 Apples
Pears
Peaches
Plums
Apricots
Cherries
Walnuts
Kiwis
--> Areas and number of producers
Main producing NUTS3
CAP area declarations  2016 Bananas
--> Areas and number of producers
Main producing NUTS3


4. Any other applied adjustment of weights
  • Extreme weights were trimmed for units with vineyards; with fresh vegetables, melons and strawberries, UAA>0; ewes; and breeding sows within each stratum. 
  • We adjusted the weights  for some ceased units for which the buyer was interviewed while he was not in the sample but in the population: weight = 1 for 2 680 units.
  • 11 units were classified in the exhaustive strata regarding their size after data collection.
3.6. Adjustment

[Not requested]


4. Quality management Top
4.1. Quality assurance

[Not requested]

4.2. Quality management - assessment

[Not requested]


5. Relevance Top

Several user committees were organised. 

They covered:

  • the main directorates of the Ministry of Agriculture and Fisheries,
  • the Institut National de Recherche Agronomique (INRA, National Institute of Agronomic Research),
  • the Assemblée Permanente des Chambres d’Agriculture (APCA, Permanent Assembly of the Chambers of Agriculture),
  • the professional organisations,
  • the organic farming agency,
  • regional representatives, etc.

They gave their opinions on the various aspects of the questionnaire and on the instructions to interviewers.

5.1. Relevance - User Needs
Main groups of characteristics surveyed only for national purposes 

Some questions were added for national purposes :

     - administrative identification numbers,

     - farm management: tax system; details on rented UAA,

     - details on land categories (in particular for fruits),

     - questions on pasture management; livestock breeding capacities; poultry annual production,

     - quality certification schemes and marketing via low food-mile systems. These relate to production and marketing systems which are encouraged.

     - diversification via a body which is legally separate from the farm.

     - detailed questions on labour force; for exampe non-salaried people working on societies or partnerships.

5.2. Relevance - User Satisfaction

[Not requested]

5.3. Completeness
Non-existent (NE) and non-significant (NS) characteristics - link to the file. Characteristics possibly not collected for other reasons

Please access the information in the file at the link: (link available as soon as possible)

5.3.1. Data completeness - rate

[Not requested]


6. Accuracy and reliability Top
6.1. Accuracy - overall
Main sources of error

The main source of errors is coverage error. See 6.3.1.

There are some measurement erros for some specific questions related to soil and manure management practices.

6.2. Sampling error
Method used for estimation of relative standard errors (RSEs)

The estimation of RSEs, expressed as a percentage, is equivalent to the coefficient of variation. It is estimated by the formulae:


Where   
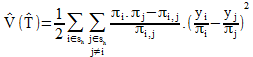
is the estimated variance of the estimator, and    is the estimator of the total.

The stratification accounts for the calculation of the double inclusion probabilities that will be used for the calculation of the variance.

A calibration on margins is carried out. We proceed as follows:

  • in each calibration post-stratum, the variable Y is regressed on the variables used for margin calibration, with weighting as the weight before calibration, after which the residuals  of the regression are retrieved;

  • the variable  is created : , where  is the weight at the output of the calibration on margins;

  • this variable is used as input for classical variance calculation formulae, instead of Y (i.e. replace  with  ).

To estimate the double inclusion probabilities of units, the following formula is used:


The variance is then calculated as follows :


Tool

SAS macro developed within our agricultural statistical service ("macro CALVA")

6.2.1. Sampling error - indicators

1. Relative standard errors (RSEs) - in annex

2. Reasons for possible cases where precision requirements are applicable and estimated RSEs are above the thresholds
7 cases for which estimated RSEs are above the threshold (5%):

- NUTS2 - permanent grasslands excluding rough grazing ; FR82 Estimated RSE = 10.5 %

- NUTS 2 - other pigs ; FR51 Estimated RSE = 7.1 %

- NUTS 2 - poultry ;

  • FR51 Estimated RSE = 5.6 %;
  • FR52 Estimated RSE = 6.6 %
  • FR53 Estimated RSE = 12.3 %                          
  • FR61 Estimated RSE = 5.7 %

- NUTS1 - poultry ; FR2 Estimated RSE = 9.78 %.

Concerning the area of pasture and meadow in FR82, we knew before conducting FSS that the precision could be above the thresholds: farms in this region are very scattered. To improve lightly the RSE, we should have added too many questionnaires, for an expensive final cost.

Concerning poultry and other pigs, the deterioration of precision can be due to the fact that we do not well know these farms in our farm register (BALSA). The information necessary when we had to build the sample came mainly from the 2010 census; but there may have been changes for these productions since the census.


Annexes:
6.2.1-1. Relative standard errors
6.3. Non-sampling error

see below

6.3.1. Coverage error
1. Under-coverage errors

In order to avoid disturbing farmers for several agricultural surveys (see 10. Cost and burden), we have excluded 23 000 farms from our frame. Two kinds of units were excluded (negative coordination) :

- 18 000 units which were in the sample of our national survey of agricultural practices for fruit production (surveyed in 2015).  62 % of these units were big farms (Standard Output >= 100 000 euros).

- 5 000 units which were in the sample of our national survey of breeding practices (surveyed in 2015). 65 % ot these units were big farms (Standard Output >= 100 000 euros).

We consequently had an undercoverage in our FSS sample for big fruit farms and big farms with animals. We tried to made corrections after data collection with weight calibration. 

See 3.5 weight calculation.


2. Over-coverage errors

Some units were interviewed although their administrative number was ceased, because they still had an agricultural activity with another administrative number (SIRET).

We should have stopped the survey but we pursued the survey although this new unit may be yet in our farm register (BALSA) with an identification number different from the selected one.

In order to limit the effect of this kind of error, we set weights to 1 for 2 680 units (when we saw that the respondant was yet in our database with another identification number).

We also may have some units that were below the thresholds but we do not know how many (counted with those who have ceased their activity).

2.1 Multiple listings 
In our farm register, 7% of the units do not have an administrative enterprise identification number (SIRET). They were at the 2010 census but, because of the lack of this administrative identification number, we can't find them in any administrative source since 2010. 

They can be ceased or they can have obtained, since 2010, an administrative number and thus they can be twice in our farm register, with and without SIRET.

Furthermore, 1 % of the units of our farm register have a part of the same identification number (SIREN) : one of the SIRET can be ceased but not the other one.

--> We may not correctly notice ceased units in our register.


3. Misclassification errors

We had misclassification for some units : wrong size or wrong  farm type classification at the moment of the sample extraction compared with size or farm type calculated after data collection (~25 % of the units).

We maintained design weights.


4. Contact errors
Regional agents and investigators sought to find out some missing phone numbers or contact errors. 


5. Other relevant information, if any
Not available.
6.3.1.1. Over-coverage - rate
Over-coverage - rate

See 6.3.1 /  2. Over-coverage errors

Proportion of out-of-scope units in the initial population identified with the sampling frame:

NOT AVAILABLE.

If any, very low (under threshold maybe), as we controlled the entered units in our sampling database (BALSA).

We asked respondent units if they are in production or not.    It not, we considered the units as ceased units.

6.3.1.2. Common units - proportion

[Not requested]

6.3.2. Measurement error
Characteristics that caused high measurement errors

1. Fresh vegetables, melons, strawberris - OPEN FIELD or MARKET GARDENING : B_1_7_1_1 / B_1_7_1_2

The source of measurement errors is the complexity to explain the difference between these characteristics in our instructions' document.

We had an unclear formulation of the questions  although we aimed to give clarification compared to FSS2010 or FSS2013. 

We detected errors when we analysed first weighted results compared to FSS2010 and FSS2013.

Actions taken: individual data corrections based on FSS2013 or FSS2010 individual data collected.

2. Permanent Pastures

The source of measurement errors is the complexity of the distinction between B_1_9_1 / B_3_1 / B_3_2 as the categories used for CAP area declaration (IACS) are quite different with a lot of changes in 2015. 

We detected errors when we analysed first weighted results compared to FSS2010 and FSS2013.

Actions taken: individual data corrections based on FSS2013 or FSS2010 individual data collected, for units with > 100 ha of B_3_1 in 2016 but with B_3_2 in 2010.

3. Soil cover  / Share of arable land with crop rotation

The sources of measurement errors are the complexity of the characteristic and the unclear formulation of the question.

Actions taken:

- checks after data collection and individual correction for soil cover (in order to be coherent with arable land area)

- % of arable land with crop rotation: we did not have the same codification on our national questionnaire as in the 715/2014 Regulation.


6.3.3. Non response error
1. Unit non-response: reasons, analysis and treatment

There are two categories of non-respondent units:

   - those which could not be contacted for different reasons: 3 156.

   - and those which were contacted but refused to respond to the survey: 1 185.

We applied re-weighting: new weights for respondents (in production or ceased) with the same NUTS2 and farm type.

To treat the issue of non-response, we first used a logistic regression to determine the characteristics of respondents. We used the Akaike Information Criterion (AIC) and a forward method to conclude that both localization and types of farming were the most significant variables to explain the response. We calculated the probability to answer in new strata built with those two variables. These new strata are what we generally call the homogeneous response groups. We then multiplied the weights of respondent units with the inverse of the probability to answer.


2. Item non-response: characteristics, reasons and treatment

The Computer - Assisted Personal Interviewing (CAPI) interface checked that all the questions had been answered. There was no partial non-response.

6.3.3.1. Unit non-response - rate
Unit non-response - rate

6.5 % (4 341 / 67 000)

  -->  UNIT NON RESPONSE :  3 156 units who could not be contacted +  1 185 who refused to respond to the survey = 4 341

  -->  RESPONDING UNITS : 62 377 in production + 4 623 non producing = 67 000 units

4 341 non responding units, for which we do not know if they were eligible or not (ceased or in production, above or under our thresholds).

According to Eurostat guidelines, the unit non-response rate is calculated as 4341/(4341+62377) giving also 6.5%.

6.3.3.2. Item non-response - rate
Item non-response - rate

There were no partial non-responses.

6.3.4. Processing error
1. Imputation methods

No imputation in 2016. 


2. Other sources of processing errors

% of arable land with crop rotation: we did not have the same codification on our national questionnaire as in the 715/2014 Regulation.

We made calculations in order to have FSS 2016 categories.


3. Tools used and people/organisations authorised to make corrections

- checks in our CAPI survey : direct corrections by surveyers OR permanent agents in regional statistics services;

- validations rules at the national level after data collection to verify consistency; some corrections;

- validation rules in a specific CAPI tool for regional statistical service to check some specific points as maximum values of some characteristics.

See 3. Statistical processing / 3.4 Data validation

6.3.4.1. Imputation - rate
Imputation - rate

No imputation in 2016.

6.3.5. Model assumption error

[Not requested]

6.4. Seasonal adjustment

[Not requested]

6.5. Data revision - policy
Data revision - policy

We only publish FINAL estimates, no preliminary results are published for FSS. 

In 2016, in order to avoid delays, we have strengthened individual data validation (individual checks) after data collection in order to prepare:

- first aggregated results for regional statistical services,

- individual national structure survey data open access for our statistical service (national + regions),

- Eurostat file.

Errors were detected after the first transmission of aggregated results to regional statistical services (sample and weights issue). We prepared thus new version of our files.

With our first publication (called "PRIMEUR"), data is considered final. No more revisions.

6.6. Data revision - practice
Data revision - practice
There was no revision of data after the stage of publication.
6.6.1. Data revision - average size

[Not requested]


7. Timeliness and punctuality Top
7.1. Timeliness

see below

7.1.1. Time lag - first result
Time lag - first result

- First file transmitted to Eurostat: July 2017: 7 months after the end of the year of the survey.

- First aggregated table only for agricultural statistical staff: October 2017: 9 months after the end of the year of the survey.

7.1.2. Time lag - final result
Time lag - final result

First national results: June 2018

Final national file: June 2018.

--> From 31 December 2016 to June 2018: 18 months

Final file transmitted to Eurostat: July 2018

7.2. Punctuality

Lag of 6 months between our initial and final calendars for publication of national results

7.2.1. Punctuality - delivery and publication
Punctuality - delivery and publication


Initial calendar

Final calendar

Time lag

FSS file transmission

June 2017

June 2018

12 months

National publication

December 2017

June 2018

6 months

This delay was mainly due to sample and weighting issues.


8. Coherence and comparability Top
8.1. Comparability - geographical
1. National vs. EU definition of the agricultural holding

The national and the European definitions of the holding are the same. The definition of an agricultural holding used is France is the one described in Regulation (EC) No 1166/2008.  See item 2.5.


2.National survey coverage vs. coverage of the records sent to Eurostat
The population covered in the national survey is the same population as the one covered by the records sent to Eurostat.


3. National vs. EU characteristics

Handbook FSS WG/2015/1/11 revision 1 was used for the farm structure survey.

In FSS 2016, the "mushrooms" variable is measured in terms of production and not in terms of area. A correspondence key has therefore been used to meet the Community requirements. One hectare is considered to produce 270 tons (changes in 2016: for FSS 2013 and FSS 2010: 180 tons of mushrooms per year.)

The farm manager (chef d'exploitation) is defined as the person in charge of day-to-day management. We therefore look at the family of the farm manager and not at that of the holder (exploitant). This divergence does not pose any problems in the case of individual farms, i.e. the majority of farms. In FSS 2016, when considering extrapolated results, only 2 276 farms (0.5 %) were found with a sole holder who is not the manager.

% of arable land in crop rotation: we asked for  <=10 % /  10< - =<50 % / 50 <- <=75 % / > 75 % rather than 0 / 0<-<25 / 25<=-<50 / 50<=-<75 / >=75.

In FSS 2016, an AWU equals to 225 days. Considering that a day equals to 7 hours, an AWU equals to 1575 hours. We asked in 2016 for % AWU and then we constructed percentage bands.


4. Common land
4.1 Current methodology for collecting information on the common land

The concept of common land exists in France. 

Methodology used for collecting information on common land units is the same in FSS 2016 as in FSS 2013 and FSS 2010.

Required information is collected via statistical survey.

Target population: the common land is maintained and managed by special holdings (i.e. common land holdings). They all may file the application for subsidy themselves (less favored area subsidy; called in France ICHN Indemnité Compensatrice de Handicap Naturel, which covers now what was previously called PHAE Prime Herbagère Agroenvironnementale (grass subsidy), which they then divide between the farmers on a pro-rata basis according to their use of the grassland. These units have been registered as agricultural holdings for which areas and labour data have been collected. 
The general questionnaire was used.

The land type of the common land is only permanent grassland and meadow (B_3); with 87 % of rough grazings (B_3_2).

In order to identify common lands in FSS data, it is necessary to select A_2  = 6.
4.2 Possible problems encountered in relation to the collection of information on common land and possible solutions for future FSS surveys
Nothing special to mention.
4.3 Total area of common land in the reference year

Common lands covers 606 847 ha of utilised agricultural area (2.2 % of the total) in 2016.

4.4 Number of agricultural holdings making use of the common land or Number of (especially created) common land holdings in the reference year

In 2016, when considering extrapolated results, there were 1128 farms of common land (0.2 %).


5. Differences across regions within the country
Data collection is more difficult in overseas departements, especially in Guyane.


6. Organic farming. Possible differences between national standards and rules for certification of organic products and the ones set out in Council Regulation No.834/2007
There are no differences. 
8.1.1. Asymmetry for mirror flow statistics - coefficient

[Not requested]

8.2. Comparability - over time
1. Possible changes of the definition of the agricultural holding
As for FSS 2010, the definition of agricultural holding was brought closer to that of agricultural establishment used in SIRENE (the French business register). The identifier in SIRENE is the SIRET number and a decision was made to apply the simple rule that 1 agricultural SIRET = 1 agricultural holding. Before FSS 2010, several SIRET numbers were taken together to form one holding. This rule resulted in an artificial increase in the number of holdings in 2010, but this method didn't change between FSS 2010, FSS 2013 and FSS 2016. 


2. Possible changes in the coverage of holdings for which records are sent to Eurostat

As for FSS 2010, the territories of Saint-Martin, Saint-Barthelemy and Mayotte (in Mayotte, knowledge on farm holdings was significantly incomplete and of low quality, thus it was not possible to draw a stratified sample in this department) are excluded.

In 2016, a restricted territory of Guyane was surveyed compared to 2013 in order to focus to accessible holdings. In 2013, there yet were restrictions compared to FSS 2010 :  it was limited to 3 052 holdings, instead of 5 983 units surveyed by FSS 2010; on professional and more accessible holdings, on the coast side).

GUYANA - FSS scope     
Municipalities included in the survey FSS 2016 sample FSS 2013 sample
  Accessible holdings only Professional and more accessible holdings
APATOU** 55 47
AWALA-YALIMAPO 4 4
CAYENNE 9 1
IRACOUBO 52 20
KOUROU 28 19
MACOURIA 95 61
MANA 152 82
MARIPASOULA* 0 20
MATOURY 31 27
MONTSINERY-TONNEGRANDE 37 22
PAPAICHTON* 0 3
REGINA** 26 19
REMIRE-MONTJOLY 8 2
ROURA 65 35
SAINT-GEORGES* 0 6
SAINT-LAURENT-DU-MARONI 121 95
SINNAMARY 18 20
TOTAL 701 483
     
* municipalities excluded of FSS 2016    

** municipalities partially excluded of FSS 2016 : only parts of these municipalities have been surveyed in 2016.


Impact of changes in Guyana scope :

2010 census results :

         Guyana, total = 5 983 farms

         Guyana, restricted scope as defined for FSS 2013  = 3 052 farms

         Guyana, restricted scope as defined for FSS 2016  = 2 785 farms

2010 census results for Guyana

% in FSS 2016 scope:  
Number of farms 47%
SO 68%
UAA 71%
AWU 47%
LSU 95%

The definition of the threshold used for farms has remained unchanged since 1955.

The only change introduced in 2016 is the removal of the threshold of fruit trees standing alone for production purposes in our manual for surveyors, but it didn't impact our results.


3. Changes of definitions and/or reference time and/or measurements of characteristics
Holder:

During FSS 2010, in France, the farmer (or holder) was called the responsable économique et financier (REF). For FSS 2013, we introduced the word of exploitant, which means "farmer", in order to reconcile our national terminology with European concepts. The REF benefits from the operating profits and suffers any losses, and may be a natural or legal person. This change of terminology allows to be more consistent with European definitions, and has not any impact on the results.

Farm labour:

In FSS 2010, the recording of farm labour, family or otherwise, was identical regardless of the farm status. In FSS2013, for the first time, we adopted Eurostat definition of the family: in the case of farms managed under legal person status (EARL, SCEA, SA, SARL or other person), co-farmers and their families who work on the farm are considered as non-family labour. This change of definitions may have had an impact of the family labour collected in 2013.

In FSS 2016, we asked for % of AWU, instead of AWU band; and we made calculation after data collection in order to have AWU bands. This may have a marginal impact on our result.

Dairy / non-dairy cows:

In FSS 2013, for the first time, in order to increase the use of administrative sources, bovine animals were not collected during the survey but were provided, according to the race of cows, by the national identification database (BDNI), thanks to farmers’ identification numbers (EDE). The eligible bovine animals are the ones detained by the farmer on 1 November 2013.

In FSS 2010, the part of dairy cows in each farm had been asked to the farmer, and this part had been applied to the number of cows known in the BDNI for this farm on 1 November 2010, to determine the number of dairy cows and other cows for every farm.

This method used for FSS 2013 is consistent with the one we are using in the framework of the animal Regulation No 1165/2008.

For FSS 2013, in certain mixed races, used as well for the dairy production as for the production of meat, the breakdown between dairy cows and other ones, based on races in the BDNI, can differ from that operated by the farmer during the survey of 2010.

For 2016, we came back to 2010 way of collection: the part of dairy cows in each farm had been asked to the farmer, and this part had been applied to the number of cows known in the BDNI for this farm on 1 November 2016, to determine the number of dairy cows and other cows for every farm. The number of other bovine animals directly comes from BDNI.

A part of the evolutions observed on the cattle (number of dairy cows and ranking within the farmtype - characteristic A06) is thus connected to the change operated in the mode of collection.

Fresh vegetables:

We tried for FSS 2016 to clarify the distinction between open field and market gardening but it introduced confusions for investigators.

Mushrooms:

One hectare is considered to produce 270 tons in 2016.  For FSS 2013 and FSS 2010: 180 tons of mushrooms per year.


4. Changes over time in the results as compared to previous FSS, which may be attributed to sampling variability
See 6.3.1 for coverage issues for 2016.


5. Common land
5.1 Possible changes in the decision or in the methodology to collect common land
Common land was integrated into FSS survey for the first time in 2010. Until 2010, these areas were considered as being outside the UAA of agricultural holdings. They were identified only by the annual survey on land use.  There are no changes in definition of common land since FSS 2010.
5.2 Change of the total area of common land and of the number of agricultural holdings making use of the common land / number of common land holdings

We observe a decrease of common land in 2016: -11 % of common land units; - 10 % of common land areas,  if we compare to 2013.


FSS 2013

FSS 2016

Common land (ha)

675 128

606 847

Common land units

1 272

1 128


6. Major trends on the main characteristics compared with the previous FSS survey

FSS 2013-2016

Scope: France without overseas departments 

Main characteristic Current FSS survey Previous FSS survey Difference in % Comments
Number of holdings

437 416 

472 207

-7%


Utilised agricultural area (ha)

27 703 018

27 739 432

0%

 
Arable land (ha)

18 190 695

18 466 196

-1%

 
Cereals (ha)*

9 631 087

9 623 200

0%

 
Industrial plants (ha)*

2 408 946

2 434 578

-1% 

 
Plants harvested green (ha)*

4 508 674

4 887 400

-8%

 
Fallow land (ha)

452 389

494 235

-8%


Permanent grassland (ha)

8 565 856

8 242 242

4%

 
Permanent crops (ha)

942 350

1 024 473

-8%

 
Livestock units (LSU)**

21 950 540

21 871 298

0%


Cattle (heads)

18 935 003

18 905 862

0%

 
Sheep (heads)*

6 733 094

7 379 858

- 9 %  
Goats (heads)*

989 926

1 423 334

- 30 %

 
 This decrease is due to the decrease of farms having goats, but may be also in part due to undercoverage issues of our sample.
Pigs (heads)*

13 498 278

13 467 846

0%


Poultry (heads)***

304 776 416

297 077 263

3%


Family labour force (persons)

425 540

491 054

-13%


This decrease is due to the decrease of individual farms in which sole holder is the manager, for which we ask for family labour force.

Family labour force (AWU)

269 602

296 676

-9%


Non family labour force regularly employed (persons)

397 066

416 025

-5%

 
Non family labour force regularly employed (AWU)

328 693

343 805

-4%


8.2.1. Length of comparable time series

[Not requested]

8.3. Coherence - cross domain
1. Coherence at micro level with other data collections

In order to check data collected by FSS 2016, comparisons were made at the questionnaire level with administrative data:

  • with areas declared by farmers for CAP payments (IACS) in 2015, for some crops for which data were available, in order to detect errors (either in crops areas or in administrative numbers).  Differences can be explained by changes between 2015 and 2016.
  • with BDNI data for cows (total: C_2_6 + C_2_99)

These checks were conducted during data collection. It made it possible to detect some errors made by investigators while recording data in CAPI (unit errors, etc...).

We also introduced in the survey data from our orchard census for orchard specific questions (not for FSS).


2. Coherence at macro level with other data collections

After data validation at micro level, provisional results of FSS 2016 (especially main characteristics) were compared with several sources :

  • data from FSS 2010;
  • data from the annual agricultural statistics (AAS).These are drawn up by each statistical service of the regional directorates for agriculture and forestry.Their data relate to the statistics on land use and agricultural production in several fields, at department level: areas, yield, quantities harvested for plants, numbers of workers, weight or average quantities and totals for animal production. Each departmental piece of data is the result of comparing and balancing data from surveys, administrative sources (subsidies, taxation, etc.), and estimations from expers : questions addressed to the Chambers of Agriculture, trade associations, producer groups, etc.

Explanations for discrepancies between FSS and AAS :

- differences between definitions and concepts,

- sources used are not the same : AAS is the results of annual estimations from surveys results + administrative data + expert estimation,

  • data from external sources, mainly the areas declared by farmers in the context of agricultural aid (IACS).

We then applied adjustments to FSS weights (See 3.5 Data compilation).

8.4. Coherence - sub annual and annual statistics

[Not requested]

8.5. Coherence - National Accounts

[Not requested]

8.6. Coherence - internal

[Not requested]


9. Accessibility and clarity Top
9.1. Dissemination format - News release

[Not requested]

9.2. Dissemination format - Publications
1. The nature of publications

First results are available, at the national level, in a publication called "Primeur": 6 pages, text, graphs and tabulations.

More tabulations will be available on our website.

We will only publish FSS results at national level.

However, some regions can publish their own results. 


2. Date of issuing (actual or planned)

National first results, Primeur, 6 pages: June 2018

Tabulations on our website: autumn 2018


3. References for on-line publications

Our PRIMEUR is available here: http://agreste.agriculture.gouv.fr/IMG/pdf/primeur350.pdf

Example of regional publication: Normandie results : http://agreste.agriculture.gouv.fr/IMG/pdf/R2818A09.pdf

All the results will be available on our website: http://www.agreste.agriculture.gouv.fr/ 

9.3. Dissemination format - online database
Dissemination format - online database

Basic tables will be available on the website of the Ministry of Agriculture:
https://stats.agriculture.gouv.fr/disar-web/disaron/!searchurl/searchUiid/search.disar

9.3.1. Data tables - consultations
Data tables - consultations
Not yet available.
9.4. Dissemination format - microdata access
Dissemination format - microdata access

Researchers or institutes can ask for this access. If the request is approved, the data may be accessed only via a safe access centre and the resulting tables are checked for the application of statistical confidentiality.

There is a fee to have an access.

9.5. Dissemination format - other

[Not requested]

9.6. Documentation on methodology
1. Available documentation on methodology

Published information:

See on http://agreste.agriculture.gouv.fr/enquetes/structure-des-exploitations-964/enquete-structure-2016/

Methodological documents:

  • Questionnaire:  see item 3.3;
  • Instructions manual designed for regional staff and investigators, with definitions and explanations about the concepts used in the questionnaire; see the annex;
  • A forum was also daily updated with questions from regional staff, and answers from national FSS team;
  • Methodological letters transmitted to regional staff before and during the survey concerning the questionnaire, data collection, data checks, weight calculation.


2. Main scientific references
Not available.


Annexes:
9.6-1. Instruction guide
9.7. Quality management - documentation
Quality management - documentation

No references on quality. 

9.7.1. Metadata completeness - rate

[Not requested]

9.7.2. Metadata - consultations

[Not requested]


10. Cost and Burden Top
Co-ordination with other surveys: burden on respondents

Co-ordination between surveys:

In order to avoid t

Questionnaire:

A great expertise was conducted before the survey 2013 to simplify FSS questionnaire, in order to focus on collecting data requested by Eurostat.


11. Confidentiality Top
11.1. Confidentiality - policy
Confidentiality - policy

The same Decree specifies that the answers collected come under the Statistical Confidentiality Act (No 51-711 of 7 June 1951) and the "Information Technology and Freedoms" Act (No 78-17 of 6 January 1978). In accordance with the Statistical Confidentiality Act (No 51-711 of 7 June 1951), the data collected are professional, and the interviewers and statisticians are bound by professional secrecy. 

11.2. Confidentiality - data treatment
Confidentiality - data treatment

The data circulates after encryption.
In the tables, data concerning fewer than three units and data where one unit represents more than 85% of the information are replaced by "s". 


12. Comment Top
1. Possible improvements in the future
We will change our sample design in order to strenghten FSS results at an infra-national level (NUTS 2 / NUTS 3 results).


2. Other annexes
Not available.


Related metadata Top


Annexes Top