Reference metadata describe statistical concepts and methodologies used for the collection and generation of data. They provide information on data quality and, since they are strongly content-oriented, assist users in interpreting the data. Reference metadata, unlike structural metadata, can be decoupled from the data.
The data are broken down by economic activity (at section level) in accordance with NACE Rev. 2 - Statistical classification of economic activities in the European Community.
2.3. Coverage - sector
The data cover all the economic activities defined by NACE Rev. 2, except the activities of households as employers and the activities of extraterritorial organisations and bodies.
2.4. Statistical concepts and definitions
A 'job vacancy' is defined as a paid post that is newly created, unoccupied, or about to become vacant:
for which the employer is taking active steps and is prepared to take further steps to find a suitable candidate from outside the enterprise concerned; and
which the employer intends to fill either immediately or within a specific period of time.
‘Active steps to find a suitable candidate’ include:
notifying the job vacancy to the public employment services,
contacting a private employment agency/head hunters,
advertising the vacancy in the media (for example internet, newspapers, magazines),
advertising the vacancy on a public notice board,
approaching, interviewing or selecting possible candidates/potential recruits directly,
approaching employees and/or personal contacts,
using internships.
'Specific period of time’ refers to the maximum time the vacancy is open and intended to be filled. That period shall be unlimited; all vacancies for which active steps are continuing on the reference date shall be reported.
An 'occupied post’ means a paid post within the organisation to which an employee has been assigned.
2.5. Statistical unit
The unit of selection is the enterprise defined according to the communitarian rules for enterprises statistics as: ,,the smallest combination of legal units that is an organisational unit producing goods or services, which benefits from a certain degree of autonomy in decision-making, especially for the allocation of its current resources. An enterprise carries out one or more activities at one or more locations. An enterprise may be a sole legal unit”. The observation unit of the Job Vacancy Survey is the local unit.
2.6. Statistical population
All enterprises.
2.7. Reference area
The whole territory of the country.
2.8. Coverage - Time
The quarterly data are available from 2008.
2.9. Base period
Not applicable.
3.1. Source data
Identification of the source of the data
The sole data source for job vacancies collection is a business survey named Job Vacancy Survey (JVS), which was carried out, since 2005 on quarterly basis, by the National Institute of Statistics (INS).
Coverage
Geographical
All country was covered. Data were representative at NUTS0, NUTS1 and NUTS2 level.
NACE
All NACE sections were covered (except sections T - activities of households as employers and U - activities of extraterritorial organisations and bodies). Date were collected at division level and disseminated at section level (A to S including O, excluding armed forces and assimilated).
Enterprise size
All size classes were included in the sample survey.
Definition of the statistical unit
The statistical unit was the enterprise. According to the communitarian rules was defined as the smallest combination of legal units that is an organisational unit producing goods or services, which benefits from a certain degree of autonomy in decision-making, especially for the allocation of its current resources. An enterprise carries out one or more activities at one or more locations. An enterprise may be a sole legal unit. The local unit was defined as the unit of observation. If the enterprise had local units, which were situated in other counties than the one where headquarters is located and/or carried out a different economic activity than the headquarters, the enterprise reported data for each local unit. If the enterprise had no local units or were in the same county and carried out the same activity as the headquarters, the enterprise did not report data by local units, only by total enterprise.
Remarks
None
Sampling design
Base used for the sample
The sampling frame used for the sample selection was drawn from the Romanian Business Register (REGIS), which contained all enterprises, authorities and organisations as well as their local units that carried out any economic activity irrespective of their size or if they belong to the private or public sector. The Business Register was updated, yearly, on the balance sheets and contains the latest information on each enterprise in the statistical population such as the identification items (unique identification code, address etc.), economic activity codes (NACE Rev.2), number of employees (giving the enterprise size class).
Sampling design
A stratified sampling technique was used as sampling method. The enterprises with 50 employees and more were exhaustively surveyed, irrespective of their economic activity or their location. The sample covered the entire country and also was representative at region level (NUTS 2). The public units from the public administration (O), education (P), human health and social work (Q) activities were exhaustively included in the survey, except local public administration units, for which data at level of local communal councils were collected based on representative sample at level of county (about 770 units). The private units from the education (P), human health and social work (Q) activities were sampled.
Retention/renewal of sampling units
The same sample was used every quarter. If new units, from the exhaustive area, were established, during the year, they were also included in the survey sample.
Sample size
The sample size for 2024 was about 23.300 enterprises.
Stratification
The stratification variables were given by the economic activity (2 digit - division level), the size classes of the enterprise (less than 10 employees, 10-49 employees, 50 employees and over).
Other sources
Maintenance agency
Not applicable
Updating frequency
Not applicable
Rules for clearance (of outdated information)
Not applicable
Voluntary/compulsory reporting and sanctions
Not applicable
Remarks
3.2. Frequency of data collection
Reference dates
The reference period was the last day of the middle month of the quarter
3.3. Data collection
Brief description of the data collection method(s)
Remarks
Self-registration was the method used. The variables were collected on paper questionnaires (posted on the INS website) and transmitted by post or online, web-based application (eSOP online data collection).
If completed on paper, the data were collected until the 19th day of the month following the reference period.
If completed online, the data were collected until around the 25th day of the month following the reference period.
For 2024, the online data collection on job vacancies statistics was about 40% (from the units that provided data).
3.4. Data validation
See information on point 6.3.
3.5. Data compilation
Brief description of the weighting method
Weighting dimensions
The results of the survey were adjusted using the HORVITZ-THOMPSON estimator, weighted with the response probability in order to compensate the non-responses. The treatment of non-response is regarding to the survey status of enterprises and its response.
See the first column
3.6. Adjustment
See information on seasonal adjustment in point 6.4.
4.1. Quality assurance
The quality of the job Vacancy Survey data is guaranteed in accordance with the ESS Code of Practice for each stage of the survey organisation and carrying out.
The questionnaire design, the detailed explanatory notes and the IT solutions developed had as result complete and of good quality data.
4.2. Quality management - assessment
All the standard statistical quality criteria are met (i.e. users’ needs satisfied based on data usefulness and timeliness; various dissemination formats and breakdowns; national and Eurostat dissemination timetable respected).
5.1. Relevance - User Needs
Description of the national users and their main needs
Remarks
The main national users are grouped as following:
governmental bodies: Ministry of Labour, Family, Youth and Social Solidarity, Ministry of Finance, National Agency for Employment;
employers and employers’ associations;
trade unions;
professional associations;
research institutes and universities.
mass-media;
students, doctorates.
Their main needs:
The Job Vacancy Survey outcomes are used by policy makers in establishing the actions and measures for economic development strategies as well as for implementing the programs on active measures for reducing the unemployment.
None
5.2. Relevance - User Satisfaction
Extent to which the needs of national users are satisfied (voluntary)
Remarks
(i) internal users:
In Romania, official statistics is under the responsibility of National Institute for Statistics (INS). In order to ensure the objective and the transparent and scientific character of the methodologies, indicators and classifications used in statistics, the Council of Coordinating the Statistical Activity was set-up.
The Council is composed of representatives of:
Romanian Academy,
specialised higher education system and research,
ministries and other specialised bodies sub-ordinate to the Government,
Romanian National Bank,
trade unions,
employers’ associations,
mass-media,
professional associations.
The representatives of the Council meet quarterly or more frequently when is necessary, in working groups by statistical fields. During these meetings INS receives a strong feed-back from the users in terms of the results already disseminated (including the level of details, breakdowns etc.) and the requests for further needed information to be included in next statistical inquiries.
Before finalising the survey tools and launching the survey on job vacancies INS usually consults its main users and asks for methodological approval given by the “Commission of Methodological Approval”.
The Job Vacancy Survey questionnaire, explanatory notes and the annexes with ISCO classification were submitted for approval when first launched in 2005. Because no major changes occurred, no other methodological approval was needed.
(ii) external users:
European Union and international organisations: the survey tools were designed respecting the recommendations stated in the European Regulations in the filed (see point 2.1).
Foreign research institutes: depending on the request, either data are sent in the available format either are prepared to reach as much as possible their needs;
Foreign employers (investors): most of their requests are satisfied by the available data.
The below publication presents the way in which the statistical data produced and the methodological information of the INS meet the information needs of the various user categories.
Description of missing variables and missing breakdowns of the variables
Report progress on the implementation measures regarding quarterly job vacancies statistics of Regulation (EC) No453/2008, including:
a detailed plan and timetable for completing implementation.
a summary of the remaining deviations from EU concepts.
No variables or breakdowns were missing.
There was no deviation from EU concepts. The regulation was fully implemented into the national survey.
5.3.1. Data completeness - rate
100%.
6.1. Accuracy - overall
See the detailed description in the items below.
6.2. Sampling error
See point 6.2.1.
6.2.1. Sampling error - indicators
Coefficient of variation (taking into account the sampling design) or estimated sampling error for the number of job vacancies (see guidelines).
The sampling unit is the enterprise.The sample of enterprises has been taken according to stratification sampling design (stratification with simple random sampling within strata). The samples within strata have been taken without replacements. Strata were constructed by dividing the sampling frame by the main economic activity coded according to NACE Rev.2 and size class given by the number of employees.
All sections were included (except sections T - activities of households as employers and U - activities of extraterritorial organisations and bodies).
Data were collected at division level and disseminated at section level (A to S including O, excluding armed forces and assimilated). The strata are defined by the cross-classification of NACE categories with 2 size classes (less than 10,10+ employees).
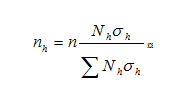
The sample size for each stratum was determined by using the Neyman allocation:
where:
h = index of strata
nh= the number of units in the sample, in the stratum h
n= the number of units in the sample
Nh= the number of units in the sampling frame, in the stratum h
σh= the standard deviation (computed by using the number of employees) in the stratum h
The overall sample of enterprises was designed in a way that leads to representative results for the national economy (NUTS0), macro-regions (NUTS1) and regions (NUTS2).
The sample size was computed under the premise of the estimated error (computed by using the number of employees) equal to 0.02 and a confidence level of 95%.
Description of the calculation of the final weights
The computation of the final weights was performed according to the following steps:
Calculation of a selection weight ( πih ) for each unit. The selection weight is a Horvitz-Thompson weight and is computed as the inverse of the selection probability.
where:
pih = the selection probability of unit i for stratum h
Nh= the number of units in the sampling frame, in the stratum h
nh= the number of units in the sample, in the stratum h
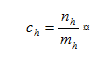
Calculation of a non-response weight ( cih). The non-response weight is computed at each stratum level, as the inverse of the response probability. The purpose of this coefficient is to compensate the non-respondent units, under the assumption that these non-respondent units have the same training patterns compared with the respondent units in the same stratum. Another considered premise is the fact that answering and non-answering is a random variable.
where:
nh= the number of units in the sample, in the stratum h
mh = the number of respondent units selected in the sample, in the stratum h
Calculation of the final weight ( COEFFihext)
COEFFihext= πih . ch
The estimator used for computing the estimated data and the estimated variance is Horvitz-Thomson estimator, as the fraction between the number of units in the sampling frame in the stratum h and the number of respondent units in the sample in the same stratum (Nh/mh).
The estimation is based on the next assumptions:
The response is stochastic and there is a response distribution.
All units within a stratum respond with the same probability.
Outlier detection and treatment:
The procedures referred only to the indicator “job vacancy” and were done after the weighting procedures were applied to the raw data.
The initial checking for all outliers was part of the data validation routine. The procedures applied for the job vacancy outlier examination were mainly based on graph representations of the data by NACE sections, size classes and geographical regions.
When outliers were detected and the reason for it was the unit weight applied, the grossing-up factor for the “number of job vacancies” was made equal with 1. The weight of other observations was increased in a way that the sum of the weights still corresponds with the number of observations in sampling frame.
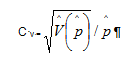
Coefficients of variation:
The formulas used in order to compute the coefficients of variation for the requested indicators are:
Coefficients of variation were computed taking into account the number of job vacancies, at section level (NACE Rev. 2) and broken down by size classes (less than 10 employees, 10 + employees).
The computations of coefficients of variation were produced using PROCSURVEYMEANS, a SAS macro.
See in the Annexes section at the bottom of the page Annex 1 _RO_ Accuracy_2024 - tables no 1,2,3,4
6.3. Non-sampling error
Information on variables with non-negligible measurement and processing errors
Information on main sources of (non-negligible) measurement and processing errors and, if available, on methods applied for correction
Estimation bias: An assessment of the non-sampling errors, in terms of the absolute number of vacant posts, for the total number of job vacancies and, where possible, for aggregation level of NACE Rev. 2 specified in Annex 1 to this Regulation and size classes (1-9, 10 + employees).
Remarks
The IT solution for Romanian Job Vacancy Survey 2024 was developed to find out the measurement and processing errors occurred in different stages of the survey. The application was designed for online data collection and validation.
The IT solution allowed to perform online data entry and validation at unit level. Also, the IT solution allowed to perform data entry and validation for questionnaires received on paper by post/email at county level (42 counties in total – NUTS3 level).
The IT solution contained the following categories of logical tests that check:
the primary data from the questionnaires;
the logical flows among the questionnaire chapters;
the data integrity and correctness;
the data comparability with the previous quarter.
The logical tests have the scope:
to follow and check the logical flows of the questionnaire;
to correlate data from related chapters of the questionnaire;
to define and check certain limits to which the indicators should belong compared to their evolution over time and between them;
to find out the outliers or non-logical values.
The tests for data integrity check the identification information from the sample of units with the information from respondent files.
At central level more accurate and detailed procedures were developed using Visual Fox for checking data integrity and correctness:
data comparison with the previous quarter and the same quarter related to the previous year;
data comparison with other sources (Monthly survey on wages and salaries for the number of occupied posts, Wages survey for month October for the distribution of employees by major groups of occupations);
non-weighted procedures;
adjustment and weighting procedures;
data tabulation;
automatic transformation of final results into the standard format designed by Eurostat;
data transmission to Eurostat.
As concerning the logical test in total 42 logical tests were performed for data checking and correlation on number of occupied posts and job vacancies. Since the same tests were conducted at local level (unit and county) as well as at central level, the largest part of the errors found was solved from the beginning (at local level). The figures were corrected after re-contacting the corresponding enterprises.
The questionnaire design, detailed explanatory notes and the IT solution developed had as result a complete and of good quality data set.
The non-negligible measurement for both collected variables (number of occupied posts and job vacancies) concerns mainly the breakdown by major groups of occupation where discrepancies were noticed from quarter to quarter.
The information below was an estimation of errors at central level, after the data files were received from all over the country. Statistics on the first level of checking (local level) are not available. If the figures correspond to reality due to unusual phenomena, figures were accepted as such and no correction was made.
Most frequent errors that occurred during data checking period:
16.60% of errors coded AT2 and AT26 (in Romanian Logic tests); the number of occupied posts in the current quarter in the enterprise/local unit, does not vary with more than 20 percent compared with the number of occupied posts from the previous quarter, by total and by major groups of occupation;
13.59%of errors coded AT3 and AT19; the number of job vacancies of the enterprise/local unit is less or equal with 20 percent of the number of occupied posts, by total and by major groups of occupation;
12.25%of errors coded AT4 and AT30; the number of job vacancies in the current quarter in the enterprise/local unit, does not vary with more than 20 percent compared with the number of job vacancies from the previous quarter, by total and by major groups of occupation;
7.00% of errors coded AT1 and AT5; units with more than 50 employees and public administration units must have at least one person in major group 1 (management personnel);
5.11%of errors coded AT9 and AT24; the number of employees in major group 9 (elementary occupations) in the enterprise/local unit from public sector cannot be higher than 25% compared to all other groups of occupations.
4.22% of errors coded AT7 and AT20; the number of employees in major group 1 (management personnel) in the enterprise/local unit from public sector cannot be higher than 25% compared to all other groups of occupations.
The number of cases needed to be corrected was not significant to have an impact on the accuracy of the final results.
None
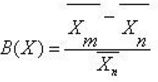
Where the non-response bias and non-response relative bias is negative, then the average number of employees for the respondent units is lower than the average number of employees for all the units in the sample. As seen above, in most of cases, the units with a number of employees below the average respond to a greater extent than the units with a number of employees above the average.See in the Annexes section at the bottom of the page _RO_ Accuracy_2024 - tables no 17,18,19,20.
Relative non-response bias can be estimated by using the following formula:
Where:
n=the number of units selected in the sample;
= The average value of the characteristics of the units selected in the sample;
m = the number of respondent unit selected in the sample;
= the average value of the characteristics of the respondent units selected in the sample.
The characteristics considered for the non-response bias is the number of employees taken from the sampling frame.
6.3.1. Coverage error
Description of any difference between the reference population and the study population
Description of classification errors
Description of any difference between the reference dates and the reference quarter
Any other relevant information
Errors were due to discrepancies between the sampling frame and the target population and sub-populations refer to over-coverage, under-coverage, misclassifications.
In the observed sample there were:
31 out-of-scope units, for the 1st quarter 2024;
31 out-of-scope units, for the 2nd quarter 2024;
38 out-of-scope units for the 3rd quarter 2024;
52 out-of-scope units for 4th quarter 2024.
These units are not counted in response set.
See in the Annexes section at the bottom of the page Annex 1_RO_ Accuracy_2024 (tables no 5, 6, 7, 8)
To perform the adjustments of the over- and under coverage by weighting procedure a model assumption (about the over- and under coverage) was used, applied for each stratum:
The over coverage rate among the respondents is the same as among the non-respondents.
The number of over coverage enterprises in the frame is the same as the number of under coverage enterprises.
The mean value of any variable of interest is the same in the accessible part of the target population as in the under-coverage part.
The measure of misclassification by NACE sections is presented in the Annexes section at the bottom of the page See in the Annexes section at the bottom of the page Annex 1_RO_ Accuracy_2024 (tables no 9, 10, 11, 12).
The reference date is the last day of the middle month of the quarter.
None
6.3.1.1. Over-coverage - rate
The enterprises for which contact was not established (code 3) was 2.51%. In the adjustment procedure the enterprises for which contact was not established were assimilated to the non-response units.
6.3.1.2. Common units - proportion
Not applicable.
6.3.2. Measurement error
See 6.3. Non-sampling error.
6.3.3. Non response error
See in the Annexes section at the bottom of the page Annex 1 _RO_ Accuracy_2024 - tables no 13, 13a.
6.3.3.1. Unit non-response - rate
Unit response rate
The treatment of non-response concerns the survey status of enterprises and its response. The non-response type used to the collection data phase is:
Type of non-response of survey data collection:
Code 2 - Refused to answer
Code 3 - Unidentified enterprise
Code 4 - Outside survey scope
Code 5 - Contact not established
Code 7 - Ceased enterprises
Type of response of survey data collection:
Code 1 - Responded to questionnaire
Code 6 - Dormant enterprises
Code 8 - Answer provided by another unit
Code 9 - Without data because of the events
The estimation method involves multiplying the value for each sampled business (yi) by a combination of weights, one being outlier weight (wih), one resulting from the sample design (aih). An outlier weight is computed as a Windsor weight. The units having the normal score (z score) out of interval [-3, 3] are outlier units. The normal score, which determines the outlier units, is computed taking into account the stratification used in sample design. In order to perform the adjustment of non-response is computed a weight resulting from the sample design, as the sample weight adjusted by the inverse of response probability:
aih = πh . νh
Where:
πh = Nh/nh
νh = nh/mh
Nh = sample frame size of stratum h
nh = sample size of stratum h
mh = number of responses in stratum h
So, for each response unit the final weight is:
weightih = wi . aih = wih . πh . νh
The response rates by NACE Rev.2 sections and size classes are presented in the Annexes section at the bottom of the page Annex 1 _RO_ Accuracy_2024 - tables no 13,14,15,16
6.3.3.2. Item non-response - rate
Items of partial non-response were sent back to the respondent units for filling in the whole information. No item non-response was accepted.
6.3.4. Processing error
See 6.3. Non-sampling error.
6.3.4.1. Imputation - rate
Item imputation rate and methods and, where possible, the effect of imputation on the estimates for the variables transmitted
In order to improve the overall estimations, the imputations where applied from administrative data sources, on the number of occupied posts distributed by major groups of occupations and local units.
The imputation rates represent the percentage of the number of enterprises imputed from administrative sources to the total numberof respondent enterprises by quarters:
8.65% for the 1st quarter 2024;
9.64% for the 2nd quarter 2024;
9.76% for the 3rd quarter 2024;
10.65% for the 4th quarter 2024.
6.3.5. Model assumption error
If modelling is used, include a description of the models used. Particular emphasis should be given to models for imputation or grossing-up to correct for unit non-response.
In Romania, fiscal year fully corresponds to the calendar year. Thus, no adjustment is necessary. Romanian Job Vacancy Survey 2024 covered all enterprises irrespective of their size. According to the Council Regulation no.19/2009 and the Commission Regulation no. 483/2008, Romania provided data for the number of occupied posts and number of job vacancies by:
economic activities (section level),
major groups of occupation (1-digit level, except MG0)
geographical areas (NUTS0, NUTS1 and NUTS2)
for size classes +1 and +10 employees
No administrative data were used for the job vacancies indicator. All data were exclusively obtained from the Job Vacancy Survey.
6.4. Seasonal adjustment
Brief description of seasonal adjustment procedures, in particular with regard to the European Statistical System guidelines on seasonal adjustment which have been endorsed and supported by the SPC.
The adjustment was done by the regression method, in accordance with the legal provisions in the field.
For the adjustment, the DEMETRA software package (the TRAMO/SEATS method) was used, which estimates the effect of the working days differently from one quarter to another and the calendar effect (leap year and other national holidays) and identifies and corrects the outliers (occasional, transitory or permanent changes in level).
The working days adjusted series were obtained by removing such effects from the non- adjusted series by using certain coefficients of correction, set-up according to the regression model used (additive or multiplicative).
The adjustment was done by the direct method. The estimation of the non-observed components: the trend-cycle, the seasonality and the irregular component is done by the SEATS programme on the basis of ARIMA models. The seasonally adjusted series were obtained by removing the seasonal component from the working days adjusted series.
The model is revised on yearly basis and the data for the entire series are recalculated and sent to Eurostat.
The seasonality effects were present in construction, trade, hotels due to the particularities of these specific economic activities.
Seasonal adjustment procedures were performed starting with the first quarter 2008.
Provide a revision history, including the revisions in the published number of job vacancies and a summary of the reasons for the revisions.
No revision was made on the variables collected through JVS.
6.6.1. Data revision - average size
Not the case.
7.1. Timeliness
Detailed description in the following items.
7.1.1. Time lag - first result
Information on the time span between the release of data at national level and the reference period of the data.
All the activities carried out by INS during a year are scheduled through the Activity Plan with several months earlier. Annually, INS issues for the users a press release calendar and a catalogue of statistical products and services containing the names, periodicity, short descriptions and release dates for all publications. The activities for preparing and carrying out of the quarterly Job Vacancy Survey 2024 are described in the Annex 2_RO_Timeliness and punctuality_2024 in the Annexes section at the bottom of the page.
7.1.2. Time lag - final result
Not the case.
7.2. Punctuality
Detailed description in the following items.
7.2.1. Punctuality - delivery and publication
Deadlines for the respondents to reply, also covering recalls and follow-ups
Period of the fieldwork
Period of data processing
Dates of publication of first results
Remarks
The process concerning the deadlines for the respondents to reply was performed as follows:
the units have to fill in the paper questionnaires and send them to the territorial statistical offices until 19th of the last month of the respective quarter.
the units can also fill in the online questionnaires until around 25th of the last month of the respective quarter.
The date in question was referring at the month following the reference period.
The reference periods were: February, May, August and November.
The process concerning the covering recalls and follow-ups was performed as follows:
from 19th till the last day of the month of the quarter, the territorial statistical offices had to perform data entry and data checking. On the last day of the reference quarter the statistical offices had the task of sending the data files to the central level.
In this phase, the covering recalls and follow-ups are taking place. The statisticians from the local offices contact or re contact the units/respondents who did not sent the data, irrespective of their size classes, but the stress was more on the enterprises with more than 50 employees, who are exhaustively surveyed and on those from the public sector. Since not all respondents comply with the deadline requested, a small proportion of questionnaires reach with delay the territorial statistical offices.
The field work was undertaken mainly by the territorial statistical offices and consisted in:
field identification of the sample units;
updating the identification data of the sampled units (i.e. organisational changes, economic activities, addresses etc.);
distribution of survey tools;
methodological assistance for filling in the questionnaires.
Data processing steps and the related periods were:
At local level (regional/county statistical office) the data processing consisted in:
data collection – until 19th of the following month of the reference period;
data entry and validation- from 19th of the following month of the reference period till the last day of the month after the reference period;
At central level (INS) the data processing consisted in:
data validation (errors were detected and sent for correction or explanations to the statistical offices);
comparative analysis with the previous quarter and with other data sources;
the analysis of the non-weighted data;
the weighting procedures;
the analysis of the weighted data;
transposing into the standard format for data transmission designed by Eurostat;
transmission of final results to Eurostat;
quarterly and annually data preparation for dissemination in the press releases, the Monthly Statistical Bulletin, the TEMPO (online) database and the Romanian Statistical Yearbook.
The publication dates for the quarterly and annual JVS2024 results were disseminated in accordance with the legal requirements as follows:
European level (Eurostat): 15 May 2024 – quarter 1; 14 August 2024 - quarter 2; 14 November 2024 - quarter 3; 14 February 2025 - quarter 4.
National level:
Press releases: 21 May2024 – quarter 1; 21 August 2024 – quarter 2; 19 November 2024 – quarter 3; 19 February 2025 – quarter 4; 28 March 2025 – annual data;
TEMPO data base: 24 May 2024 – quarter 1; 24 August 2024 – quarter 2; 22 November 2024 – quarter 3; 24 February 2025 – quarter 4; the annual data in the TEMPO database - 29 March 2024;
Monthly Statistical Bulletin (MSB):26 June 2024 – quarter 1; 26 September 2024 – quarter 2; 30 December 2024 – quarter 3; 27 March 2025 – quarter 4;
Romanian Yearbook – for 2024 annual data– 24 February 2026
The annual data for the number of occupied posts and job vacancies were calculated as simple averages of the quarterly data.
Starting with 2016, the annual averages are to be disseminated only at national level. For Eurostat, as it was concluded at the LAMAS working group (October 2016), Romania will send quarterly data not only by economic activities (section level) broken down by size classes and development regions (NUTS0, NUTS1 and NUTS2), but also by major groups of occupations (1-digit level), also, broken down by size classes and development regions (NUTS0, NUTS1 and NUTS2).
8.1. Comparability - geographical
Information on differences between national and European concepts, and — to the extent possible — their effects on the estimation.
Comparability between national and European concepts on:
Definition of statistical units- There is no deviation from European concepts:
The unit ofselection was the enterprise defined according to the communitarian rules for enterprises statistics as: ,,the smallest combination of legal units that is an organisational unit producing goods or services, which benefits from a certain degree of autonomy in decision-making, especially for the allocation of its current resources. An enterprise carries out one or more activities at one or more locations. An enterprise may be a sole legal unit”. The observation unit of the Job Vacancy Survey was the local unit. If the enterprise had local units, which were situated in other counties than the one where the headquarter is located and/or carried out a different economic activity than the headquarters, the enterprise reported data for each local unit.
If the enterprise had no local units or were in the same county and carried out the same activity as the headquarters, the enterprise did not report data by local units, only by total enterprise.
Populations - There is no deviation from European concepts:
The Romanian Business Register was designed and implemented based on the administrative files (REGIS, which is the Fiscal Register, updated annually) and statistical sources in addition (Trade Register, Balance Sheet files, VAT files, feedback from other surveys, used as consultation data sources for improving the quality of the register data). According to the Council Regulations, REGIS contained the following types of statistical units: legal unit, enterprise, and local unit. All the enterprises having the main activity in the section A to S - NACE Rev.2, whatever their size (number of employees) were covered. The Romanian Business Register contained all enterprises, authorities and organisations as well as their local units in Romania that carried out any economic activity irrespective of their size or if they belong to the private or public sector. There were covered the following institutional sectors:
Non-financial corporate and quasi-corporate enterprises
Central and local administration
Social security institutions and private non-profit institutions serving households
In respect to the budgetary institutions and public administration REGIS was the most complete register in Romania, based on Official Journal and the collaboration with a lot of administration institutions.
Reference times - There is no deviation from European concepts:
The statistics on job vacancies were produced for 2024, with a quarterly periodicity as requested in the European regulations.
Classifications - There is no deviation from European concepts:
The national classification of economic activities is covered by CAEN Rev.2 fully harmonized with NACE Rev.2
The size classes of enterprises correspond to the size classes requested.
Definitions of variables-There is no deviations from European concepts:
The definitions of Job Vacancy Survey 2024 variables were developed and adopted in accordance with European standards (Commission Regulation (EC) no 19/2009 implementing Regulation (EC) No 453/2008 of the European Parliament and of the Council on quarterly statistics on Community job vacancies, as regards the definition of a job vacancy, the reference dates for data collection, data transmission specifications and feasibility studies.
8.1.1. Asymmetry for mirror flow statistics - coefficient
Not applicable.
8.2. Comparability - over time
Information on changes in definitions, coverage and methods in any two consecutive quarters, and their effects on the estimation.
Remarks
The Romanian Job Vacancy Survey has been carrying out quarterly since 2005. The only significant change was in the definition of the job vacancy variable (after the regulation 453/2008 entered into force). The change consisted in the period for which a job was considered vacant – from three months period until 2009 to indefinite period. No estimation was ever used because no significant changes were noticed after the methodological update.
In the context of the COVID-19 pandemic period, the employees in technical unemployed and those who benefited from days off for childcare were exceptionallyincluded, even if on the last day of the reference month they had suspended their employment contract/employment relationship.
The need to include these categories of employees resulted from:
the exceptional nature of their absence from work (suspension of their employment contract/employment relationship, for a limited period of time);
the fact that the employer paid them for the reference period (even if the amounts were partially or fully subsided by the state authorities);
the legal provisions in force, which prohibited the dismissal of these employees, if the unit benefited from subsidies for technical unemployment from the state authorities;
the impossibility of filling the posts occupied by the above mentioned employees, due to the fact that the employer did not have the possibility:
o to declare these occupied posts as vacancies or,
o to initiate the necessary steps in order to hire other employees.
The employees from public institutions/authorities who were in quarantine leave and receive an allowance for the respective leave which was fully borne by the mentioned public bodies were also included.
Additional information to be provided for the FIRST Quality Report
Description of the sources used for the back data and the methodology employed
Concerning the methodology, the changing in the definition of the job vacancy variable explained at chapter 5.2 did not affect the data. The number of job vacancies by economic activities and major occupation groups kept the same trend as before, so no recalculation was necessary.
Description of any differences between the coverage (economic activities, employees, variables) of the back data and that of the current data
The new classification NACE Rev.2 was implemented since Q2 2008. For the reference quarters 2nd to 4th 2008, the Romanian JVS was conducted in double coding (NACE Rev.1 and NACE Rev.2). Data for the 1stquarter 2008 was estimated using conversion matrices based on the results of the other quarters.
Starting with 2011 the new International Standard Classification of Occupations (ISCO-08) was used.
Description of the comparability of the back data and the current data
Data are comparable over time.
Remarks
In relation to the situation caused by the COVID-19 pandemic, the data may present a lower degree of reliability, accuracy, completeness and comparability, as a result of the difficulties arising from the application of economic and social measures, determined by the declaration of state emergency throughout Romania. These difficulties were mainly determined by heavy access to the financial and accounting documents, caused frequently by the sudden closure of certain economic and social units, by not completing in due time of the respective documents, by relaxation of legal deadlines for submitting tax documents to the related institutions, by temporarily suspending the activity for a significant number of economic and social units or even by ceasing their activity, in some cases.
8.2.1. Length of comparable time series
The time series are comparable since the survey was launched (2005).
8.3. Coherence - cross domain
Comparisons of data on the number of vacant jobs from other relevant sources when available, in total and broken down by NACE at section level when relevant, and reasons if the values differ considerably.
No other data source was available for comparative analysis on the number of job vacancies by total or broken down by NACE at section level Within Eurostat grants for 2009 Theme: 1.02 - Title: "Labour Market", Actions: 1) Labour Force Survey – 2010 ad hoc module on reconciliation between work and family life; 2) Job Vacancy statistics, an alternative administrative source was tried to be used with the scope of burden reduction on enterprises with less than 10 employees. But due to the difficulties occurred and non-coherence between the two data sources, the administrative source was dropped and was decided that the JVS will still be further used as the sole data source for collecting vacancies irrespective of the size classes. For further information on the project please see the final report sent to Eurostat on 27 September 2010.
In 2012, the Romanian National Institute of Statistics contracted an Eurostat Grant (Theme: 1.02 - "Labour Market", Title: Job Vacancy Statistics) with a duration of 18 months (September 2012-February 2014) having as objectives the following:
for the small business units (less than ten employees) improving the quality of the job vacancies statistics and reduce the burden on responding units by using the data from administrative sources.
for all size classes - improving the quality of the job vacancies statistics broken down by occupations using the data from administrative sources.
At the end of May 2013, an Interim Report was sent to Eurostat in which are detailed the steps taken so far.
Beveridge Curve (2010Q4 -2024Q4):
No particular comment.
Comparison between the number employees (LFS) and Number of occupied posts (JVS) (section B-S, year 2024):
The main differences between the two indicators are due to the fact that the number employees collected from LFS covers armed forces and also the informal sector.
Also, in LFS, the information is based on the respondent's own statement, so there might be discrepancies concerning the economic activity declared by the respondent (LFS) and the enterprise economic activity (JVS). For example, section N (Administrative and support service activities) includes among others „employment activities” (division 78). Thus, in the enterprise surveys (JVS), the respective economic units will report the employees on this particular activity, meanwhile in the household surveys (LFS), the respondents will declare their actual workplace.
As for section S (Other service activities), the discrepancies could be determined by the fact that the coverage from the two survey is different. JVS includes only employees who are working in enterprises and not for other types of employers, such as: political organizations, foundations/ NGOs, owners’ associations, parental associations, individual households or other authorized persons, categories which are covered by the LFS.
Concerning the number of occupied posts collected though the JVS, the indicator does not include the persons whose employment contract is suspended for a certain period of time (maternity leave, child care leave, sickness leave, unpaid leave, other absences) and the posts which are temporarily suspended but that may become vacant and occupied for a limited period time.
Also, if an employee has more than one job, it is counted only once, at the enterprise where the main job is. The other jobs are not counted in order to avoid double/multiple counting of the same person.
Not requested by the CR (EC) No 1062/2008 implementing Regulation (EC) No 453/2008 of the European Parliament and of the Council on quarterly statistics on Community job vacancies, as regards seasonal adjustment procedures and quality reports.
8.5. Coherence - National Accounts
See point 8.4.
8.6. Coherence - internal
See point 8.4.
9.1. Dissemination format - News release
The Job Vacancies Survey 2024 data are disseminated through a press release, containing the survey main results and methodological explanations.
The press release is available on INS web-site (both in Romanian and English) for all interested users: Press releases
9.2. Dissemination format - Publications
Dissemination scheme, including to whom the results are sent
Periodicity of national publication
References for publications of core results, including those with commentary in the form of text, graphs, maps, etc.
Information on what results, if any, are sent to reporting units included in the sample
The results of the Job Vacancy Survey were published in theMonthly Statistical Bulletin(quarterly data) and Statistical Yearbook and (annual data), which are available in printed form, on CD-ROM and online (Press releases), both in Romanian and English language.
Also, the results are disseminated throughout:
synthesis publications such as: Social Trends, Regional economic and social benchmarks and Romania in Figures, see this website
other online data base (i.e. Sustainable Development Indicators – broken down at territorial level (NUTS1 and NUTS2), see this website.
At European level the data are sent only to Eurostat.
Data were disseminated as follows:
quarterlyin
the Press releases after 50 days of the reference quarter;
the TEMPO (online) database, after 55 days of the reference quarter and
the Monthly Statistical Bulletin after 84 days of the reference quarter;
yearlyin
the Press releases and TEMPO (online) database, after 90 days of the reference year;
the Romanian Statistical Yearbook according to national dissemination schedule.
The survey results were also commented in the above mentioned publications in form of text, graphs, tables.
No information resulting from the survey was sent to the reporting units included in the sample.
9.3. Dissemination format - online database
The national online database (TEMPO), available on INS website, both in Romanian and English language, contains data on job vacancies and job vacancies rates.
Metadata and methodological notes are included in all Job Vacancy Survey releases (press release, publication, ad hoc data requests).
Also, methodological notes are available online TEMPO data base: TEMPO database
9.7. Quality management - documentation
Description of and references for metadata provided
References for core methodological documents relating to the statistics provided
Description of main actions carried out by the national statistical services to inform users about the data
Remarks
The Job Vacancy Survey data were disseminated together with comprehensive and clear metadata, irrespective of the release form or user category. It contains:
description of the survey (scope, coverage, periodicity, sample size, non-response rate),
definitions of the indicators,
results tables on the indicators:
number of job vacancies,
job vacancies rate,
by economic activities (section level), size classes of the enterprises (1+employees and 10 employees (Eurostat), +1 employees (national level), macro-regions and regions of economic development (NUTS1 and NUTS2).
From 2016 onwards, quarterly, data are sent to Eurostat also by major groups of occupations. Furthermore, the data are broken down, as follows:
economic activities - alongside the above mentioned breakdowns, the development regions were added (NUTS0, NUTS1, NUTS2);
major groups of occupation broken down by size classes and development regions (NUTS0, NUTS1, NUTS2).
The press release contained the main results of the survey (number of job vacancies and job vacancy rate) and comparative analysis by economic activities, by major occupational groups and over time (previous quarter and the same quarter of the previous year). Also, methodological explanations were available. The tables in the Monthly Statistical Bulletin and the Statistical Yearbook were accompanied by methodological notes describing the data sources, the concepts and definitions of the indicators presented. The databases contained metadata on the released indicators, data sources, survey coverage, periodicity, sample size.
The users were informed by the INS on the publications that are to be issued over the year, through the “Catalogue of statistical products and services”, which was available on printed form, but also online (INSSE website). The catalogue contained the INS yearly publications, periodicals, quick information, electronic publications, publication in stock and statistical services.
Disclosure rules: Brief description of when data have to be deleted for reasons of confidentiality
For 2024, the quarterly data for certain economic activities/major groups of occupations were flagged due to small number of cases observed. Starting with 2016, the quarterly data are sent to Eurostat not only by economic activities - section level, broken down by total economy and size classes - but also for development regions (NUTS1 and NUTS2 level).
The same breakdowns are applied to the major groups of occupations (NUTS0, NUTS1, NUTS2 and size classes).
A 'job vacancy' is defined as a paid post that is newly created, unoccupied, or about to become vacant:
for which the employer is taking active steps and is prepared to take further steps to find a suitable candidate from outside the enterprise concerned; and
which the employer intends to fill either immediately or within a specific period of time.
‘Active steps to find a suitable candidate’ include:
notifying the job vacancy to the public employment services,
contacting a private employment agency/head hunters,
advertising the vacancy in the media (for example internet, newspapers, magazines),
advertising the vacancy on a public notice board,
approaching, interviewing or selecting possible candidates/potential recruits directly,
approaching employees and/or personal contacts,
using internships.
'Specific period of time’ refers to the maximum time the vacancy is open and intended to be filled. That period shall be unlimited; all vacancies for which active steps are continuing on the reference date shall be reported.
An 'occupied post’ means a paid post within the organisation to which an employee has been assigned.
The unit of selection is the enterprise defined according to the communitarian rules for enterprises statistics as: ,,the smallest combination of legal units that is an organisational unit producing goods or services, which benefits from a certain degree of autonomy in decision-making, especially for the allocation of its current resources. An enterprise carries out one or more activities at one or more locations. An enterprise may be a sole legal unit”. The observation unit of the Job Vacancy Survey is the local unit.
All enterprises.
The whole territory of the country.
Not Applicable
See the detailed description in the items below.
Not Applicable
Brief description of the weighting method
Weighting dimensions
The results of the survey were adjusted using the HORVITZ-THOMPSON estimator, weighted with the response probability in order to compensate the non-responses. The treatment of non-response is regarding to the survey status of enterprises and its response.
See the first column
Identification of the source of the data
The sole data source for job vacancies collection is a business survey named Job Vacancy Survey (JVS), which was carried out, since 2005 on quarterly basis, by the National Institute of Statistics (INS).
Coverage
Geographical
All country was covered. Data were representative at NUTS0, NUTS1 and NUTS2 level.
NACE
All NACE sections were covered (except sections T - activities of households as employers and U - activities of extraterritorial organisations and bodies). Date were collected at division level and disseminated at section level (A to S including O, excluding armed forces and assimilated).
Enterprise size
All size classes were included in the sample survey.
Definition of the statistical unit
The statistical unit was the enterprise. According to the communitarian rules was defined as the smallest combination of legal units that is an organisational unit producing goods or services, which benefits from a certain degree of autonomy in decision-making, especially for the allocation of its current resources. An enterprise carries out one or more activities at one or more locations. An enterprise may be a sole legal unit. The local unit was defined as the unit of observation. If the enterprise had local units, which were situated in other counties than the one where headquarters is located and/or carried out a different economic activity than the headquarters, the enterprise reported data for each local unit. If the enterprise had no local units or were in the same county and carried out the same activity as the headquarters, the enterprise did not report data by local units, only by total enterprise.
Remarks
None
Sampling design
Base used for the sample
The sampling frame used for the sample selection was drawn from the Romanian Business Register (REGIS), which contained all enterprises, authorities and organisations as well as their local units that carried out any economic activity irrespective of their size or if they belong to the private or public sector. The Business Register was updated, yearly, on the balance sheets and contains the latest information on each enterprise in the statistical population such as the identification items (unique identification code, address etc.), economic activity codes (NACE Rev.2), number of employees (giving the enterprise size class).
Sampling design
A stratified sampling technique was used as sampling method. The enterprises with 50 employees and more were exhaustively surveyed, irrespective of their economic activity or their location. The sample covered the entire country and also was representative at region level (NUTS 2). The public units from the public administration (O), education (P), human health and social work (Q) activities were exhaustively included in the survey, except local public administration units, for which data at level of local communal councils were collected based on representative sample at level of county (about 770 units). The private units from the education (P), human health and social work (Q) activities were sampled.
Retention/renewal of sampling units
The same sample was used every quarter. If new units, from the exhaustive area, were established, during the year, they were also included in the survey sample.
Sample size
The sample size for 2024 was about 23.300 enterprises.
Stratification
The stratification variables were given by the economic activity (2 digit - division level), the size classes of the enterprise (less than 10 employees, 10-49 employees, 50 employees and over).
Other sources
Maintenance agency
Not applicable
Updating frequency
Not applicable
Rules for clearance (of outdated information)
Not applicable
Voluntary/compulsory reporting and sanctions
Not applicable
Remarks
Not Applicable
Detailed description in the following items.
Information on differences between national and European concepts, and — to the extent possible — their effects on the estimation.
Comparability between national and European concepts on:
Definition of statistical units- There is no deviation from European concepts:
The unit ofselection was the enterprise defined according to the communitarian rules for enterprises statistics as: ,,the smallest combination of legal units that is an organisational unit producing goods or services, which benefits from a certain degree of autonomy in decision-making, especially for the allocation of its current resources. An enterprise carries out one or more activities at one or more locations. An enterprise may be a sole legal unit”. The observation unit of the Job Vacancy Survey was the local unit. If the enterprise had local units, which were situated in other counties than the one where the headquarter is located and/or carried out a different economic activity than the headquarters, the enterprise reported data for each local unit.
If the enterprise had no local units or were in the same county and carried out the same activity as the headquarters, the enterprise did not report data by local units, only by total enterprise.
Populations - There is no deviation from European concepts:
The Romanian Business Register was designed and implemented based on the administrative files (REGIS, which is the Fiscal Register, updated annually) and statistical sources in addition (Trade Register, Balance Sheet files, VAT files, feedback from other surveys, used as consultation data sources for improving the quality of the register data). According to the Council Regulations, REGIS contained the following types of statistical units: legal unit, enterprise, and local unit. All the enterprises having the main activity in the section A to S - NACE Rev.2, whatever their size (number of employees) were covered. The Romanian Business Register contained all enterprises, authorities and organisations as well as their local units in Romania that carried out any economic activity irrespective of their size or if they belong to the private or public sector. There were covered the following institutional sectors:
Non-financial corporate and quasi-corporate enterprises
Central and local administration
Social security institutions and private non-profit institutions serving households
In respect to the budgetary institutions and public administration REGIS was the most complete register in Romania, based on Official Journal and the collaboration with a lot of administration institutions.
Reference times - There is no deviation from European concepts:
The statistics on job vacancies were produced for 2024, with a quarterly periodicity as requested in the European regulations.
Classifications - There is no deviation from European concepts:
The national classification of economic activities is covered by CAEN Rev.2 fully harmonized with NACE Rev.2
The size classes of enterprises correspond to the size classes requested.
Definitions of variables-There is no deviations from European concepts:
The definitions of Job Vacancy Survey 2024 variables were developed and adopted in accordance with European standards (Commission Regulation (EC) no 19/2009 implementing Regulation (EC) No 453/2008 of the European Parliament and of the Council on quarterly statistics on Community job vacancies, as regards the definition of a job vacancy, the reference dates for data collection, data transmission specifications and feasibility studies.
Information on changes in definitions, coverage and methods in any two consecutive quarters, and their effects on the estimation.
Remarks
The Romanian Job Vacancy Survey has been carrying out quarterly since 2005. The only significant change was in the definition of the job vacancy variable (after the regulation 453/2008 entered into force). The change consisted in the period for which a job was considered vacant – from three months period until 2009 to indefinite period. No estimation was ever used because no significant changes were noticed after the methodological update.
In the context of the COVID-19 pandemic period, the employees in technical unemployed and those who benefited from days off for childcare were exceptionallyincluded, even if on the last day of the reference month they had suspended their employment contract/employment relationship.
The need to include these categories of employees resulted from:
the exceptional nature of their absence from work (suspension of their employment contract/employment relationship, for a limited period of time);
the fact that the employer paid them for the reference period (even if the amounts were partially or fully subsided by the state authorities);
the legal provisions in force, which prohibited the dismissal of these employees, if the unit benefited from subsidies for technical unemployment from the state authorities;
the impossibility of filling the posts occupied by the above mentioned employees, due to the fact that the employer did not have the possibility:
o to declare these occupied posts as vacancies or,
o to initiate the necessary steps in order to hire other employees.
The employees from public institutions/authorities who were in quarantine leave and receive an allowance for the respective leave which was fully borne by the mentioned public bodies were also included.
Additional information to be provided for the FIRST Quality Report
Description of the sources used for the back data and the methodology employed
Concerning the methodology, the changing in the definition of the job vacancy variable explained at chapter 5.2 did not affect the data. The number of job vacancies by economic activities and major occupation groups kept the same trend as before, so no recalculation was necessary.
Description of any differences between the coverage (economic activities, employees, variables) of the back data and that of the current data
The new classification NACE Rev.2 was implemented since Q2 2008. For the reference quarters 2nd to 4th 2008, the Romanian JVS was conducted in double coding (NACE Rev.1 and NACE Rev.2). Data for the 1stquarter 2008 was estimated using conversion matrices based on the results of the other quarters.
Starting with 2011 the new International Standard Classification of Occupations (ISCO-08) was used.
Description of the comparability of the back data and the current data
Data are comparable over time.
Remarks
In relation to the situation caused by the COVID-19 pandemic, the data may present a lower degree of reliability, accuracy, completeness and comparability, as a result of the difficulties arising from the application of economic and social measures, determined by the declaration of state emergency throughout Romania. These difficulties were mainly determined by heavy access to the financial and accounting documents, caused frequently by the sudden closure of certain economic and social units, by not completing in due time of the respective documents, by relaxation of legal deadlines for submitting tax documents to the related institutions, by temporarily suspending the activity for a significant number of economic and social units or even by ceasing their activity, in some cases.


 = The average value of the characteristics of the units selected in the sample;
 = the average value of the characteristics of the respondent units selected in the sample.