Reference metadata describe statistical concepts and methodologies used for the collection and generation of data. They provide information on data quality and, since they are strongly content-oriented, assist users in interpreting the data. Reference metadata, unlike structural metadata, can be decoupled from the data.
The quarterly data are broken down by economic activity (at section level) in accordance with NACE Rev. 2 and from 2017 Q2 by NUTS2 and ISCO too.
2.3. Coverage - sector
All economic activities defined by NACE Rev. 2, except the activities of households as employers and the activities of extraterritorial organisations and bodies.
2.4. Statistical concepts and definitions
A 'job vacancy' is defined as a paid post that is newly created, unoccupied, or about to become vacant:
for which the employer is taking active steps and is prepared to take further steps to find a suitable candidate from outside the enterprise concerned; and
which the employer intends to fill either immediately or within a specific period of time (in Hungary within 3 months).
‘Active steps to find a suitable candidate’ include:
notifying the job vacancy to the public employment services,
contacting a private employment agency/head hunters,
advertising the vacancy in the media (for example internet, newspapers, magazines),
advertising the vacancy on a public notice board,
approaching, interviewing or selecting possible candidates/potential recruits directly,
approaching employees and/or personal contacts,
using internships.
'Specific period of time’ refers to the maximum time the vacancy is open and intended to be filled. That period shall be unlimited (in Hungary this period is limited to 3 months); all vacancies for which active steps are continuing on the reference date shall be reported.
An 'occupied post’ means a paid post within the organisation to which an employee has been assigned (at the end of the quarter).
2.5. Statistical unit
Legal unit and budgetary organisations central and local in an aggregated form.
2.6. Statistical population
The Hungarian Business register's frame covers the statistical population.
For all sectors registered and operating in Hungary, enterprises with five and more persons employed, all sectors in the central and local budgetary in an aggregated form and non-profit organisations.
2.7. Reference area
The whole country.
2.8. Coverage - Time
Job vacancy data are comparable for all sections according to the NACE Rev 2. classification are available since 2008 (some aggregates from 2006 onwards).
Occupied jobs data are limited comparable since 2008, there is a break between 2018 and 2019 data.
2.9. Base period
Not applicable
3.1. Source data
Identification of the source of the data
job vacancies: Quarterly Labour Report (from 2019)
occupied posts: Social Security Reports (from 2019)
Coverage
Geographical
The whole territory of the country
NACE
NACE 2.1 A-S
Enterprise size
Enterprises with five or more persons employed.
Definition of the statistical unit
Legal unit
Remarks
The Quarterly Labour Report was introduced in 2019 replacing the previous Monthly Labour Report and the quarterly job vacancy statistics report.
As of 2019 the number of occupied jobs, however, is based on adminitsrative data, the Social Seciruty Report of the National Tax and Customs Administration.
Sampling design
Base used for the sample
Business Register (BR)
Sampling design
The Quarterly Labour Report (QLR) was introduced in 2019 replacing the previous Monthly Labour Report and the quarterly job vacancy statistics report.
The reference population of the previous vacancy statistics was somewhat extended, the sample size grew a bit larger (the sample size reached that of the previous monthly labour survey).
The quarterly labour survey serves as the major source of vacancy as well as earnings statistics.
The job vacancy data of the Quarterly Labour Report covers all enterprises with more than 49 persons employed and enterprises with employees between 5 and 49 persons on a representative basis. The budgetary organizations are observed on a full-scope basis and certain non-profit institutions (in sectors E, P, Q) employed persons from 3 people, otherwise over 49 people take part all in the survey. All establishments are classified in NACE Rev.2.1 A to S. Sampling frame is based on the Business Register.
The sample is selected using stratified random sampling. Sample coordination is used at the HCSO, so the selection of different surveys are coordinated, as well as the consecutive yearly samples of the QLR survey (i.e. sample rotation is applied). Approximately the 2/3 of the previous year’s sample remains in the sample, and the other 1/3 is replaced by population units that were not in the previous year’s sample.
In order to improve the quality of the QLR, the method of sampling was modified: in addition to the sales revenue, gross earnings were also take into account for determining the sample size of the strata. The number of organisations in the sample decreased in the size class 5-9 employees while increased in the size class 20-49 employees.
Retention/renewal of sampling units
Every year
Sample size
reference population enterprises with 5-49 employees: 81791 (2024) from this the sample size: 9325
Stratification
The survey is based on stratified probability sampling. The criteria for stratification are the following:
economic activity [in construction (two-digit level divisions 41–43) within the three-digit level group 42.1 the various four-digit level classes, otherwise the various groups; within divisions 45, 46, 47 and 56 groups 45.1, 46.9, 47.3 and 56.1, respectively, moreover, the other groups; within divisions 10, 18, 25, 31, 49, 52 and 85 classes 10.71, 18.12, 25.11, 31.09, 49.41, 52.29 and 85.59, respectively, furthermore the other classes],
size (categories: 20–49, 10–19 and 5–9 persons employed),
place of the headquarter (categories: Budapest and the countryside).
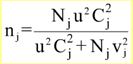
The total samples sizes are determined by taking into account both accuracy demands and cost limitation. Grossing up by simple inflation, the sample sizes for the various strata are determined by
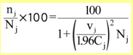
where Nj is the population size of the stratum, u = 1.96 is the standard normal percentile belonging to the level of confidence 0.95, Cj is the coefficient of variation calculated from data of previous surveys and vj is the relative margin of error (the radius of the relative confidence interval) which we would like not to exceed. Then the percentage sampling rate is given by the formula
The values of vj are determined in such a way that the sample scheme should correspond to a modified Neyman allocation.
The Neyman allocation is based on the variance of the sales revenue and on the gross earnings, both variables are taken from administrative data sources.
Data of those non-respondents of which – on the basis of information on the cause of non-response – we suppose that they would have sent us a questionnaire with only zero values are imputed by zero. Data of the other non-respondents are imputed by the mean value of the amalgamated Budapest–countryside stratum. Though the variables under consideration do not have very high variance between enterprises, we pay attention to outliers. In order to compare enterprises of different strata, we standardize the variables and modify them according to the (sampling) size of the stratum. (This modification is necessary because the fewer the data the higher is the probability of higher value.) Enterprises with modified value larger than a threshold are considered to be outliers. (The threshold values for the various variables are determined on the basis of mathematical and experimental considerations.) Outliers are not included in the gross up procedure, they are handled separately.
In the course of the processing indicators are estimated by strata for the sampled enterprises and the enterprises enumerated completely. In case of the non-specific characteristics (occupied jobs, and job vacancies), the population total is estimated directly from the elementary data. Within the various sampled strata the sampling weight
is determined, and the monthly (last month of the quarter) population total Yj is estimated by the Horwitz-Thompson estimator with equal selection probabilities:
where yj is the sample total in the jth stratum.
The totals estimated in the above way are broken down first among the four-digit level economic activity classes, then among the counties of the countryside.
A brief description of the data collection method(s)
Remarks
The Quarterly Labour Survey Report was introduced in 2019 replacing the previous Monthly Labour Repor and the quarterly job vacancy statistics survey. The quarterly labour survey serves as the major source of vacancy as well as earnings statistics.. The deadline of the quarterly data collection is 12 days after the end of the reference period. The data collection takes place electronically from 1st of January 2013. The electronic data sending is obligatory for every data supplier. From this date the enterprises are able to send their questionnaire back only via a special interface called ELEKTRA. During the next 15 days after the arrival data are audited by the staff of the department Business Statistics Data Collection. (In 2020 Q1 we postponed the deadline of the data collection with 10 days, due to the corona pandemic.)
Budgetary organisations have been obliged to use a standardized system for payroll (KIRA) from 2001 onwards and almost every public institution has launched this system. Information concerning job vacancies and occupied posts were provided within the framework of this system. The deadline for the central and local budgetary sending data to HCSO is 20 days after the end of the reference period.
From 2019 the source of occupied posts for enterprises and non-profit institutions is an administrative source: Social Security Reports provided by the National Tax and Customs Administration. We get data 35 days after the reference quarter. From these data we calculate the occupied posts for the last day of the reference quarter.
Data collection method:Electronic 100%
Budgetary organisations have been obliged to use a standardized system for payroll (KIRA) from 2001 onwards and almost every public institution has launched this system. Information concerning job vacancies and occupied posts were provided within the framework of this system. The deadline for the central and local budgetary sending data to HCSO is 20 days after the end of the reference period.
-
3.4. Data validation
HCSO has been improving the questionnaire and the guidance of JVS. Using the results of this work a wide range of logic tests have been introduced and used in the Quarterly Labour Report. Hopefully the extensive list of logic tests used has revealed all errors of magnitude made by respondents. All questionnaires were approved. Re-contacts were made by the field-workers if it was necessary. The data were tested during data entry by the data provider in Elektra and by collecting data collectors, and also at macro level. Statistics concerning the number of corrections / by the data provider/ have not been made, so there aren't any data for measuring processing errors.
3.5. Data compilation
Brief description of the weighting method
Weighting dimensions
In the Quarterly Labour Report the JV data of those non-respondents of which – on the basis of information on the cause of non-response – we suppose that they would have sent us a questionnaire with only zero values are imputed with zero. Data of the other non-respondents are imputed by the mean value of the amalgamated Budapest–countryside stratum.
Though the variables under consideration do not have very high variance between enterprises, we pay attention to outliers. In order to compare enterprises of different strata, we standardize the variables and modify them according to the (sampling) size of the stratum. (This modification is necessary because the fewer the data, the higher is the probability of higher value.) Enterprises with modified value larger than a threshold are considered to be outliers. (The threshold values for the various variables are determined on the basis of mathematical and experimental considerations.) Outliers are not included in the gross up procedure, they are handled separately.
In the course of the processing, indicators are estimated for the sampled enterprises and the enterprises enumerated completely. In case of the non-specific characteristics (occupied jobs, and job vacancies), the population total is estimated directly from the elementary data.
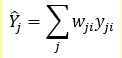
The sampling weights are calculated using calibration technique. The auxiliary variables are taken from the Social Security Reports. After getting the calibrated weight for each sampling unit, the population totals for the j-th stratum is estimated by the following formula:
where wji and yji are the calibrated weight and the value of the given variable for the ith unit. The population total is simply the sum of the stratum totals.
The totals estimated in the above way are broken down first among the four-digit level economic activity classes, then among the counties of the countryside.
The occupied posts come from the Social Security Report as of 2019, which is an administrative source, so there is no need for weighting method.
See in the brief description
3.6. Adjustment
See point 6.4 on seasonal adjustment.
4.1. Quality assurance
Quality assurance is a continuous work, all HCSO's surveys have to use general rules of HCSO's Quality Assurance Policy.
4.2. Quality management - assessment
The HCSO introduced a comprehensive quality management system based on Total Quality Management. In this sense, quality management is a job that continuously triggers improvement processes. Apart from the quality of the products and services, the focus is also on customer and user satisfaction, active involvement of the staff, long-term business success and societal benefit. So all areas of the HCSO that are relevant for quality are included. Improvements are systematically implemented (i.e. planned and checked through measurement) in all.
5.1. Relevance - User Needs
Description of the national users and their main needs
Remarks
The table contains the most important characteristics of the main users of JVS data.
Name of the user
Adaptation of needs
Origin of needs
Satisfaction of needs
Ministries
They are taking part in the official statistical service, their representatives are members of the National Statistical Council (NSC). They propose collected information, i.e. contents of the questionnaire or comment on the draft questionnaire.
Information on unmet labour demand for policy-making and strategy of development in different fields of economy
Generally satisfied with publications and special analysis
National Bank
Either they have representatives in the National Statistical Council (NSC) or they can apply to the NSC.
Information on unmet labour demand for business cycle analysis and for short-term and medium term forecasting, evaluation of the performance of the economy and measurement of competition.
Generally satisfied with publications. Special data are available according to agreement.
Hungarian Academy of Science, research institutes, universities, students
They can apply to the NSC, taking part in meeting on design and development of the surveys and the estimation process as specialists.
Research purposes for different analysis, forecasting and methodological analysis.
Generally satisfied with publications and individual data compiled on request.
Media
They can apply to the HCSO.
Information based on objective data.
Generally satisfied with information provided.
EUROSTAT
Council and Commission Regulations, working groups, task forces on JVS.
Needs of European users, ECB, transferred by Eurostat, international comparisons, data for investors and for employees.
JVS data are transmitted, deadlines kept.
5.2. Relevance - User Satisfaction
Extent to which the needs of national users are satisfied (voluntary)
Remarks
So far, no survey was carried out on user’s satisfaction concerning JVS data. It is assumed that our users are generally satisfied and the statistical information meets the real needs of clients.
See 5.1. Relevance - User Needs.
5.3. Completeness
Description of missing variables and missing breakdowns of the variables
Report progress on the implementation measures regarding quarterly job vacancies statistics of Regulation (EC) No 453/2008, including
a detailed plan and timetable for completing implementation
a summary of the remaining deviations from EU concepts
The situation of the implementation of Regulation (EC) No. 453/2008 of the European Parliament and of the Council concerning job vacancies is good.
- Definitions are fully harmonized
- Scope is also fully implemented taking account of NACE sections (sections B to S of NACE Rev 2.); however data of small enterprises (the ones with less than 5 employees) are missing. In order to reduce the reporting burden of small establishments, we are working on the process to be able to give estimates based on admin data.
- Breakdown of variables is mostly fully implemented.
Not available.
5.3.1. Data completeness - rate
Not applicable.
6.1. Accuracy - overall
The overall accuracy to ascertain , i.e. the various components to summarize into one single measure, is difficult. Even if it comes to a single dataset.
6.2. Sampling error
Sampling errors are calculated concerning Job Vacancies (occupied posts come from administrative data as of 2019).
The Quarterly Labour Report was introduced in 2019 replacing the previous Monthly Labour Report and the quarterly job vacancy statistics report.
The reference population of the previuos vacancy statistics was somewhat extended, the sample size grew a bit larger (the sample size reached that of the previous monthly labour survey).
The Quarterly Labour Report was carried out partly through a sample. The target population for the sampling survey included the active enterprises with 5–49 employees. The sampling frame for the survey and the number of enterprises were provided by the Business Register (BR) of HCSO. Observational and at the same time sampling units were the enterprises of the BR belonging to the appropriate NACE sections and size groups, and having a so-called obligatory data-supplier status (indicating that the enterprise is active). The data collection covered those units which had been selected from the sampling frame. Data of those non-respondents were imputed by zero, which – on the basis of information on the reason for non-response – were supposed to have sent us a questionnaire with only zero values. Data of the other non-respondents are imputed by the mean value of the amalgamated Budapest–countryside stratum.
6.2.1. Sampling error - indicators
Coefficient of variation (taking into account the sampling design) or estimated sampling error for the number of job vacancies (see guidelines).
For the sampled part of the population, in case of the various variables, the individual variances were calculated for the given breakdowns (NACE and size categories) according to the Taylor linearization method. The coefficient of variation for these breakdowns and for the whole population was calculated as the quotient of the standard error (the square root of the variance) and the estimated
Information on variables with non-negligible measurement and processing errors
Information on main sources of (non-negligible) measurement and processing errors and, if available, on methods applied for correction
Estimation bias: An assessment of the non-sampling errors, in terms of the absolute number of vacant posts, for the total number of job vacancies and, where possible, for aggregation level of NACE Rev. 2 specified in Annex 1 to this Regulation and size classes (1-9, 10 + employees).
Remarks
Aside from the sampling error associated with the process of selecting a sample, a survey is subject to a wide variety of errors. These errors are commonly referred to as "non-sampling errors". Non-sampling errors can be defined as errors arising during the course of all survey activities other than sampling.
Non-sampling errors can occur because of problems in coverage, response, non-response, data processing, estimation etc.
Not available
6.3.1. Coverage error
Description of any difference between the reference population and the study population
Description of classification errors
Description of any difference between the reference dates and the reference quarter
Any other relevant information
The Business Register (BR) which is the source of the sampling frame has direct online connection with the Registry Court. Therefore when the sample is constructed the sampling frame is timely. The sample and the full-scope part of the survey are updated every year. Over the given year the sample is permanent apart from the ceased enterprises which are deleted, but the full-scope part of the survey is updated every quarter.
Under-coverage can arise if an enterprise that is element of the full-scope part starts to work after the updating. In this case this data supplier goes into the data set next quarter.
Multiple listings is not known because all of the enterprises are identified by a unique number.
Not available
Not available
6.3.1.1. Over-coverage - rate
The proportion of units accessible via the frame that do not belong to the target population, i.e. A good value about the rate of over-coverage can be calculated on the basis of Business Register. The rate of other errors (for example classification error) is noted over the data collection, and the statistician can list these cases and can determine the number of that. The over-coverage could be measured. We assume - on the basis of information coming from other institutional surveys concerning labour market - , that over-coverage rate is very low.
6.3.1.2. Common units - proportion
Multiple listings is not known because all of the enterprises are identified by a unique number.
6.3.2. Measurement error
Electronic questionnaire includes built in checking algorithm and the data-supplier get warnings in case of a mistake. Further validity and coherence checks are applied, both at regional and central level, and in case of serious problems contacts, respondents get a feedback, to correct the errors detected.
6.3.3. Non response error
The difference between the statistics computed from the collected data and those that would be computed if there were no missing values, i.e. non response error is calculated concerning JVS.
6.3.3.1. Unit non-response - rate
Unit response rate
Overall unit non-response rate
- in 2024 (as annual average) - 7,1%
6.3.3.2. Item non-response - rate
Item non-response was not allowed, because of the nature of the questionnaire (compulsory). Field-workers tried to get all information if an enterprise refused to give answers to the whole questionnaire.
6.3.4. Processing error
Not applicable
6.3.4.1. Imputation - rate
Item imputation rate and methods and, where possible, the effect of imputation on the estimates for the variables transmitted
Vacancy data are not imputed.
The occupied posts come from an administrative source as of 2019. If the data of the enterprise are missing from the last month of the reference quarter we impute the missing data with the data of the middle month of the reference quarter. If there are no data for the middle month, we do not impute.
6.3.5. Model assumption error
If modelling is used, include a description of the models used. Particular emphasis should be given to models for imputation or grossing-up to correct for unit non-response.
No modelling is used.
6.4. Seasonal adjustment
Brief description of seasonal adjustment procedures, in particular with regard to the European Statistical System guidelines on seasonal adjustment which have been endorsed and supported by the SPC.
In 2014 we have started with quarterly seasonal adjustment procedure for job vacances by software Demetra 2.04 using Tramo-Seats method. First seasonal adjustment was made only for job vacancies. From Q1 2015 onwards seasonal adjustment is made also for occupied posts. From 2017 we use Demetra 2.2.0
Direct adjustment is used.
Data are revised every quarter, i.e. 4 times in a year.
There is a general revisions policy frame of HCSO, which is supplemented by a revision calendar. The revision calendar provides an overview of which sets of statistics are subject to revision and describes the respective revisions cycle by means of a standardised structure giving exact dates. The outline of the revisions cycle is to answer the following questions: When are provisional, revised provisional and final results published? What is the cycle for methodological revisions? Why are revisions made and for what period are data recalculated?
Taking into account the various causes of revisions and the different frequencies, the HCSO distinguishes for JVS the following types of revisions:
Routine revisions
Methodological revisions
Unscheduled revisions
6.6. Data revision - practice
Provide a revision history, including the revisions in the published number of job vacancies and a summary of the reasons for the revisions.
Data are revised once a year in June following the reference year, and thereafter preliminary data become final.
6.6.1. Data revision - average size
Average size of data revision is not calculated.
7.1. Timeliness
For the job vacancies the deadline of returning the questionnaires is 12 days after the end of the reference quarter. For the occpupied posts we get the database from administratice source 35 days after the end of the month.
One and a half months after the end of the reference period (quarter) the data are being processed and tested further at micro and macro level.
First results are released 70-75 days after the end of the reference quarter in STADAT
Short analyses on JVS are published in the Labour Market Trends.
The results are transmitted to the Eurostat.
7.1.1. Time lag - first result
Information on the time span between the release of data at national level and the reference period of the data.
First data on quarterly and yearly JVS statistics are published in STADAT-system according to the Release Calendar of HCSO. Deadlines are always kept.
Time span between the end of the reference period and the release of first results (preliminary data) is ususally 70-75 days.
2024Q1: t + 2,5 months
2024Q2: t + 2,5months
2024Q3: t + 2,5 months
2024Q4: t + 2,5 months
7.1.2. Time lag - final result
Not applicable
7.2. Punctuality
See below.
7.2.1. Punctuality - delivery and publication
Deadlines for the respondents to reply, also covering recalls and follow-ups
Period of the fieldwork
Period of data processing
Dates of publication of first results
Remarks
12th day after the reference quarter; recalls during the following three weeks
From the 12th to the 30th day after reference quarter.
Central level from the 31st to the 60th day after the end of the reference quarter
70-75 days after the end of the reference quarter
-
8.1. Comparability - geographical
Information on differences between national and European concepts, and — to the extent possible — their effects on the estimation.
Hungarian JVS data are less comparable because of the coverage of only enterprises with 5 or more employees.
The national definition of a job vacancy is slightly different from the European one. The national definition is as follows:
Job vacancy is a paid post that is newly created, unoccupied, or about to become vacant.
for which the employer is taking active steps and is prepared to take further steps to find a suitable candidate from outside the enterprise concerned;
which the employer intends to fill either immediately or within a specific period of time of 3 months.
The period of time is unlimited in the case of the European definition.
8.1.1. Asymmetry for mirror flow statistics - coefficient
Not applicable.
8.2. Comparability - over time
Information on changes in definitions, coverage and methods in any two consecutive quarters, and their effects on the estimation.
Remarks
The source of job vacancies and occuped post are different as of 2019.
The change of the source of job vacancies has no effect to the data. The change of the source of occupied posts caused breake in the timeline.
The definition of occupied posts changed in 2006. Data of occupied posts excluded employees working less than 60 hours per month until 2006. That group means 2% of the total.
The definition of job vacancies also changed in 2006. "Job vacancy shall mean a paid post that is newly created, unoccupied, or about to become vacant immediately or within 4 weeks until 2006 and within 3 months from 2006 onwards".
8.2.1. Length of comparable time series
Job vacancies: 2006.
Occupied posts: 2019.
8.3. Coherence - cross domain
Comparisons of data on the number of vacant jobs from other relevant sources when available, in total and broken down by NACE at section level when relevant, and reasons if the values differ considerably.
The comparison between the JVS occupied posts and the LFS number of employees together with the Beveridge curve are in the annexes below.
No on-line databases in which the disseminated JVS data can be accessed.
9.3.1. Data tables - consultations
Not applicable
9.4. Dissemination format - microdata access
Microdata are limited avaible.
9.5. Dissemination format - other
Not applicable
9.6. Documentation on methodology
Not applicable
9.7. Quality management - documentation
Description of and references for metadata provided
References for core methodological documents relating to the statistics provided
Description of main actions carried out by the national statistical services to inform users about the data
Remarks
For the better understanding of data HCSO publishes the documentation of many different statistical domains. It comprises the definitions of concepts, the data sources used in a statistical domain, the methods applied, data quality aspects, the most frequently used classifications and other metadata. The documentation available.
Metadata and documentations are permanently updated in accordance with changes.
9.7.1. Metadata completeness - rate
Not applicable
9.7.2. Metadata - consultations
Number of consultations for 2018 within Labour market domain concerning JVS aren't calculated.
Cost associated with the collection and production of a statistical product is unknown. The Quarterly Labour Report was introduced in 2019 replacing the previous Monthly Labour Report and the Quarterly job vacancy statitstic report.
The Quarterly Labour Report from 2019 contains earnings, wages and worked hours data, too, so the burden on respondents is not comparable to the previous year.
Burden on respondents for the whole Quarterly Labour Report : 38 min
A 'job vacancy' is defined as a paid post that is newly created, unoccupied, or about to become vacant:
for which the employer is taking active steps and is prepared to take further steps to find a suitable candidate from outside the enterprise concerned; and
which the employer intends to fill either immediately or within a specific period of time (in Hungary within 3 months).
‘Active steps to find a suitable candidate’ include:
notifying the job vacancy to the public employment services,
contacting a private employment agency/head hunters,
advertising the vacancy in the media (for example internet, newspapers, magazines),
advertising the vacancy on a public notice board,
approaching, interviewing or selecting possible candidates/potential recruits directly,
approaching employees and/or personal contacts,
using internships.
'Specific period of time’ refers to the maximum time the vacancy is open and intended to be filled. That period shall be unlimited (in Hungary this period is limited to 3 months); all vacancies for which active steps are continuing on the reference date shall be reported.
An 'occupied post’ means a paid post within the organisation to which an employee has been assigned (at the end of the quarter).
Legal unit and budgetary organisations central and local in an aggregated form.
The Hungarian Business register's frame covers the statistical population.
For all sectors registered and operating in Hungary, enterprises with five and more persons employed, all sectors in the central and local budgetary in an aggregated form and non-profit organisations.
The whole country.
Not Applicable
The overall accuracy to ascertain , i.e. the various components to summarize into one single measure, is difficult. Even if it comes to a single dataset.
Not Applicable
Brief description of the weighting method
Weighting dimensions
In the Quarterly Labour Report the JV data of those non-respondents of which – on the basis of information on the cause of non-response – we suppose that they would have sent us a questionnaire with only zero values are imputed with zero. Data of the other non-respondents are imputed by the mean value of the amalgamated Budapest–countryside stratum.
Though the variables under consideration do not have very high variance between enterprises, we pay attention to outliers. In order to compare enterprises of different strata, we standardize the variables and modify them according to the (sampling) size of the stratum. (This modification is necessary because the fewer the data, the higher is the probability of higher value.) Enterprises with modified value larger than a threshold are considered to be outliers. (The threshold values for the various variables are determined on the basis of mathematical and experimental considerations.) Outliers are not included in the gross up procedure, they are handled separately.
In the course of the processing, indicators are estimated for the sampled enterprises and the enterprises enumerated completely. In case of the non-specific characteristics (occupied jobs, and job vacancies), the population total is estimated directly from the elementary data.
The sampling weights are calculated using calibration technique. The auxiliary variables are taken from the Social Security Reports. After getting the calibrated weight for each sampling unit, the population totals for the j-th stratum is estimated by the following formula:
where wji and yji are the calibrated weight and the value of the given variable for the ith unit. The population total is simply the sum of the stratum totals.
The totals estimated in the above way are broken down first among the four-digit level economic activity classes, then among the counties of the countryside.
The occupied posts come from the Social Security Report as of 2019, which is an administrative source, so there is no need for weighting method.
See in the brief description
Identification of the source of the data
job vacancies: Quarterly Labour Report (from 2019)
occupied posts: Social Security Reports (from 2019)
Coverage
Geographical
The whole territory of the country
NACE
NACE 2.1 A-S
Enterprise size
Enterprises with five or more persons employed.
Definition of the statistical unit
Legal unit
Remarks
The Quarterly Labour Report was introduced in 2019 replacing the previous Monthly Labour Report and the quarterly job vacancy statistics report.
As of 2019 the number of occupied jobs, however, is based on adminitsrative data, the Social Seciruty Report of the National Tax and Customs Administration.
Sampling design
Base used for the sample
Business Register (BR)
Sampling design
The Quarterly Labour Report (QLR) was introduced in 2019 replacing the previous Monthly Labour Report and the quarterly job vacancy statistics report.
The reference population of the previous vacancy statistics was somewhat extended, the sample size grew a bit larger (the sample size reached that of the previous monthly labour survey).
The quarterly labour survey serves as the major source of vacancy as well as earnings statistics.
The job vacancy data of the Quarterly Labour Report covers all enterprises with more than 49 persons employed and enterprises with employees between 5 and 49 persons on a representative basis. The budgetary organizations are observed on a full-scope basis and certain non-profit institutions (in sectors E, P, Q) employed persons from 3 people, otherwise over 49 people take part all in the survey. All establishments are classified in NACE Rev.2.1 A to S. Sampling frame is based on the Business Register.
The sample is selected using stratified random sampling. Sample coordination is used at the HCSO, so the selection of different surveys are coordinated, as well as the consecutive yearly samples of the QLR survey (i.e. sample rotation is applied). Approximately the 2/3 of the previous year’s sample remains in the sample, and the other 1/3 is replaced by population units that were not in the previous year’s sample.
In order to improve the quality of the QLR, the method of sampling was modified: in addition to the sales revenue, gross earnings were also take into account for determining the sample size of the strata. The number of organisations in the sample decreased in the size class 5-9 employees while increased in the size class 20-49 employees.
Retention/renewal of sampling units
Every year
Sample size
reference population enterprises with 5-49 employees: 81791 (2024) from this the sample size: 9325
Stratification
The survey is based on stratified probability sampling. The criteria for stratification are the following:
economic activity [in construction (two-digit level divisions 41–43) within the three-digit level group 42.1 the various four-digit level classes, otherwise the various groups; within divisions 45, 46, 47 and 56 groups 45.1, 46.9, 47.3 and 56.1, respectively, moreover, the other groups; within divisions 10, 18, 25, 31, 49, 52 and 85 classes 10.71, 18.12, 25.11, 31.09, 49.41, 52.29 and 85.59, respectively, furthermore the other classes],
size (categories: 20–49, 10–19 and 5–9 persons employed),
place of the headquarter (categories: Budapest and the countryside).
The total samples sizes are determined by taking into account both accuracy demands and cost limitation. Grossing up by simple inflation, the sample sizes for the various strata are determined by
where Nj is the population size of the stratum, u = 1.96 is the standard normal percentile belonging to the level of confidence 0.95, Cj is the coefficient of variation calculated from data of previous surveys and vj is the relative margin of error (the radius of the relative confidence interval) which we would like not to exceed. Then the percentage sampling rate is given by the formula
The values of vj are determined in such a way that the sample scheme should correspond to a modified Neyman allocation.
The Neyman allocation is based on the variance of the sales revenue and on the gross earnings, both variables are taken from administrative data sources.
Data of those non-respondents of which – on the basis of information on the cause of non-response – we suppose that they would have sent us a questionnaire with only zero values are imputed by zero. Data of the other non-respondents are imputed by the mean value of the amalgamated Budapest–countryside stratum. Though the variables under consideration do not have very high variance between enterprises, we pay attention to outliers. In order to compare enterprises of different strata, we standardize the variables and modify them according to the (sampling) size of the stratum. (This modification is necessary because the fewer the data the higher is the probability of higher value.) Enterprises with modified value larger than a threshold are considered to be outliers. (The threshold values for the various variables are determined on the basis of mathematical and experimental considerations.) Outliers are not included in the gross up procedure, they are handled separately.
In the course of the processing indicators are estimated by strata for the sampled enterprises and the enterprises enumerated completely. In case of the non-specific characteristics (occupied jobs, and job vacancies), the population total is estimated directly from the elementary data. Within the various sampled strata the sampling weight
is determined, and the monthly (last month of the quarter) population total Yj is estimated by the Horwitz-Thompson estimator with equal selection probabilities:
where yj is the sample total in the jth stratum.
The totals estimated in the above way are broken down first among the four-digit level economic activity classes, then among the counties of the countryside.
For the job vacancies the deadline of returning the questionnaires is 12 days after the end of the reference quarter. For the occpupied posts we get the database from administratice source 35 days after the end of the month.
One and a half months after the end of the reference period (quarter) the data are being processed and tested further at micro and macro level.
First results are released 70-75 days after the end of the reference quarter in STADAT
Short analyses on JVS are published in the Labour Market Trends.
The results are transmitted to the Eurostat.
Information on differences between national and European concepts, and — to the extent possible — their effects on the estimation.
Hungarian JVS data are less comparable because of the coverage of only enterprises with 5 or more employees.
The national definition of a job vacancy is slightly different from the European one. The national definition is as follows:
Job vacancy is a paid post that is newly created, unoccupied, or about to become vacant.
for which the employer is taking active steps and is prepared to take further steps to find a suitable candidate from outside the enterprise concerned;
which the employer intends to fill either immediately or within a specific period of time of 3 months.
The period of time is unlimited in the case of the European definition.
Information on changes in definitions, coverage and methods in any two consecutive quarters, and their effects on the estimation.
Remarks
The source of job vacancies and occuped post are different as of 2019.
The change of the source of job vacancies has no effect to the data. The change of the source of occupied posts caused breake in the timeline.
The definition of occupied posts changed in 2006. Data of occupied posts excluded employees working less than 60 hours per month until 2006. That group means 2% of the total.
The definition of job vacancies also changed in 2006. "Job vacancy shall mean a paid post that is newly created, unoccupied, or about to become vacant immediately or within 4 weeks until 2006 and within 3 months from 2006 onwards".


 were calculated for the given breakdowns (NACE and size categories) according to the Taylor linearization method. The coefficient of variation for these breakdowns and for the whole population was calculated as the quotient of the standard error (the square root of the variance) and the estimated
  and
and 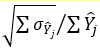 respectively.