Reference metadata describe statistical concepts and methodologies used for the collection and generation of data. They provide information on data quality and, since they are strongly content-oriented, assist users in interpreting the data. Reference metadata, unlike structural metadata, can be decoupled from the data.
Labour market and information society statistics unit
1.3. Contact name
Confidential because of GDPR
1.4. Contact person function
Confidential because of GDPR
1.5. Contact mail address
1.6. Contact email address
Confidential because of GDPR
1.7. Contact phone number
Confidential because of GDPR
1.8. Contact fax number
Confidential because of GDPR
2.1. Metadata last certified
17 March 2026
2.2. Metadata last posted
17 March 2026
2.3. Metadata last update
17 March 2026
3.1. Data description
Data on the Information and Communication Technologies (ICT) usage and e-commerce in enterprises are survey data. They are collected by the National Statistical Institutes or Ministries and are in principle based on Eurostat's annual model questionnaires on ICT usage and e-commerce in enterprises.
The legal basis for ICT enterprise statistics for survey year 2025 is Commission Implementing Regulation (EU) 2024/1883 of 9 July 2024 laying down the technical specifications of data requirements for the topic 'ICT usage and e-commerce' for the reference year 2025. Large part of the data collected is used to support measuring the implementation and monitoring of the EU’s digital targets for 2030, set by the Digital Decade Policy Programme.
Four of the key performance indicators (KPIs) of the current programme stem from the statistics for which the implementing and delegated acts are enclosed for adoption: Artificial Intelligence, cloud, data analytics and the digital intensity index (DII) - a composite indicator reflecting the digital transformation of business
The aim of the European survey on ICT usage and e-commerce in enterprises is to collect and disseminate harmonised and comparable information at European level.
All economic activities in the scope of Annex of the Commission Regulation are intended to be included in the general survey, covering enterprises with 10 or more employees and self-employed persons. These activities are:
Section C - “Manufacturing”
Section D, E - “Electricity, gas, steam and air conditioning supply”, “Water supply, sewerage, waste management and remediation activities”
Section F - “Construction”
Section G - “Wholesale and retail trade; repair of motor vehicles and motorcycles”
Section H - “Transportation and storage”
Section I - “Accommodation and food service activities”
Section J - “Information and communication”
Section L - “Real estate activities”
Section M - “Professional, scientific and technical activities”
Section N - "Administrative and support service activities"
Group 95.1 - “Repair of computers and communication equipment”.
For micro-enterprises see the sub-concepts in the full metadata view.
3.3.1. Coverage-sector economic activity for micro-enterprises - All NACE Rev. 2 categories are covered
No
3.3.2. Coverage sector economic activity for micro-enterprises - If not all activities were covered, which ones were covered?
Microenterprises (1 to 9) are not surveyed
3.4. Statistical concepts and definitions
The model questionnaire on ICT usage and e-commerce in enterprises provides a large variety of variables covering among others the following topics:
Access and use of the Internet
E-commerce
Data utilisation and analytics
Use of cloud computing services
Artificial intelligence
ICT and the environment.
The annual model questionnaires and the European businesses statistics compliers’ manual for ICT usage and e-commerce in enterprises comprise definitions and explanations regarding the topics of the survey.
The Enterprise concept was used in this survey and is defined as: ‘The smallest combination of legal units, that is an organisational unit producing goods or services, which benefits from a certain degree of autonomy in decision-making, especially for the allocation of its current resources. An enterprise carries out one or more activities at one or more locations. An enterprise may be a sole legal unit.’
3.6. Statistical population
Target Population
As required by Annex of the Commission Implementing Regulation, enterprises with 10 or more employees and self-employed persons are covered by the survey.
For micro-enterprises see the sub-concepts below.
3.6.1. Coverage of micro-enterprises
No
3.6.2. Breakdown between size classes [0 to 1] and [2 to 9]
No
3.6.3. If for micro-enterprises different size delimitation was used, please indicate it.
Micro enterprises not covered
3.7. Reference area
Detailed information on the provision of data on NUTS 2 regional level is available in “Annex I. Completeness“.
The survey had total geographical coverage of the Maltese Islands (NUTS 2 level)
3.8. Coverage - Time
Years 2024 and 2025.
3.9. Base period
Not applicable
Percentages of enterprises, Percentages of turnover, Percentages of employees and self-employed persons, Million euro (for selected indicators in some countries).
Where not specified the reference period is current situation (survey period in 2025). Year 2024 for the employment, turnover, value or % of sales data and where specified.
6.1. Institutional Mandate - legal acts and other agreements
Complementary national legislation constituting the legal basis for the survey on the use of ICT in enterprises: Malta Statistics Authority Act
The NSO gives access to micro data related to households and individuals, however no micro data about business units is shared.
7.1. Confidentiality - policy
Regulation (EC) No 223/2009 on European statistics (recital 24 and Article 20(4)) of 11 March 2009 (OJ L 87, p. 164), stipulates the need to establish common principles and guidelines ensuring the confidentiality of data used for the production of European statistics and the access to those confidential data with due account for technical developments and the requirements of users in a democratic society.
At national level:
Confidentiality is one of the major principles guiding the activities of the NSO.
Article 40 of the MSA Act stipulates the restrictions on the use of information and in Article 41, the prohibition of disclosure of information. Furthermore, Section IX of the Act (Offences and Penalties) lays down the measures to be taken in case of unlawful exercise of any officer of statistics regarding confidentiality of data. No cases of breaches in the law have been recorded to date.
Since its inception, the NSO has always operated within a culture of strict confidentiality to which it is also bound by the provisions of the Data Protection Act. This Act, which came fully into effect on July 15, 2003, seeks to protect individuals against the violation of their privacy by the processing of personal data.
Further information on access to microdata is available on the NSO's website through: Access to Microdata.
During 2009, the NSO has set up a Statistical Disclosure Committee to ensure that statistical confidentiality is observed, especially when requests for microdata are received by the NSO.
Upon employment, NSO employees are informed of the rules and duties pertaining to confidential information and its treatment. According to the MSA Act, before commencing work, every employee is required to take an oath of secrecy whose text is included in the Act.
At European level: Regulation (EC) No 223/2009 on European statistics (recital 24 and Article 20(4) of 11 March 2009 (OJ L 87, p. 164), stipulates the need to establish common principles and guidelines ensuring the confidentiality of data used for the production of European statistics and the access to those confidential data with due account for technical developments and the requirements of users in a democratic society.
7.2. Confidentiality - data treatment
Data are transmitted via eDamis (encrypted) and delivered to a secure environment where they are treated. Flags are added for confidentiality in case results must not be disclosed.
At national level:
Microdata is not made available outside NSO, even in anonymised form. In addition, strata based on less than 3 readings are not published.
8.1. Release calendar
The NSO has a news release calendar and this is available on the website on the advance release calendar. There is no fixed date for the 2025 ICT ENT data publication.
The NSO publishes around 230 News Releases a year. All releases are published and disseminated at 1100 hrs as scheduled in the Advance Release Calendar. The calendar is published on the NSO website and includes a three-month advance notice (the current month and the forthcoming two months). It should be noted that the calendar is subject to changes.
News releases are scheduled in such a way so as to have only one release per working day. In exceptional cases, more than one release my be published on one particular day.
Annual
10.1. Dissemination format - News release
ICT ENT results for 2025 have not been published nationally and a release date still needs to be identified.
10.2. Dissemination format - Publications
No Publications for the ICT in enterprises survey are foreseen.
10.3. Dissemination format - online database
See detailed section 10.3.1.
10.3.1. Data tables - consultations
Results for selected variables collected in the framework of this survey are available for all participating countries on Digital economy and society of Eurostat website.
At national level:
No databases are available at national level, but selected variables (including yearly ad-hoc and main indicators) are published in the news release referred to in point 10.1
10.4. Dissemination format - microdata access
The National Statistics Office provides access to microdata related to indivduals and households. The following is the link with the details: microdata access guidelines
10.5. Dissemination format - other
Not requested
10.5.1. Metadata - consultations
Not requested
10.6. Documentation on methodology
The European businesses statistics compilers’ manual for ICT usage and e-commerce in enterprises provides guidelines and clarifications for the implementation of the surveys.
The European businesses statistics compliers’ manual for ICT usage and e-commerce in enterprises provides guidelines and standards for the implementation of the surveys. It is updated every year according to the changed contents of the model questionnaires.
All key variables are checked with their respective timeseries in order to assure consistency over time. Other variables, such as turnover are compared with other internal sources. One is to point out that enterprises are being asked to provide information on turnover well before the figure for this variable is finalised. As a result, this information may be subject to revisions.
11.2. Quality management - assessment
At European level, the recommended use of the annual Eurostat model questionnaire aims at improving comparability of the results among the countries that conduct the survey on ICT usage and e-commerce in enterprises. Moreover, the European businesses statistics compilers’ manual for ICT usage and e-commerce in enterprises provides guidelines and clarifications for the implementation of the surveys.
At national level:
All enterprises fulfilling the defined NACE and size criteria are selected. This population is extracted from the Business Register which is held and maintained by NSO. Sources used to update the Business Register include the Job Vacancies Survey and the Short Term Business Statistics.
12.1. Relevance - User Needs
European level :
At European level, European Commission users (e.g. DG CNECT, DG GROW, DG JUST, DG REGIO, DG JRC) are the principal users of the data on ICT usage and e-commerce in enterprises and contribute in identifying/defining the topics to be covered. Hence, main users are consulted regularly (at hearings, task forces, ad hoc meetings) for their needs and are involved in the process of the development of the model questionnaires at a very early stage.
User needs are considered throughout the whole discussion process of the model questionnaires aiming at providing relevant statistical data for monitoring and benchmarking of European policies.
National level :
The main users of the data on ICT usage and e-commerce in enterprises are:
International organizations (such as UNESCO, OECD and EU);
Public Entities (such as ministries, authorities);
ICT Enterprises statistics are mainly used for Policy making, market research, dissertations and business making.
12.2. Relevance - User Satisfaction
European level :
At European level, contacts within the Commission, the OECD and other stakeholders give a clear picture about the key users' satisfaction as to the following data quality aspects: accuracy and reliability of results, timeliness, satisfactory accessibility, clarity and comparability over time and between countries, completeness and relevance. Overall users have evaluated positively (good, very good) the data quality on the ICT usage and e-commerce in enterprises.
National level :
A user satisfaction survey was carried out by the NSO to measure the degree with which obligations towards its users are met. The survey was last held in 2014, and results for the total statistical output for the Education and Information Society Statistics Unit, not specifically for ICT statistics, were as follows:
News Releases:
Quality – 62.9 % high/good;
Timeliness – 77 % timely;
Usefulness – 80.3 % useful.
Requested data:
Quality – 54.8 % high/good;
Frequency – 5.4 % regular;
Timeliness –73.1 % timely.
A dedicated news release outlines main results from this survey, and can be accessed through: NSO website.
12.3. Completeness
Detailed information is available in “ Annex I. Completeness “ - related to questionnaire, coverage, additional questions, regional data.
12.3.1. Data completeness - rate
Not requested
13.1. Accuracy - overall
Comments on reliability and representativeness of results and completeness of dataset
These comments reflect overall standard errors reported for the indicators and breakdowns in section 13.2.1 (Sampling error - indicators) and the rest of the breakdowns for national and European aggregates, as well as other accuracy measurements. The estimated standard error should not exceed 2pp for the overall proportions and should not exceed 5pp for the proportions related to the different subgroups of the population (for those NACE aggregates for the calculation and dissemination of national aggregates). If problems were found, these could have implications for future surveys (e.g. need to improve sampling design, to increase sample sizes, to increase the response rates).
Detailed information is available in “ Annex II. Accuracy “ - related to European aggregates, comments on reliability and use of flag.
13.2. Sampling error
For calculation of the standard error see concept 13.2.1.1.
13.2.1. Sampling error - indicators
Standard error (for selected indicators and breakdowns)
Precision measures related to variability due to sampling, unit non-response (the size of the subset of respondents is smaller than the size of the original sample) and other (imputation for item non-response, calibration etc.) are not (yet) required from the Member States for all indicators.
Detailed information is available in“ Annex III. Sample and standard error tables 2025 “ – worksheets starting with “Standard error".
13.2.1.1. Sampling error indicator calculation
Calculation of the standard error
Various methods can be used for the calculation of the standard error for an estimated proportion. The aim is to incorporate into the standard error the sampling variability but also variability due to unit non-response, item non-response (imputation), calibration etc. In case of census / take-all strata, the aim is to calculate the standard errors comprising the variability due to unit non-response and item non-response.
Name and brief description of the applied estimation approach:
The standard error is calculated assuming simple random sampling within strata. Mathematical equations were used for the computation of standard error for linear estimates.
Basic formula:
BREAKDOWN flagging of Nominal Variables (i.e. with ‘ENT’ unit)
All breakdowns with population or net sample of 3 counts or less are flagged as ‘c’.
The following confidentiality criteria were also applied by our Methodo0logy and Research unit using the TAUARGUS software.
Manual safety range: 30%
Minimum frequency count: 3
Dominance rule: n=2, k=80% meaning that 2 companies make up 80% or more of the sector.
All breakdowns with population of 20 counts or less not achieving full response within strata are marked as ‘u’ throughout all the data set.
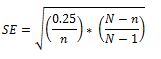
Other breakdowns that have a margin of error exceeding 30% where marked as ‘u’ based on 95% confidence interval and the equation below.
A proportion of 0.5 is being assumed in this equation. This equation also assumes simple random sampling within the strata.
BREAKDOWN flagging of Scale Variables (i.e. with ‘Mio EUR’ or ‘EMP’ unit)
Break downs and variables (having ‘Mio EUR’ or ‘EMP’ units) with margin of error exceeding 30% are marked as ‘u’ throughout all the data set.
Margin of error was based on 95% confidence interval using the equation below.
All of the breakdowns notated with a ‘c’ or ‘u’ are masked as ‘no’.
N = Population
n= sample
s= sample standard deviation
SE= Standard Error
ME= Margin of Error
u= underrepresented
c= confidential
For VARIABLE means and totals, the following equation was used:
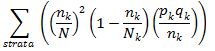
In order to estimate errors the total sampling variance for the proportion was computed using:
Where:
N =population
Nk = Strata Size.
nk = Sample within strata.
Pk = Estimated Proportion of strata.
qk = 1-pk
Standard error was set at 95% confidence level.
In the case of ratios, the bootstrap method was utilised with size classes for enterprise as sample parameters.
Main reference in the literature:
None.
How has the stratification been taken into account?
Refer to point 13.2.1.1.b
Which strata have been considered?
Activity group and size class.
13.3. Non-sampling error
See detailed sections below.
13.3.1. Coverage error
See concept 18.1.1. A) Description of frame population.
13.3.1.1. Over-coverage - rate
There was no over-coverage in the 2025 survey.
13.3.1.2. Common units - proportion
Not requested
13.3.2. Measurement error
No measurement errors.
13.3.3. Non response error
See detailed sections below.
13.3.3.1. Unit non-response - rate
See detailed sections below.
13.3.3.1.1. Unit response
The following table contains the number of units (i.e. enterprises), by type of response to the survey and by the percentage of these values in relation to the gross sample size.
Type of response
Enterprises
0-9 (or 2-9) employees and self-employed persons
10 or more employees and self-employed persons
Number
%
Number
%
Gross sample size (as in section 3.1 C)
100%
1,946
100%
1. Response (questionnaires returned by the enterprise)
1,435
73.7%
1.1 Used for tabulation and grossing up (Net sample or Final Sample; as in section 3.1 D)
1,435
73.7%
1.2 Not used for tabulation
0
0
1.2.1 Out of scope (deaths, misclassified originally in the target population, etc.)
0
0
1.2.2 Other reasons (e.g. unusable questionnaire)
0
0
2. Non-response (e.g. non returned mail, returned mail by post office)
1,233
26.3%
Comments on unit response, if unit response is below 60%
During this year the mode of data collection was changed from email to a web based survey. As a result this change might have had an impact on the overall response rate.
13.3.3.1.2. Methods used for minimizing unit non-response
Participating in this survey is made compulsory under Maltese Law, MSA ACT (XXIV) of 2004. Non respondents where allocated to interviewers who were instructed to personally contact enterprises and assist them in filing up the survey.
13.3.3.1.3. Methods used for unit non-response treatment
1. No treatment for unit non-response
2.1 Treatment by re-weighting: Re-weighting by the sampling design strata considering that non-response is ignorable inside each stratum (the naïve model)
2.2 Treatment by re-weighting: Re-weighting by identified response homogeneity groups (created using sample-level information)
2.3 Treatment by re-weighting: Re-weighting through calibration/post-stratification (performed using population information) by the groups used for calibration/post-stratification
X
3. Treatment by imputation (done distinctly for each variable/item)
X
4. Method(s) and the model(s) corresponding to the above or other method(s) used for the treatment of unit non-response. (e.g. Re-weighting using Horvitz-Thompson estimator, ratio estimator or regression estimator, auxiliary variables)
Treatment by imputation was only used for strata with low counts. Where possible, information was linked with last years’ information or searched online. For instance online checks to verify whether respondents actually had a website in order to impute missing information. Nevertheless other information which was not possible to derive from administrative sources was treated as item non response.
For other variables, responses were inputted into a matrix depending on their Nace category and size class. This made it possible to pin point poor response in particular categories and take remedial action. Furthermore this approach ensured that null strata that cannot support any kind of weighting structure are eliminated.
Further elements of non-response were tackled through post stratification weighting, based on strata created by eligible size classes and NACE Rev 2 groups. (10-18, 19-23, 24-25, 26-33, 35-39, 41-43, 45-47, 49-53, 55, 56, 58-63, 68, 69-74)
13.3.3.1.4. Assessment of unit non-response bias
None.
13.3.3.2. Item non-response - rate
The item non-response rate is very low since interviewers were instructed to chase enterprises and obtain a complete response.
13.3.3.2.1. Methods used for item non-response treatment
1. No treatment for item non-response
2. Deductive imputation An exact value can be derived as a known function of other characteristics.
3. Deterministic imputation (e.g. mean/median, mean/median by class, ratio-based, regression-based, single donor nearest-neighbour) Deterministic imputation leads to estimators with no random component, that is, if the imputation were to be re-conducted, the outcome would be the same.
x
4. Random imputation (e.g. hot-deck, cold-deck) Random imputation leads to estimators with a random component, that is, if the imputation were re-conducted, it would have led to a different result.
5. Re-weighting
6. Multiple imputation In multiple imputation each missing value is replaced (instead of a single value) with a set of plausible values that represent the uncertainty of the right value to impute. Multiple imputation methods offer the possibility of deriving variance estimators by taking imputation into account. The incorporation of imputation into the variance can be easily derived based on variability of estimates among the multiply imputed data sets.
7. Method(s) and the model(s) corresponding to the above or other method(s) used for the treatment of item non-response.
Questionnaires were checked for missing or incoherent information and where possible the responding unit was contacted to clarify or provide further details . In cases where this could not be achieved, imputations were carried out using the distribution of the variable by NACE and size of enterprise.
In the case of X1 (employment) and X2 (turnover), missing values were imputed using alternative data sources, mainly the Structure Business Statistics or Job Vacancy Survey data.
13.3.3.2.2. Questions or items with item response rates below 90% and other comments
Other comments relating to the item non-response
Additional issues concerning "item non-response" calculation (e.g. method used in national publications): None.
Questions and items with low response rates (cut-off value is 90%) and item non-response rate: None.
13.3.4. Processing error
No processing errors were detected.
13.3.5. Model assumption error
Not requested
14.1. Timeliness
See detailed sections below.
14.1.1. Time lag - first result
Not applicable
14.1.2. Time lag - final result
Data are to be delivered to Eurostat in the fourth quarter of the reference year (due date for the finalised dataset is 5th October). European results are released before the end of the survey year or in the beginning of the year following the survey year (T=reference year, T+0 for indicators referring to the current year, T+12 months for other indicators referring to the previous year e.g. e-commerce).
At national level:
Data was finalized and submitted to Eurostat by the 6th October. Revisions to the data submitted on 6th October were made during February and March 2026.
No results were published at a national level yet.
14.2. Punctuality
See detailed section in the full metadata view.
14.2.1. Punctuality - delivery and publication
Data were delivered to Eurostat on 6th October 2025; 1 day after the deadline.
15.1. Comparability - geographical
The model questionnaire is generally used by the countries that conduct the survey on ICT usage and e-commerce in enterprises. Due to (small) differences in translation, in the used survey vehicle, in non-response treatment or different routing through the questionnaire, some results for some countries may be of reduced comparability. In these cases, notes are added in the data.
Detailed information on differences in the wording of the questions in the national questionnaires is available in “ Annex I. Completeness “ - worksheets related to questionnaire, coverage, additional questions.
Comparability between regions:
Data on NUTS 2 regional level are out of scope for MT
Detailed information on the provision of data on NUTS 2 regional level is available in “Annex I. Completeness“ – worksheets related to regional data.
15.1.1. Asymmetry for mirror flow statistics - coefficient
Not applicable
15.2. Comparability - over time
See detailed section in the full metadata view.
15.2.1. Length of comparable time series
The length of comparable time series depends on the module and the variable considered within each survey module. Additional information is available in annexes attached to the European metadata.
The main benchmarking indicators for the digital agenda have been collected since 2005 and are consistently comparable over time. However, a break in series was introduced for turnover and e-commerce related variables due to the complete implementation of the complex Enterprise unit. This transition resulted in level shifts in the monetary indicators.
15.3. Coherence - cross domain
Not applicable
15.3.1. Coherence - sub annual and annual statistics
Data related to turnover may be subject to revision since the figures collected for this variable are usually preliminary and the more finalised amounts are usually available at t+18 months.. The rest of the data collected are usually not subject to revisions.
17.2.1. Data revision - average size
Not requested
18.1. Source data
A) Frame population description and distribution
For more information see concept 18.1.1.
B) Sampling design - Sampling method
Description of the sampling method used (e.g. stratified random sample, quota sampling, cluster sampling; one-stage or two-stage sampling) and information which variables were used to stratify, the categories of those variables, in particular for the NACE Rev. 2 categories related to the "possible calculation of European aggregates", and the final number of strata:
A stratified random sampling process (without replacement), based on margin of error relative to the mean, was employed for this survey. This probability sampling method entails the partitioning of the population (2,668 enterprises) into mutually exclusive strata that were constructed relative to the NACE categories at 2-digit level and employment size classes (10-49, 50-249, ≥250). An independent (simple) random sample was then selected from each of these strata to ensure a uniform distribution of the sample relative to the pre-selected characteristics of the population.
C) Gross sample distribution
Detailed information is available in “ Annex III. Sample and standard error tables 2025 “ (Worksheet: GROSS SAMPLE)
D) Net sample distribution
Detailed information is available in “ Annex III. Sample and standard error tables 2025 “ (Worksheet: NET SAMPLE)
18.1.1. Sampling design & Procedure frame
A) Description of frame population
a) When was the sample for the ICT usage and e-commerce in enterprise survey drawn?
February 2025
b) Last update of the Business register that was used for drawing the sample of enterprises for the survey:
February 2025
c) Indication if the frame population is the same as, or is in some way coordinated with, the one used for the Structural Business Statistics (different snapshots):
Both the ICT survey and the Structural Business Statistics survey have the same parameters for their population frame. However, the sample for both surveys is taken at different points in time.
d) Description if different frames are used during different stages of the statistical process (e.g. frame used for sampling vs. frame used for grossing up):
When grossing up of data is carried out the sampling frame is updated with information received during the survey.
e) Indication the shortcomings in terms of timeliness (e.g. time lag between last update of the sampling frame and the moment of the actual sampling), geographical coverage, coverage of different subpopulations, data available etc., and any measures taken to correct it, for this survey.
Full geographical coverage was achieved.
B) Frame population distribution
Detailed information is available in “ Annex III. Sample and standard error tables 2025 “ (Worksheet: FRAME POPULATION)
18.2. Frequency of data collection
Annual
18.3. Data collection
See detailed sections below.
18.3.1. Survey period
Survey / Collection
Date of sending out questionnaires
Date of reception of the last questionnaire treated
General survey
March 2025
July 2025
Micro-enterprises
Microenterprises (1 TO 9) not surveyed
Microenterprises (1 TO 9) not surveyed
18.3.2. Survey vehicle – general survey
General survey - Stand-alone survey
18.3.3. Survey vehicle – micro-enterprises
Not applicable
18.3.4. Survey type
The survey was carried out using a web-based approach. All respondents were sent an introductory letter via email or ordinary mail. The invitiation letter contained a link to the survey and respondents were given the facility to submit their replies via the web. When answering the questionnaire respondents could save and resume the survey at a later stage. In addition they were also given the opportunity to submit any relevant comments at the very end of the survey. This mode of collection also enabled the use of a number of checks in order to ensure consistency of results. The tool which is being used for the collection of this survey was also able to send reminders to non responding units and acknowledgements to companies who provided a reply.
18.3.5. Survey participation
Mandatory
18.4. Data validation
An internal validation program is used during the inputting stage. At the analysis stage checks at micro level for units which are common in year t and year t-1 are made. This step is carried out in order to ensure consistency of results between different years and across the same units.
18.5. Data compilation
Grossing-up procedures
Total number of enterprises, employees and total turnover are weighted separately. Number of enterprises, employment and turnover estimates are based on the business register held by the NSO.
Both grossing up weights are based on the size class and NACE category of the enterprise.
Given the relatively high response achieved, resulting weights tend to be relatively small.
18.5.1. Imputation - rate
Questionnaires were checked for missing or incoherent information and where possible the responding unit was contacted to clarify or provide further details . In cases where this could not be achieved, imputations were carried out using the distribution of the variable by NACE and size of enterprise.
In the case of X1 (employment) and X2 (turnover), missing values were imputed using alternative data sources, mainly the Structure Business Statistics or Job Vacancy Survey data.
18.6. Adjustment
Not applicable
18.6.1. Seasonal adjustment
Not applicable
Problems encountered and lessons to be learnt:
19.1. Documents
Questionnaire in national language
Yes
Questionnaire in English (if available)
Yes
National reports on methodology (if available)
Analysis of key results, backed up by tables and graphs in English (if available)
Data on the Information and Communication Technologies (ICT) usage and e-commerce in enterprises are survey data. They are collected by the National Statistical Institutes or Ministries and are in principle based on Eurostat's annual model questionnaires on ICT usage and e-commerce in enterprises.
The legal basis for ICT enterprise statistics for survey year 2025 is Commission Implementing Regulation (EU) 2024/1883 of 9 July 2024 laying down the technical specifications of data requirements for the topic 'ICT usage and e-commerce' for the reference year 2025. Large part of the data collected is used to support measuring the implementation and monitoring of the EU’s digital targets for 2030, set by the Digital Decade Policy Programme.
Four of the key performance indicators (KPIs) of the current programme stem from the statistics for which the implementing and delegated acts are enclosed for adoption: Artificial Intelligence, cloud, data analytics and the digital intensity index (DII) - a composite indicator reflecting the digital transformation of business
The aim of the European survey on ICT usage and e-commerce in enterprises is to collect and disseminate harmonised and comparable information at European level.
Name of data collection
ICT Usage and e-Commerce in Enterprises 2025
17 March 2026
The model questionnaire on ICT usage and e-commerce in enterprises provides a large variety of variables covering among others the following topics:
Access and use of the Internet
E-commerce
Data utilisation and analytics
Use of cloud computing services
Artificial intelligence
ICT and the environment.
The annual model questionnaires and the European businesses statistics compliers’ manual for ICT usage and e-commerce in enterprises comprise definitions and explanations regarding the topics of the survey.
The Enterprise concept was used in this survey and is defined as: ‘The smallest combination of legal units, that is an organisational unit producing goods or services, which benefits from a certain degree of autonomy in decision-making, especially for the allocation of its current resources. An enterprise carries out one or more activities at one or more locations. An enterprise may be a sole legal unit.’
Target Population
As required by Annex of the Commission Implementing Regulation, enterprises with 10 or more employees and self-employed persons are covered by the survey.
For micro-enterprises see the sub-concepts below.
Detailed information on the provision of data on NUTS 2 regional level is available in “Annex I. Completeness“.
The survey had total geographical coverage of the Maltese Islands (NUTS 2 level)
Where not specified the reference period is current situation (survey period in 2025). Year 2024 for the employment, turnover, value or % of sales data and where specified.
Comments on reliability and representativeness of results and completeness of dataset
These comments reflect overall standard errors reported for the indicators and breakdowns in section 13.2.1 (Sampling error - indicators) and the rest of the breakdowns for national and European aggregates, as well as other accuracy measurements. The estimated standard error should not exceed 2pp for the overall proportions and should not exceed 5pp for the proportions related to the different subgroups of the population (for those NACE aggregates for the calculation and dissemination of national aggregates). If problems were found, these could have implications for future surveys (e.g. need to improve sampling design, to increase sample sizes, to increase the response rates).
Detailed information is available in “ Annex II. Accuracy “ - related to European aggregates, comments on reliability and use of flag.
Percentages of enterprises, Percentages of turnover, Percentages of employees and self-employed persons, Million euro (for selected indicators in some countries).
Grossing-up procedures
Total number of enterprises, employees and total turnover are weighted separately. Number of enterprises, employment and turnover estimates are based on the business register held by the NSO.
Both grossing up weights are based on the size class and NACE category of the enterprise.
Given the relatively high response achieved, resulting weights tend to be relatively small.
A) Frame population description and distribution
For more information see concept 18.1.1.
B) Sampling design - Sampling method
Description of the sampling method used (e.g. stratified random sample, quota sampling, cluster sampling; one-stage or two-stage sampling) and information which variables were used to stratify, the categories of those variables, in particular for the NACE Rev. 2 categories related to the "possible calculation of European aggregates", and the final number of strata:
A stratified random sampling process (without replacement), based on margin of error relative to the mean, was employed for this survey. This probability sampling method entails the partitioning of the population (2,668 enterprises) into mutually exclusive strata that were constructed relative to the NACE categories at 2-digit level and employment size classes (10-49, 50-249, ≥250). An independent (simple) random sample was then selected from each of these strata to ensure a uniform distribution of the sample relative to the pre-selected characteristics of the population.
C) Gross sample distribution
Detailed information is available in “ Annex III. Sample and standard error tables 2025 “ (Worksheet: GROSS SAMPLE)
D) Net sample distribution
Detailed information is available in “ Annex III. Sample and standard error tables 2025 “ (Worksheet: NET SAMPLE)
Annual
See detailed sections below.
The model questionnaire is generally used by the countries that conduct the survey on ICT usage and e-commerce in enterprises. Due to (small) differences in translation, in the used survey vehicle, in non-response treatment or different routing through the questionnaire, some results for some countries may be of reduced comparability. In these cases, notes are added in the data.
Detailed information on differences in the wording of the questions in the national questionnaires is available in “ Annex I. Completeness “ - worksheets related to questionnaire, coverage, additional questions.
Comparability between regions:
Data on NUTS 2 regional level are out of scope for MT
Detailed information on the provision of data on NUTS 2 regional level is available in “Annex I. Completeness“ – worksheets related to regional data.