|
 |
| For any question on data and metadata, please contact: Eurostat user support |
|
|||
| 1.1. Contact organisation | Hungarian Central Statistical Office |
||
| 1.2. Contact organisation unit | HCSO Multi-domain Statistics Department |
||
| 1.5. Contact mail address | Hungarian Central Statistical Office (Központi Statisztikai Hivatal) Keleti Károly utca 5-7. H-1024 Budapest Hungary |
||
|
|||
| 2.1. Metadata last certified | 14/03/2024 | ||
| 2.2. Metadata last posted | 14/03/2024 | ||
| 2.3. Metadata last update | 14/03/2024 | ||
|
|||
| 3.1. Data description | |||
Data on the Information and Communication Technologies (ICT) usage and e-commerce in enterprises are survey data. They are collected by the National Statistical Institutes or Ministries and are in principle based on Eurostat's annual model questionnaires on ICT usage and e-commerce in enterprises. Large part of the data collected is used to measure the progress in the implementation of one of the main political priorities of the European Commission for 2019 to 2024 – A Europe fit for the digital age. Part of this is the "European strategy for data", envisioning a single market for data to ensure the EU's global competitiveness and data sovereignty, in which context a comprehensive set of new rules for all digital services was proposed: the Digital Services Act and the Digital Markets Act, which are centrepieces of the EU digital strategy. Furthermore, the Commission and the High Representative of the Union for Foreign Affairs and Security Policy presented a new “EU cybersecurity strategy”, which is intended to bolster the EU's collective resilience against cyber threats, safeguard a global and open internet and protect EU values and the fundamental rights of its people. Furthermore, data will allow monitoring the progress towards A Europe fit for the digital age, one of the six priorities for the period 2019-2024 of the von der Leyen European Commission. The aim of the European survey on ICT usage and e-commerce in enterprises is to collect and disseminate harmonised and comparable information at European level.
|
|||
| 3.2. Classification system | |||
| 3.3. Coverage - sector | |||
All economic activities in the scope of Annex I of the Commission Regulation are intended to be included in the general survey, covering enterprises with 10 or more employees and self-employed persons. These activities are: NACE Rev. 2 sections C, D, E, F, G, H, I, J, L, M and N, division 95.1. For micro-enterprises see the sub-concepts below. |
|||
| 3.3.1. Coverage-sector economic activity for micro-enterprises - All NACE Rev. 2 categories are covered | |||
| 3.3.2. Coverage sector economic activity for micro-enterprises - If not all activities were covered, which ones were covered? | |||
Not applicable |
|||
| 3.4. Statistical concepts and definitions | |||
The model questionnaire on ICT usage and e-commerce in enterprises provides a large variety of variables covering among others the following areas: - Access to and use of the Internet - E-commerce and e-business - Use of cloud computing services - Artificial Intelligence - Other topics: Data utilisation, sharing, analytics and trading, Invoicing. The annual model questionnaires and the European businesses statistics compliers’ manual for ICT usage and e-commerce in enterprises comprise definitions and explanations regarding the topics of the survey. |
|||
| 3.5. Statistical unit | |||
The sample drawn are based on statistical unit enterprises. So it is drawn from Enterprise/Business Register for 2021. |
|||
| 3.6. Statistical population | |||
Target Population As required by Annex of the Commission Implementing Regulation, enterprises with 10 or more employees and self-employed persons shall be covered by the survey. For micro-enterprises see the sub-concepts below. |
|||
| 3.6.1. Coverage of micro-enterprises | |||
| No | |||
| 3.6.2. Breakdown between size classes [0 to 1] and [2 to 9] | |||
| No | |||
| 3.6.3. If for micro-enterprises different size delimitation was used, please indicate it. | |||
Not applicable |
|||
| 3.7. Reference area | |||
The survey covers the whole country. According to the used stratification scheme for enterprises with one unit, the eight regions (NUTS2) are treated separately, the stratification scheme for enterprises with more than one unit doesn't comprises the regional breakdown. So strata for enterprises with more than one unit are stratified only according to NACE category and size class. Data for a specific set of variables were delivered on NUTS 2 regional level.
|
|||
| 3.8. Coverage - Time | |||
Years 2022 and 2023. |
|||
| 3.9. Base period | |||
Not applicable |
|||
|
|||
Percentages of enterprises, Percentages of turnover, Percentages of employees and self-employed persons, and Million HUF |
|||
|
|||
According to Eurostat model questionnaire: Year 2022 for value and % of sales and orders data, invoice data. Year 2022 is reference year also for Data trading 3.6. and 3.7 (C6, C7) and for questions on ICT specialists (except the first question in the module) and e-government data. Questions on ICT specialists and e-government are asked as additional national questions. Where not specified the respondents should consider as reference period their current situation (the first quarter 2023). |
|||
|
|||
| 6.1. Institutional Mandate - legal acts and other agreements | |||
Complementary national legislation constituting the legal basis for the survey on the use of ICT in enterprises: Data collection is obligatory in accordance with the law on official statistics 2016/CLV, 24, 26 §.
|
|||
| 6.2. Institutional Mandate - data sharing | |||
Not applicable |
|||
|
|||
| 7.1. Confidentiality - policy | |||
Regulation (EC) No 223/2009 on European statistics (recital 24 and Article 20(4)) of 11 March 2009 (OJ L 87, p. 164), stipulates the need to establish common principles and guidelines ensuring the confidentiality of data used for the production of European statistics and the access to those confidential data with due account for technical developments and the requirements of users in a democratic society. At national level :
- Official statistical activity is regulated by Act CLV of 2016 on Official Statistics entered into force on 1 January 2017 and by Government Decree 184/2017. (VII. 5.) issued for the implementation of this law
No specific confidentiality policy on ICT is available, but the Hungarian Central Statistical Office's national confidentiality policy - based on Act on Satatistics (XLVI of 1993) and on Regulation (EC) 223/2009 on European Statistics - is applied to ICT statistics. HCSO's confidentiality policy is available on the website at www.ksh.hu -> Rólunk -> Tevékenység -> Irányelvek, jelentések, politikák -> Adatvédelmi politika. The English translation is available at http://www.ksh.hu/?lang=en -> About us -> Activity, data of public interest -> Guidelines, reports, policies -> Confidentiality policy Confidentiality policy of the Hungarian Central Statistical Office (ksh.hu)
|
|||
| 7.2. Confidentiality - data treatment | |||
Data are transmitted via eDamis (encrypted) and delivered to a secure environment where they are treated. Flags are added for confidentiality in case results must not be disclosed. At national level :
HCSO's confidentiality policy is available on the website at www.ksh.hu -> Rólunk -> Tevékenység -> Irányelvek, jelentések, politikák -> Adatvédelmi politika. The English translation is available at www.ksh.hu -> About us -> Activity, data of public interest -> Guidelines, reports, policies -> Confidentiality policy Confidentiality policy of the Hungarian Central Statistical Office (ksh.hu) In addition other guidelines on data treatment: Data revision policy of HCSO (ksh.hu) |
|||
|
|||
| 8.1. Release calendar | |||
Yes, there is a calendar, but it is available within the Office for internal use only. The first release is December 2023. |
|||
| 8.2. Release calendar access | |||
Please complete for the Quality report.
The results of the survey on ICT usage of enterprises for the year 2023 will be available on the HCSO website (www.ksh.hu) under the STADAT-tables by the end of December 2023 and under HCSO's Dissemination database by the end of January 2024.
Tables (STADAT) in 2023: 12. Information, communication – Hungarian Central Statistical Office (ksh.hu) Dissemination database: KSH Statinfo v40 | Theme selection Publication: https://www.ksh.hu/katalogus/#/kiadvanyok/tema/informacio-kommunikacio!kategoria=atfogo-elemzes
Data for 2023 will be published in a separate analysing publication in the first half of 2024.
The results will be available furthermore in the Statistical Pocket Book in May 2024, in the Statistical Year Book in September 2024 and in the Regional Statistical Year Book of Hungary in second half of 2024. |
|||
| 8.3. Release policy - user access | |||
In line with the Community legal framework and the Eurostat Statistics Code of Practice HCSO disseminates ICT data on HCSO's website respecting professional independence and in an objective, professional and transparent manner in which all users are treated equally. The detailed arrangements are governed by the Hungarian protocol on impartial access to national data for users.
https://www.ksh.hu/docs/bemutatkozas/eng/tajpol_web_eng.pdf?lang=en
|
|||
|
|||
Annual |
|||
|
|||
| 10.1. Dissemination format - News release | |||
Online news releases to specific occasions (eg. Internet day): https://www.ksh.hu/information-communication |
|||
| 10.2. Dissemination format - Publications | |||
Data for 2023 and those relating to the year 2022 (such as sales and purchases and others according to MQ2023) will be published in a separate analysing publication in the first half of 2024. http://www.ksh.hu/apps/shop.lista?p_lang=HU&p_temakor_kod=ON
2023 data will be available in HCSO's database called Adattárház by the end of January2024. KSH Statinfo v39 | Theme selection
The results of the survey on ICT usage and e-commerce in business for the year 2023 will be available on the HCSO website (www.ksh.hu) under the Stadat-tables by the end of December 2023. Hungarian Central Statistical Office (ksh.hu) 12.1.1.10. Services provided on enterprises' websites (ksh.hu); 12.1.1.11. Enterprises using the Internet to interact with public authorities (ksh.hu); 12.1.1.12. Social media usage by enterprises using internet (ksh.hu);12.1.1.13. Need for ICT specialists s and skills in enterprises using computers (ksh.hu)
The results will be available furthermore in the Statistical Pocket Book in May 2024,
Magyar Statisztikai Zsebkönyv, 2023; in English: Statistical Pocketbook of Hungary, 2023 Publication Repertory - Hungarian Central Statistical Office (ksh.hu)
Területi Statisztikai Évkönyv, 2023; in English: Regional Statistical Yearbook of Hungary, 2023 Publication Repertory - Hungarian Central Statistical Office (ksh.hu)
Magyar Statisztikai Évkönyv, 2021; in English: Statistical Yearbook of Hungary, 2021 Publication Repertory - Hungarian Central Statistical Office (ksh.hu)
|
|||
| 10.3. Dissemination format - online database | |||
See detailed section 10.3.1. |
|||
| 10.3.1. Data tables - consultations | |||
Results for selected variables collected in the framework of this survey are available for all participating countries on Digital economy and society of Eurostat website. At national level :
Results for selected variables collected in the framework of this survey are available for all participating countries on Digital economy and society of Eurostat website. The aggregated results presented on HCSO's website grouped thematically and organized in static (ready-made) tables, which are accessible through the following link:
The comprehensive collection of completed tables (STADAT): “Information, communication”
Hungarian Central Statistical Office (ksh.hu) 12.1.1.10. Services provided on enterprises' websites (ksh.hu); 12.1.1.11. Enterprises using the Internet to interact with public authorities (ksh.hu); 12.1.1.12. Social media usage by enterprises using internet (ksh.hu);12.1.1.13. Need for ICT specialists s and skills in enterprises using computers (ksh.hu)
Dissemination database: KSH Statinfo v39 | Theme selection
|
|||
| 10.4. Dissemination format - microdata access | |||
Micro data also available on demand (for use of research institutes, universities etc) after anonymising the enterprises. |
|||
| 10.5. Dissemination format - other | |||
Not requested |
|||
| 10.5.1. Metadata - consultations | |||
Not requested |
|||
| 10.6. Documentation on methodology | |||
The “Metainformation/Statistical domain” (Concepts and definitions, Classifications, Data sources, Data collections) for ICT usage statistics are available on HCSO's website, which is accessible through the following link: https://www.ksh.hu/apps/meta.objektum?p_lang=EN&p_menu_id=110&p_ot_id=100&p_obj_id=CCBE |
|||
| 10.6.1. Metadata completeness - rate | |||
Not requested |
|||
| 10.7. Quality management - documentation | |||
The QUALITY GUIDELINES for the statistical processes of the Hungarian Central Statistical Office is available on HCSO's website, which is accessible through the following link: https://www.ksh.hu/docs/bemutatkozas/eng/minosegi_iranyelvek_eng.pdf;
The Quality policy of HCSO is available on HCSO'S website, which is accessible through the following link: https://www.ksh.hu/docs/bemutatkozas/eng/minpol_web_eng.pdf
|
|||
|
|||
| 11.1. Quality assurance | |||
The European businesses statistics compliers’ manual for ICT usage and e-commerce in enterprises provides guidelines and standards for the implementation of the surveys. It is updated every year according to the changed contents of the model questionnaires. At national level :
The main principles for HCSO's quality policy is available on the website: https://www.ksh.hu/guidelines_policies_strategy In general we also have to make Quality Reports for each of the statistical domains and make efforts to improve quality of data collections and data itself
In general HCSO also has to make Quality Reports for all statistical domains and make effort to improve quality of data collections and data itself.
The main principles for HCSO's quality policy is available on the website: https://www.ksh.hu/guidelines_policies_strategy
The national survey’s questionnaire is based on the Model Questionnaire (MQ) unified by Eurostat. By applying this questionnaire, the HCSO ensures the possibility of the comparison of the results of the survey on European level. The guidelines of the Methodological manual of Eurostat (Methodological manual Part II. Household survey) are also used for compiling the content of the Hungarian questionnaire and the detailed guide. In addition, during the planning of the Hungarian survey and the different stages of the implementation process, the “Quality Guidelines for the Statistical Process of the HCSO” compiled by HCSO are applied in order to ensure compliance with the requirements defined by Eurostat.
(https://www.ksh.hu/docs/bemutatkozas/eng/minosegi_iranyelvek_eng.pdf; https://www.ksh.hu/docs/bemutatkozas/eng/estfm_eng.pdf)
|
|||
| 11.2. Quality management - assessment | |||
European level : At European level, the recommended use of the annual Eurostat model questionnaire aims at improving comparability of the results among the countries that conduct the survey on ICT usage and e-commerce in enterprises. Moreover, the Methodological Manual provides guidelines and clarifications for the implementation of the surveys. National level :
In case of ICT usage by enterprises to improve data quality and consistency with other business statistics, since 2014 we get the background variables directly from the Hungarian SBS and tax database. Since 2021 with the introduction of SUE we get the background variables directly from the Hungarian SBS. (On the other hand the main improvements were the introduction of the integrated electronic data collection system in 2013 and the reallocation of the sample in 2014 (without the financial sector).) To further increase the quality of the data collection. We have conducted a pilot study among data providers on the comprehensibility of the questions. We have also launched short tutorial films on the most problematic questions, which will be available on HCSO's website from the year 2023. |
|||
|
|||
| 12.1. Relevance - User Needs | |||
The main user of data on ICT usage is EUROSTAT, and the Ministries and other government organisations, other decision-makers, under- and postgraduate students, researchers, and the media. Data are published in the EUROSTAT database and are updated yearly. At European level, the European Commission’s entities (e.g. DG CNECT, DG REGIO, etc.) are the principal users of the data. Users’ needs are considered throughout the whole development process of the Model Questionnaire aiming to provide relevant statistical data for monitoring and benchmarking of European policies. European level : At European level, European Commission users (e.g. DG CNECT, DG GROW, DG JUST, DG REGIO, DG JRC) are the principal users of the data on ICT usage and e-commerce in enterprises and contribute in identifying/defining the topics to be covered. Hence, main users are consulted regularly (at hearings, task forces, ad hoc meetings) for their needs and are involved in the process of the development of the model questionnaires at a very early stage. User needs are considered throughout the whole discussion process of the model questionnaires aiming at providing relevant statistical data for monitoring and benchmarking of European policies. National level : Beside Eurostat, our main data users are the national policy makers, researchers. We have consultations with ministries and public authorities every year during the preparation for the next year's survey. If a specific data need is occured, users can get into contact with us through Contact Centre.To satisfy other data needs publications and tables available on the website. |
|||
| 12.2. Relevance - User Satisfaction | |||
European level : At European level, contacts within the Commission, the OECD and other stakeholders give a clear picture about the key users' satisfaction as to the following data quality aspects: accuracy and reliability of results, timeliness, satisfactory accessibility, clarity and comparability over time and between countries, completeness and relevance. Overall users have evaluated positively (good, very good) the data quality on the ICT usage and e-commerce in enterprises. National level : National Statistics Code of Practice: 3. User orientation https://www.ksh.hu/docs/bemutatkozas/eng/national_statistics_code_of_practice.pdf
|
|||
| 12.3. Completeness | |||
Detailed information is available in “ Annex I _ Completeness “ excel file - related to questionnaire, coverage, additional questions.
Annex I. _ Completness All of the variables required for transmission have been included |
|||
| 12.3.1. Data completeness - rate | |||
Not requested. |
|||
|
||||||||||||||||||||||||||||||||||||||||||||||||||
| 13.1. Accuracy - overall | ||||||||||||||||||||||||||||||||||||||||||||||||||
Comments on reliability and representativeness of results and completeness of dataset These comments reflect overall standard errors reported for the indicators and breakdowns in section 13.2.1 (Sampling error - indicators) and the rest of the breakdowns for national and European aggregates, as well as other accuracy measurements. The estimated standard error should not exceed 2pp for the overall proportions and should not exceed 5pp for the proportions related to the different subgroups of the population (for those NACE aggregates for the calculation and dissemination of national aggregates). If problems were found, these could have implications for future surveys (e.g. need to improve sampling design, to increase sample sizes, to increase the response rates). More detailed information is available in “ Annex II. _ Accuracy “ excel file - related to European aggregates, comments on reliability and use of flag. HCSO's confidentiality policy is available on the website at www.ksh.hu -> Rólunk -> Tevékenység -> Irányelvek, jelentések, politikák -> Adatvédelmi politika. The English translation is available at www.ksh.hu -> About us -> Activity, data of public interest -> Guidelines, reports, policies -> Confidentiality policy |
||||||||||||||||||||||||||||||||||||||||||||||||||
| 13.2. Sampling error | ||||||||||||||||||||||||||||||||||||||||||||||||||
For calculation of the standard error see 13.2.1.1. |
||||||||||||||||||||||||||||||||||||||||||||||||||
| 13.2.1. Sampling error - indicators | ||||||||||||||||||||||||||||||||||||||||||||||||||
Standard error (for selected indicators and breakdowns) Precision measures related to variability due to sampling, unit non-response (the size of the subset of respondents is smaller than the size of the original sample) and other (imputation for item non-response, calibration etc.) are not (yet) required from the Member states for all indicators. Eurostat will make basic assumptions to compute these measures for all indicators produced (e.g. stratified random sampling assuming as strata the crossing of the variables “Number of employees and self-employed persons” and “Economic Activity” as it was defined in the 3 tables of section 18.1). More detailed information is available in“ Sample and standard error tables 2023 “ excel file – worksheets starting with “Standard error".
|
||||||||||||||||||||||||||||||||||||||||||||||||||
| 13.2.1.1. Sampling error indicator calculation | ||||||||||||||||||||||||||||||||||||||||||||||||||
Various methods can be used for the calculation of the standard error for an estimated proportion. The aim is to incorporate into the standard error the sampling variability but also variability due to unit non-response, item non-response (imputation), calibration etc. In case of census / take-all strata, the aim is to calculate the standard errors comprising the variability due to unit non-response and item non-response.
|
||||||||||||||||||||||||||||||||||||||||||||||||||
| 13.3. Non-sampling error | ||||||||||||||||||||||||||||||||||||||||||||||||||
See detailed sections below. |
||||||||||||||||||||||||||||||||||||||||||||||||||
| 13.3.1. Coverage error | ||||||||||||||||||||||||||||||||||||||||||||||||||
See concept 18.1.1. A) Description of frame population. |
||||||||||||||||||||||||||||||||||||||||||||||||||
| 13.3.1.1. Over-coverage - rate | ||||||||||||||||||||||||||||||||||||||||||||||||||
Over-coverage is caused by enterprises which went bankrupt, became insolvent or interrupted their activities during the reference period. The rate of over coverage is negligible (~0.1%) and can be found in the QR. |
||||||||||||||||||||||||||||||||||||||||||||||||||
| 13.3.1.2. Common units - proportion | ||||||||||||||||||||||||||||||||||||||||||||||||||
Not requested |
||||||||||||||||||||||||||||||||||||||||||||||||||
| 13.3.2. Measurement error | ||||||||||||||||||||||||||||||||||||||||||||||||||
There are indicators which is unlikely to change from "yes" to "no" from one year to the other. Year to year comparisons is included in ADÉL system. In case of outliers, the respondent enterprise is called to audit their data. Validation rules are also built in ELEKTRA itself, but there are more strict rules built in the data entry and validation system (ADÉL). All these helps to minimize measurement error. |
||||||||||||||||||||||||||||||||||||||||||||||||||
| 13.3.3. Non response error | ||||||||||||||||||||||||||||||||||||||||||||||||||
See detailed sections below. |
||||||||||||||||||||||||||||||||||||||||||||||||||
| 13.3.3.1. Unit non-response - rate | ||||||||||||||||||||||||||||||||||||||||||||||||||
See detailed sub-concepts below. |
||||||||||||||||||||||||||||||||||||||||||||||||||
| 13.3.3.1.1. Unit response | ||||||||||||||||||||||||||||||||||||||||||||||||||
The following table contains the number of units (i.e. enterprises), by type of response to the survey and by the percentage of these values in relation to the gross sample size.
|
||||||||||||||||||||||||||||||||||||||||||||||||||
| 13.3.3.1.2. Methods used for minimizing unit non-response | ||||||||||||||||||||||||||||||||||||||||||||||||||
The survey on ICT Usage and e-commerce in enterprises is obligatory for all enterprises included in the sample. They had to send back the filled questionnaire until the 16th of April via electronic survey system (ELEKTRA).
In case of those enterprises that were selected for data supply but failed to return the questionnaire by the deadline, written reminders were mailed and were reminded by phone about the expiry of the deadline.
We have time to call back those enterprises that failed to send back the questionnaires. As the background information is from the SBS data which we get in September the earliest, we usually end the collection procedure in August. Due to this routine we can reach high response rate and also have time to check the suspicious data. There are a few indicator which is unlikely to change from "yes" to "no" from one year to the other. In these cases we have a built-in check for the data collectors, so they can call the enterprise and verify the data.
|
||||||||||||||||||||||||||||||||||||||||||||||||||
| 13.3.3.1.3. Methods used for unit non-response treatment | ||||||||||||||||||||||||||||||||||||||||||||||||||
|
||||||||||||||||||||||||||||||||||||||||||||||||||
| 13.3.3.1.4. Assessment of unit non-response bias | ||||||||||||||||||||||||||||||||||||||||||||||||||
As the response rate is very high (above 90%) or negligible, no bias is caused by unit non-response. |
||||||||||||||||||||||||||||||||||||||||||||||||||
| 13.3.3.2. Item non-response - rate | ||||||||||||||||||||||||||||||||||||||||||||||||||
There are no items with response rate below 90%. We don't treat item non-response. The data providers can't finalize the questionnaire if mandatory items aren't filled out. Only the filled out questionnaires can be sent through the electronic data collection system. |
||||||||||||||||||||||||||||||||||||||||||||||||||
| 13.3.3.2.1. Methods used for item non-response treatment | ||||||||||||||||||||||||||||||||||||||||||||||||||
|
||||||||||||||||||||||||||||||||||||||||||||||||||
| 13.3.3.2.2. Questions or items with item response rates below 90% and other comments | ||||||||||||||||||||||||||||||||||||||||||||||||||
Other comments relating to the item non-response
|
||||||||||||||||||||||||||||||||||||||||||||||||||
| 13.3.4. Processing error | ||||||||||||||||||||||||||||||||||||||||||||||||||
The unweighted imputation rate is 9.26%. It is a bit lower than last year, but higher than the years before due to the introduction of the statistical unit Enterprise. The target population includes enterprises which contain legal units with less than 10 employees, contrary to the previous years, where the sample only contained legal units with more than 10 employee. The response rate is usually lower for these small data providers, which requires more imputation to be applied. |
||||||||||||||||||||||||||||||||||||||||||||||||||
| 13.3.5. Model assumption error | ||||||||||||||||||||||||||||||||||||||||||||||||||
Not requested |
||||||||||||||||||||||||||||||||||||||||||||||||||
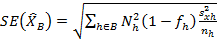
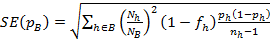
 Calculation of the standard error
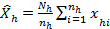


|
|||
| 14.1. Timeliness | |||
See detailed section below. |
|||
| 14.1.1. Time lag - first result | |||
Not applicable |
|||
| 14.1.2. Time lag - final result | |||
European level : Data are to be delivered to Eurostat in the fourth quarter of the reference year (due date for the finalised dataset is 5th October). European results are released before the end of the survey year or in the beginning of the year following the survey year (T=reference year, T+0 for indicators referring to the current year, T+1 months for other indicators referring to the previous year e.g. e-commerce). At national level :
Data are to be delivered to Eurostat in the fourth quarter of the reference year (due date for the finalised dataset is 5th October). European results are released before the end of the survey year or in the beginning of the year following the survey year (T=reference year, T+0 for indicators referring to the current year, T+1 months for other indicators referring to the previous year e.g. e-commerce).
2023 data will be released by the end of December 2023. E-commerce data will be released by the end of January (T+1)
|
|||
| 14.2. Punctuality | |||
See detailed section below. |
|||
| 14.2.1. Punctuality - delivery and publication | |||
First data transmission was in time, on the 29th of September 2023. |
|||
|
|||
| 15.1. Comparability - geographical | |||
The model questionnaire is generally used by the countries that conduct the survey on ICT usage and e-commerce in enterprises. Due to (small) differences in translation, in the used survey vehicle, in non-response treatment or different routing through the questionnaire, some results for some countries may be of reduced comparability. In these cases, notes are added in the data. Detailed information on differences in the wording of the questions in the national questionnaires is available in “ Annex I _ Completeness “ excel file - related to questionnaire, coverage, additional questions. Additional questions 1.1. Does your enterprise have access to the internet? 1.4. Please tick which type of fixed broadband did your enterprise used? 1.4.1. xDSL 1.4.2. Cable 1.4.3. FTTx (optical 1.8. How many mobile broadband subscriptions does your enterprise have? 1.8.1. Only one 1.8.2. More than one 1.11.7. Have your enterprise own webshop? 1.12. Does the Webshop have any of the following? 1.12.1. Description of goods or services, price lists 1.12.2. Possibility for visitors to customise or design online goods or services 1.12.3. Personalised content in the website for regular/recurrent visitors 1.12.4. Possibility for online payment 1.12.5. Tracking or status of orders placed 1.12.6. Possibility for automated call for proposal, calculation and order confirmation 1.18.1. During 2022, did your enterprise use the Internet for interaction with public authorities to obtain information from public authorities' websites or home pages 1.18.2.During 2022, did your enterprise use the Internet for interaction with public authorities to obtain forms from public authorities' websites or home pages 1.18.3. During 2022, did your enterprise use the Internet for interaction with public authorities to submit completed forms electronically 1.18.4.1. During 2022, did your enterprise use the Internet for interaction with public authorities to declare VAT completely electronically without the need for paper work 1.18.4.2. During 2022, did your enterprise use the Internet for interaction with public authorities to declare social contributions completely electronically without the need for paper work 1.19 During 2022, did your enterprise use the Internet in electronic procurement systems of public authorities: 1.19.1. for accessing tender documents and specifications 1.19.2. for offering goods or services in public authorities' electronic procurement systems (eTendering) 1.19.2.1 in Hungary 1.19.2.2. in other EU countries 2.7. During 2022, did your enterprise place orders for goods or services via a website, “apps”, or EDI-type messages? 2.8. During 2022, what was the value of the orders that your enterprise placed electronically of the total purchases' value 2.8.1. Less than 10% 2.8.2 At least 10% but less than 25% 2.8.3. At least 25% but less than 50% 2.8.4. At least 50% but less than 75% 2.8.5. At least 75% 3.1.2. Does your enterprise use CRM software? 7.5. How long did it take to fill these vacancies? 7.5.1.Within 0-3 months 7.5.2. Within 3-6 months 7.5.3. More than 6 months Data for specific set of variables were delivered on NUTS 2 regional level. There is no problem of comparability across the country’s regions. |
|||
| 15.1.1. Asymmetry for mirror flow statistics - coefficient | |||
Not applicable |
|||
| 15.2. Comparability - over time | |||
See section below. |
|||
| 15.2.1. Length of comparable time series | |||
The length of comparable time series depends on the module and the variable considered within each survey module. Additional information is available in annexes attached to the European metadata.
There was no changes in the survey from the previous year(s) that may have an impact on the comparability over time of the results. |
|||
| 15.3. Coherence - cross domain | |||
Not applicable |
|||
| 15.3.1. Coherence - sub annual and annual statistics | |||
Not applicable |
|||
| 15.3.2. Coherence - National Accounts | |||
Not applicable |
|||
| 15.4. Coherence - internal | |||
Not applicable |
|||
|
|||
| Restricted from publication | |||
|
|||
| 17.1. Data revision - policy | |||
The “Data revision policy of HCSO” is available on the HCSO's website, which is accessible through the following link: https://www.ksh.hu/docs/bemutatkozas/eng/ksh_revizios_politikaja_2018_eng.pdf |
|||
| 17.2. Data revision - practice | |||
The gross population and the gross sample were revised due to the changes in enterprise register. As the final version of enterprise register was available in June 2023. |
|||
| 17.2.1. Data revision - average size | |||
Not requested |
|||
|
||||||||||
| 18.1. Source data | ||||||||||
A) Frame population description and distribution For more information see concept 18.1.1.
B) Sampling design - Sampling method Description of the sampling method used (e.g. stratified random sample, quota sampling, cluster sampling; one-stage or two-stage sampling) and information which variables were used to stratify, the categories of those variables, in particular for the NACE Rev. 2 categories related to the "possible calculation of European aggregates", and the final number of strata:
Target population
The target population of the survey are operating enterprises with more than 10 persons employed and classified in the following economic categories of NACE Rev.2:
Enterprises of the target population are located in any part of the territory of the country. To specify the target population the Enterprise Register is used. The frame population for the next year is defined by having a snapshot of the Enterprise Register taken at the end of November. All these enterprises build up the frame of the survey, i.e. the sampling frame. The target population of the survey consists of working enterprises that classified in the above mentioned NACE categories and employed at least 10 people.
Sample selection
As of 2021, the sampling unit (enterprise) and observation unit (legal unit) are different. Since any sampling unit consists of one or more observation units, cluster sampling is used. In order to avoid under- or over estimation of qualitative variables (which are the most frequent in the data collection), it was decided to use one-stage cluster sampling i.e. all the legal units belong to the sampled enterprises are observed. The sample selection is done by using stratified sampling scheme. In case of enterprises with one unit the dimensions used for stratification are 1) NACE Rev.2. activity groups, 2) size of enterprises 3) regional breakdown. In case of enterprises with more than one unit the dimensions used for stratification are 1) NACE Rev.2. activity groups, 2) size of enterprises. The strata are formed in the following way:
NACE Rev. 2 division group/class 10-12 13-15 16-18 19 20 21 22-23 24-25 26 26.1-26.4, 26.8, and others 27 28 29-30 31-33 35 36-39 41-43 45 46 46.5, and others 47 49-53 55 56 58-60 58.2, and others 61 62 63 63.1, and others 68 69-71 72 73-75 77-78 79 80-82 95.1
2. Concerning the number of persons employed the following categories are being treated separately: Code No.‘30’ (10-19 persons employed), Code No. ‘40’ (20-49 persons employed), Code No. ‘50’ (50-99 persons employed), Code No. ‘61’ (100-149 persons employed), Code No. ‘62’ (150-199 persons employed), Code No. ‘70’ (200-249 persons employed), Code No. ‘81’ (250-299 persons employed), Code No. ‘82’ (300-499 persons employed), Code No. ‘91’ (500-999 persons employed), Code No. ‘93’ (1000-1999 persons employed), Code No. ‘94’ (2000-4999 persons employed), Code No. ‘95’ (5000- persons employed). For enterprises with more than one legal unit, the previously listed categories are grouped to four size classes. (S, M, L, and fully observed) 3. Regional dimension of strata construction will consist of the capital (Budapest) and the following 7 regions: Közép-Dunántúl, Nyugat-Dunántúl, Dél-Dunántúl, Észak-Magyarország, Észak-Alföld, Dél-Alföld, Pest megye.
The final sample size and the distribution of the sample among the above defined strata are determined by the well-known Neyman-type optimal allocation scheme, which is done according to the information available from previous years on stratum level statistics for the different variables. The sample of the survey is selected independently from other surveys, but the previous year’s sample is taken into account, i.e. rotation is applied. The principle of the rotation: the applied rotation rate is ~30%; enterprises that have been in the sample for the last three consecutive years should be rotated out; if an enterprise was rotated out in the previous year (i.e. it was out of the sample for a year), according to the HCSO’s policy, it should not be reselected to the sample for the next year. The sample size is determined in accordance with the given accuracy requirements, i.e. the standard error of the estimates for the concerned variables should not exceed 2 percentage points for the overall proportions and 5 percentage points for the proportions relating to subgroups. The standard error of the estimates is regularly checked, and if it exceeds the given threshold for a given subgroup, the sample sizes are reviewed and increased if necessary. C) Gross sample distribution More detailed information is available in “ Sample and standard error tables 2023 “ excel file (Worksheet: GROSS SAMPLE)
D) Net sample distribution More detailed information is available in “ Sample and standard error tables 2023 “ excel file (Worksheet: NET SAMPLE)
|
||||||||||
| 18.1.1. Population frame | ||||||||||
A) Description of frame population
B) Frame population distribution More detailed information is available in “ Sample and standard error tables 2023 “ excel file (Worksheet: FRAME POPULATION) |
||||||||||
| 18.2. Frequency of data collection | ||||||||||
Annual |
||||||||||
| 18.3. Data collection | ||||||||||
See detailed sections below. |
||||||||||
| 18.3.1. Survey period | ||||||||||
|
||||||||||
| 18.3.2. Survey vehicle – general survey | ||||||||||
| General survey - Stand-alone survey | ||||||||||
| 18.3.3. Survey vehicle – micro-enterprises | ||||||||||
| The collection of micro-enterprises was integrated with the general survey | ||||||||||
| 18.3.4. Survey type | ||||||||||
self-administered electronic survey The data collection on ICT usage and e-commerce in enterprises is a stand-alone, mandatory survey, and achieved electronically via ELEKTRA system. ELEKTRA enables data suppliers to submit data completely electronically through a web form. Validation rules are built in ELEKTRA itself, but there are more strict rules built in the data entry and validation system (ADÉL). In ADÉL system year to year comparisons can be made, and in case of outliers, the respondent enterprise is called to audit their data. |
||||||||||
| 18.3.5. Survey participation | ||||||||||
| Mandatory | ||||||||||
| 18.4. Data validation | ||||||||||
Hungary uses the server based EDIT validation provided by Eurostat. For eliminating errors in microdata, there are validation rules built in the data entry and processing system (e.g. year to year comparisons are made, and in case of outliers, the respondent enterprises are called to audit their data). There are also validation rules built in the data entry and processing system.
After grossing up and calculating the errors for the total population and its subgroups, those indicators are examined where the standard error for a given strata is high. The procedure is done in cooperation with the statistician and the methodology expert. The sample related to the reference year is compared with the sample related to the previous year. The case of outliers has to be examined.
We also make year-to-year comparison for the totals and subgroups, if there is huge increase or decrease that doesn’t fit to the regular trend of the different indicators we go into details and if it is necessary we examine the source data.
|
||||||||||
| 18.5. Data compilation | ||||||||||
Grossing-up procedures The treatment of non-response Unit non-response In case of unit non-response, imputation was used. As we collected data on the legal unit level, imputation was also carried out on legal unit level. The values of legal units that are supposed (according to their registered non-response codes) to have 0 values for all variables are imputed with 0-s. Those non-respondents whose data were not imputed by 0, will be treated in the following way. We randomly select a consistent donor legal unit from the imputation stratum of the non-respondent. The imputation strata are the combination of the given level NACE code (2 or 3 digits), size based on the number of employee and the geographical location of the legal unit on NUTS2 level (7 regions and Budapest). If there is no appropriate donor and the imputation stratum of the non-respondent legal unit does not belong to Budapest then we take a donor from the domain constructed by unifying the 7 regions excluding Budapest. (This domain consists of imputation strata with the same size category and NACE breakdown as the imputation stratum of the non-respondent.) If we can not find any appropriate donor or the non-respondent legal unit belongs to Budapest, we unify the size classes according to the number of persons employed into the following way: 0-9; 10-49; 50-249; and above 250, and the donor is selected from the unified strata. If there is still no appropriate donor in the unified domains, we merge the NACE codes to 1 digit level. After the imputation process the estimation procedure is executed. Item non-response In the case of background information (e.g. total turnover, number of persons employed) all data are imputed from enterprise register. Since 2013 with the introduction of the electronic survey and the built-in validation rules, the questionnaires cannot be finalized and sent in with item non-response. These methods are in line with the guidelines of the Methodological Manual.
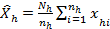
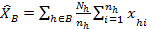
Grossing up procedure One-stage cluster sampling is exactly the same as simple random sampling with the aggregate of all observation units (legal units) in the cluster (enterprise) serving as an effective enumeration unit. Hence, the first step in the estimation phase is to transform the legal units’ answer so that it refers to the statistical unit enterprise. In case of quantitative variables (e.g. total turnover), we can get the enterprise’s value by simply summing the legal units’ answers. For qualitative variables (yes/no questions), we follow the Eurostat’s recommendations. First, we determine the value By the calculations we apply a correction factor If a strata is being fully observed, i.e. For the variables which are built up as the sum of some primarily observed variables we add up the estimated values of the underlying variables. If we unify some strata, the estimated value for the unified stratum is: The mean values of some primary and derived variables are estimated in the following way: and for the aggregated strata:
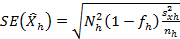
Variance estimation We determine the corrected empirical variance for the observed strata: The variance of the estimated population sum is determined by: This is the standard deviation. For the fully observed strata this is trivially For some unified strata: We determine the coefficient of variation
All the above presented formulas have a different form for the “yes-no” variables. If the frequency of the “Yes” answers for the population in stratum j is For the unified strata: For the standard deviation of the relative frequency we calculate and For the standard deviation of the frequency we have and Standard error is calculated for each stratum and for the overall strata. The population value and the estimated value may differ, because the estimated value is calculated from the selected sample, not from the whole population. From different samples different estimations can be made, thus mathematical tools are used to estimate the average amount of these differences. Macro-validation: After grossing up and calculating the errors, those indicators are examined where the standard error for a given strata is high. The procedure is done in cooperation with the statistician and the methodology expert. The sample related to the reference year is compared with the sample related to the previous year. The case of outliers has to be examined. |
||||||||||
| 18.5.1. Imputation - rate | ||||||||||
The values of enterprises that are supposed (according to their registered non-response codes) to have 0 values for all variables are imputed with 0-s.
Those non-respondents whose data were not imputed by 0, will be treated in the following way. We randomly select a consistent donor enterprise from the stratum of the non-respondent. If there is no appropriate donor and the stratum of the non-respondent enterprise does not belong to Budapest then we take a donor from the domain constructed by unifying the 7 regions excluding Budapest. (This domain consists of strata with the same size category and NACE breakdown as the stratum of the non-respondent.) If we cannot find any appropriate donor or the non-respondent enterprise belongs to Budapest, we unify the size classes according to the number of persons employed into the following way: 10-49; 50-249; and above 250, and the donor is selected from the unified strata. Unweighted imputation rate: 9.26%
|
||||||||||
| 18.6. Adjustment | ||||||||||
Not applicable |
||||||||||
| 18.6.1. Seasonal adjustment | ||||||||||
Not applicable |
||||||||||
 (Where j is the index of the individual stratum,
  is the number of the population units (enterprises) in stratum j and
  is the number of sampled enterprises.)
 which is equal to 1 if
  , otherwise we determine its value separately. The estimation of
  is being determined by the following formula:
  where is the sum of the sampled enterprises’ data in the given stratum.
 and thus
  then
then 


 and
and  for all the individual strata, and for the considered aggregates too. For the fully observed strata this value is trivially
 and the number of “Yes” answers in the sample is , then we first calculate the values:


 .
.
|
||||||||||
Problems encountered and lessons to be learnt: The gross population and the gross sample had to be revised due to the changes in enterprise register. As the final version of enterprise register will be available in June 2023. It is always a problem that some enterprises were included in the preliminary sample, and excluded in the final one or in one case some strata were not included in the gross population, but it should be according to the final one. So additional enterprises had to be included after the enterprise register is finalised. This makes the data collection more complicated. Enterprises had to send their data through an electronic survey system. In case of those enterprises that failed to meet the deadline, reminders were sent by email and later were reminded by phone. Due to the introduction of SUE, data collection cover legal units that normally out of scope (Small enterprises.) In those cases when an enterprise remains in the sample and their answers differ compared to the previous years the data collectors call the enterprise and ask them to verify their answer or to explain the changes. If it turns out that they misunderstood the question they should modify the answer and send back the questionnaire again.
|
||||||||||
| 19.1. Documents | ||||||||||
Annexes: Hungarian 2023 questionnaire Hungarian 2023 questionaire in English |
||||||||||
|
|||
|
|||
| Annex I._Completeness 2023 Annex II._ Accuracy 2023 Gross sample, frame population |
|||