


1.1. Contact organisation
LITHUANIAN DEPARTMENT OF STATISTICS
1.2. Contact organisation unit
Knowledge Economy and Special Survey Statistics Division
1.3. Contact name
Confidential because of GDPR
1.4. Contact person function
Confidential because of GDPR
1.5. Contact mail address
29 Gedimino Ave, LT-01500 Vilnius, Lithuania
1.6. Contact email address
Confidential because of GDPR
1.7. Contact phone number
Confidential because of GDPR
1.8. Contact fax number
Confidential because of GDPR
1 July 2021
2.1. Metadata last certified
31 October 2022
2.2. Metadata last posted
31 October 2022
2.3. Metadata last update
31 October 2022
3.1. Data description
The Community Innovation Survey (CIS) is a survey about innovation activities in enterprises. The survey is designed to collect the information on types of innovation, processes of development of innovation like cooperation patterns, financing and expenditure, objectives of innovation activities or barriers for initiating or implementing innovation.
The CIS provides statistics by type of innovators, economic activity and size class of enterprises. The survey is currently carried out every two years across the EU Member States, EFTA countries and EU candidate countries.
In order to ensure comparability across countries, Eurostat together with the countries develops a Harmonised Data Collection (HDC) questionnaire and drafts the methodological recommendations for implementation of each survey round.
CIS 2020 is a second in a row to implement concepts and methodology of the Oslo Manual 4th Edition revised in 2018. The changes in the CIS driven by the revision of the manual and their impact on collected indicators are described in the Statistics Explained article: Community Innovation Survey – new features.
The legal framework for CIS since 2012 is the Commission Regulation No 995/2012 that establishes the quality conditions for the data collection and transmission and identifies the obligatory cross-coverage of economic sectors, size class of enterprises and innovation indicators. The target population are enterprises with at least 10 employees classified in the core NACE economic sectors (see 3.3). Further activities may be covered on a voluntary basis in national datasets. Most statistics are based on the 3-year reference period (t, t-1, t-2), but some use only one calendar year (t or t-2). Please refer to the Annex section of the European metadata (ESMS) for details of the time coverage of collected indicators.
3.2. Classification system
Indicators related to the enterprises are classified by country, economic activity (NACE Rev. 2), size class of enterprises and type of innovation.
The main typology of classification of enterprises in reference to innovation is the distinction between innovation-active enterprises (INN) and not innovation-active enterprises (NINN).
The enterprise is considered as innovative (INN) if during the reference period it successfully introduced a a) product or a) business process innovation, c) completed but not yet implemented the innovation, d) had ongoing innovation activities, e) abandoned innovation activities or was f) engaged in in-house R&D or R&D contracted out. Non-innovative (NINN) enterprises had no innovation activity mentioned above whatsoever during the reference period.
3.3. Coverage - sector
CIS covers main economic sectors according to NACE Rev.2 broken down by size class of enterprises and type of innovation activity.
3.3.1. Main economic sectors covered - NACE Rev.2
In accordance with Commission Regulation 995/2012 on innovation statistics, the following industries and services are included in the core target population. Results are made available with these following breakdowns :
All NACE – Core NACE (NACE Rev. 2 sections & divisions B-C-D-E-46-H-J-K-71-72-73 )
CORE INDUSTRY (excluding construction) (NACE Rev. 2 SECTIONS B_C_D_E)
10-12: Manufacture of food products, beverages and tobacco
13-15: Manufacture of textiles, wearing apparel, leather and related products
16-18: Manufacture of wood, paper, printing and reproduction
20: Manufacture of chemicals and chemical products
21: Manufacture of basic pharmaceutical products and pharmaceutical preparations
19-22: Manufacture of petroleum, chemical, pharmaceutical, rubber and plastic products
23: Manufacture of other non-metallic mineral products
24: Manufacture of basic metals
25: Manufacture of fabricated metal products, except machinery and equipment
26: Manufacture of computer, electronic and optical products
25-30: Manufacture of fabricated metal products (except machinery and equipment), computer, electronic and optical products, electrical equipment, motor vehicles and other transport equipment
31-33: Manufacture of furniture; jewellery, musical instruments, toys; repair and installation of machinery and equipment
D: ELECTRICITY, GAS, STEAM AND AIR CONDITIONING SUPPLY
E: WATER SUPPLY; SEWERAGE, WASTE MANAGEMENT AND REMEDIATION ACTIVITIES
36: Water collection, treatment and supply
37-39: Sewerage, waste management, remediation activities
CORE SERVICES (NACE Rev. 2 sections & divisions 46-H-J-K-71-72-73)(NACE code in the tables = G46-M73_INN)
46: Wholesale trade, except of motor vehicles and motorcycles
H: TRANSPORTATION AND STORAGE
49-51: Land transport and transport via pipelines, water transport and air transport
52-53: Warehousing and support activities for transportation and postal and courier activities
J: INFORMATION AND COMMUNICATION
58: Publishing activities
61: Telecommunications
62: Computer programming, consultancy and related activities
63: Information service activities
K: FINANCIAL AND INSURANCE ACTIVITIES
64: Financial service activities, except insurance and pension funding
65: Insurance, reinsurance and pension funding, except compulsory social security
66: Activities auxiliary to financial services and insurance activities
M: PROFESSIONAL, SCIENTIFIC AND TECHNICAL ACTIVITIES
71: Architectural and engineering activities; technical testing and analysis
72: Scientific research and development
73: Advertising and market research
71-73: Architectural and engineering activities; technical testing and analysis; Scientific research and development; Advertising and market research
3.3.1.1. Main economic sectors covered - NACE Rev.2 - national particularities
No additional coverage.
3.3.2. Sector coverage - size class
In accordance with Commission Regulation 995/2012 on innovation statistics, the following size classes of enterprises according to number of employees are included in the core target population of the CIS:
- 10 - 49 employees
- 50 - 249 employees
- 250 or more employees
3.3.2.1. Sector coverage - size class - national particularities
No deviations.
3.4. Statistical concepts and definitions
The description of concepts, definitions and main statistical variables is available in CIS 2020 European metadata file (ESMS) Results of the community innovation survey 2020 (CIS2020) (inn_cis12) in Eurostat database.
3.5. Statistical unit
The statistical unit – the legal unit.
Legal unit – a conditional unit comprising legal persons whose existence is recognized by law, independently of the individuals or institutions that may manage or be members of them, and natural persons legally engaged in economic activities activities.
3.6. Statistical population
Core target population are all enterprises in CORE NACE activities (see 3.3.1) with 10 or more employees.
3.7. Reference area
Reference area – country.
Five main indicators – by regions, counties.
3.8. Coverage - Time
Several rounds of Community Innovation Survey have been conducted so far at two-year interval since end of 90’s.
3.8.1. Participation in the CIS waves
| CIS wave | Reference period | Participation | Comment (deviation from reference period) |
| CIS2 | 1994-1996 | - | The first CIS survey was about 1997-1998 innovations. |
| CIS3 | 1998-2000 | - | The second CIS survey was about 1998-2001 innovations. |
| CIS light | 2002-2003* | - | |
| CIS4 | 2002-2004 | X | |
| CIS2006 | 2004-2006 | X | |
| CIS2008 | 2006-2008 | X | |
| CIS2010 | 2008-2010 | X | |
| CIS2012 | 2010-2012 | X | |
| CIS2014 | 2012-2014 | X | |
| CIS2016 | 2014-2016 | X | |
| CIS2018 | 2016-2018 | X | |
| CIS2020 | 2018-2020 | X |
*two reference periods can be distinguished for CIS light: 2000-2002 and 2001-2003
3.9. Base period
Not relevant.
CIS indicators are available according to 3 units of measure:
NR: Number for number of enterprises and number of persons employed.
THS_EUR: Thousands of euros. All financial variables are provided in thousands of euros, i.e. Turnover or Innovation expenditure.
PC: Percentage. The percentage is the ratio between the selected combinations of indicators.
For CIS 2020, the time covered by the survey is the 3-year period from the beginning of 2018 to the end of 2020.
Some questions and indicators refer to one year — 2020.
The list of indicators covering the 3-year period and referring to one year according to the HDC is available in the Annex section of the European metadata (ESMS).
6.1. Institutional Mandate - legal acts and other agreements
CIS surveys are based on the Commission Regulation No 995/2012, implementing Decision No 1608/2003/EC of the European Parliament and of the Council on the production and development of Community statistics on science and technology.
This Regulation establishes innovation statistics on a statutory basis and makes the delivery of certain variables compulsory e.g. innovation activities, cooperation, development, expenditures and turnover (see the Regulation). Each survey wave may additionally include further variables.
In addition, the Regulation defines the obligatory cross-coverage of economic sectors and size class of enterprises.
6.1.1. National legislation
EU legislation and national Official statistics programme.
6.2. Institutional Mandate - data sharing
Not requested.
CIS data are transmitted to Eurostat via EDAMIS using the secured transmission system.
7.1. Confidentiality - policy
In the process of statistical data collection, processing and analysis and dissemination of statistical information, Statistics Lithuania fully guarantees the confidentiality of the data submitted by respondents (households, enterprises, institutions, organisations and other statistical units), as defined in the Confidentiality Policy Guidelines of Statistics Lithuania.
7.2. Confidentiality - data treatment
Statistical Disclosure Control Manual, approved by Order No DĮ-107 of 26 April 2022 of the Director General of Statistics Lithuania;
The State Data Governance Information System Data Security Regulations and Rules for the Secure Management of Electronic Information in the State Data Governance Information System, approved by Order No DĮ-202 of 27 August 2021 of the Director General of Statistics Lithuania.
By national policy on aggregated data confidentiality the minimum number of enterprises in breakdowns must to be 3 enterprises.
8.1. Release calendar
Statistical information is published following the Official Statistics Dissemination Policy Guidelines.
Statistical information is published on the Official Statistics Portal according to the Official Statistics Calendar.
8.2. Release calendar access
8.3. Release policy - user access
Statistical information is published following the Official Statistics Dissemination Policy Guidelines.
CIS is conducted and statistical information disseminated at two-year interval.
Accessibility and clarity refer to the simplicity and ease for users to access statistics using simple and user-friendly procedure, obtaining them in an expected form and within an acceptable time period, with the appropriate user information and assistance: a global context which finally enables them to make optimum use of the statistics.
10.1. Dissemination format - News release
See below.
10.1.1. Availability of the releases
| Dissemination and access | Availability | Comments, links, ... |
| Press release | X | 22 12 2021 Development of Innovation Activity (only on Lithuanian) |
| Access to public free of charge | X | Free of charge |
| Access to public restricted (membership/password/part of data provided, etc) | - |
10.2. Dissemination format - Publications
- Online database (containing all/most results) : All main results On-line database – Database of Indicators (free of charge).
- Analytical publication (referring to all/most results) : -
- Analytical publication (referring to specific results, e.g. only for one sector or one specific aspect) : Main indicators in publication Business in Lithuania – published on 8 December of 2022.
10.3. Dissemination format - online database
On-line database – Database of Indicators (Science and technology -> Innovation activities of enterprises)
10.3.1. Data tables - consultations
Not requested.
10.4. Dissemination format - microdata access
CIS microdata can be accessed in the Safe Centre (SC) at Eurostat's premises in Luxembourg.
10.4.1. Dissemination of microdata
| Mean of dissemination | Availability of microdata | Comments, links, ... |
| Eurostat SAFE centre | X | CIS microdata can be accessed in the Safe Centre (SC) at Eurostat's premises in Luxembourg. |
| National SAFE centre | - | |
| Eurostat: partially anonymised data (SUF) | - | |
| National : partially anonymised data | - |
10.5. Dissemination format - other
No other means of dissemination.
10.5.1. Metadata - consultations
Not requested.
10.6. Documentation on methodology
Methodological documents are published in the Official Statistics Portal section Innovation activites.
The survey meta-information post together with database. Meta-information Development of innovation activity is available from 26-03-22.
The process of the preparation of statistical information is described in the Innovative activity statistical survey methodology (only in Lithuanian).
10.6.1. Metadata completeness - rate
Not requested.
10.7. Quality management - documentation
Innovation data are popular among the users. Very often asked different information, which was not included into the publication or database.
The survey quality report – metadata – is produced and post together with database. Metadata Development of innovation activity is available from 26-03-22.
11.1. Quality assurance
Quality of statistical information and its production process is ensured by the provisions of the European Statistics Code of Practice and ESS Quality Assurance Framework.
In 2007, a quality management system, conforming to the requirements of the international quality management system standard ISO 9001, was introduced at Statistics Lithuania. The main trends in activity of Statistics Lithuania aimed at quality management and continuous development in the institution are established in the Quality Policy.
Monitoring of the quality indicators of statistical processes and their results and self-evaluation of statistical survey managers is regularly carried out in order to identify areas which need improvement and to promptly eliminate shortcomings.
More information on assurance of quality of statistical information and its preparation is published in the Quality Management section on the Statistics Lithuania website.
11.2. Quality management - assessment
The survey response rate was 100 per cent. The survey are mandatory and only fully completed e-questionnaires are accepted. Respondents must answer to all questions, which are necessary to answer for them. Electronic survey is with strict validation rules.
Data for the survey were collected at regional statistical offices. The specialists of these offices were responsible for statistical data collection, sending reminders to the respondents, consulting them, checking and correction by the protocols of logical errors. The entry errors were detected both by manual comparisons and during running logical controls. But their number was relatively small. Logical errors were eliminated by the contacting with respondents.
After data collection the quality of the obtained information was analyzed. The results of the calculation was compared with the results of the previous year, the corresponding indicators of other statistical surveys and administrative sources. Outstanding values of indicators was identified and analyzed. In the event of significant deviations, the data provider shall be contacted and the reasons for the deviation explained.
Verification of data according to additional control conditions, determination of exceptions of quantitative indicators, comparison of the data set with the data of the previous period, inaccuracies, trends of changes were performed. In case of deviations, the reasons for them were explained and, if necessary, the respondents contacted. Data were corrected if inaccuracies were identified.
The weaknesses were in the data collection. Often enterprises accounting departments completed questionnaires with a less knowledge about innovation, R&D and management. By them, the innovation is invention of absolutely a new product but not it‘s improvement.
The coefficient of variation for the percentage of innovative enterprises are good. Data calculated with the possibly accuracy.
Relevance is the degree to which statistics meet current and potential users’ needs. It includes the production of all needed statistics and the extent to which concepts used (definitions, classifications etc.) reflect user needs. The aim is to describe the extent to which the statistics are useful to, and used by, the broadest array of users. For this purpose, statisticians need to compile information, firstly about their users and their needs.
The CIS is based on a common questionnaire and a common survey methodology in order to achieve comparable, harmonised and high quality results for EU Member States, EFTA countries, Candidates and Associated countries.
12.1. Relevance - User Needs
The main users of statistical information are State authorities and agencies, international organisations, the media, research and business communities, students, whose needs are satisfied without a breach of the confidentiality principle.
The national questionnaire was harmonised with the national public institutions (Ministry of the Economy and Innovation, Ministry Education, Science and Sport, Research and Higher Education Monitoring and Analysis Centre, Lithuanian Innovation Centre).
User satisfaction in Statistics Lithuania:
From 2005, general user opinion surveys have been conducted on a regular basis. Official Statistics Portal traffic is monitored, website visitor opinion polls, general opinion poll on the products and services of Statistics Lithuania, target user group opinion polls and other surveys are conducted. In 2007, the compilation of a user satisfaction index was launched. The said surveys are aimed at the assessment of the overall demand for and necessity of statistical information in general and specific statistical indicators in particular.
More information on user surveys and their results is available in section User surveys on the Statistics Lithuania website.
The main users of statistical information are State authorities and agencies, international organisations, the media, research and business communities, students, whose needs are satisfied without a breach of the confidentiality principle.
12.1.1. Needs at national level
| User group | Short description of user group | Main needs for CIS data of the user group Users’ needs |
| 1. Institutions - European level | Eurostat | To produce innovation STI statistics and make microdata available for research |
| 1. Institutions - International organisations | OECD | To produce innovation STI statistics for OECD Science, Technology and Industry Scoreboard |
| 1. Institutions - National level | Ministry of Economy, Ministry of Education and Science | Data used for the market analysis and format innovation policy |
| 1. Institutions - National level | Statistics Lithuania | To produce STI statistics |
| 1. Institutions - National level | Innovation centre | Data used for the own market analysis, their marketing strategy, they offer consultancy services |
| 3 - Media | National media: TV, newspapers | Data used to comment the situation to public |
| 4 - Researchers and students | Universities, students etc | Data used for the science works, analysis |
| 5 - Enterprises or businesses | Data used for the own market analysis, their marketing strategy |
12.2. Relevance - User Satisfaction
User satisfaction survey related to CIS data was not carry out.
12.3. Completeness
No derogations. Respondents must to answer to all necessary questions.
12.3.1. Data completeness - rate
Not requested.
13.1. Accuracy - overall
Accuracy in the statistical sense denotes the closeness of computations or estimates to the exact or true values. Statistics are not equal with the true values because of variability (the statistics change from implementation to implementation of the survey due to random effects) and bias (the average of the possible values of the statistics from implementation to implementation is not equal to the true value due to systematic effects).
13.2. Sampling error
That part of the difference between a population value and an estimate thereof, derived from a random sample, which is due to the fact that only a subset of the population is enumerated.
13.2.1. Sampling error - indicators
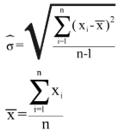
The main indicator used to measure sampling errors for CIS data is the coefficient of variation (CV).
Coefficient of Variation= (Square root of the estimate of the sampling variance) / (Estimated value)
Formula:
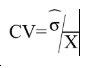
where
13.2.1.1. Coefficient of variations for key variables
Coefficient of variation (%) for key variables by NACE categories and for enterprises with 10 and more employees
| NACE |
Size class |
(1) |
(2) |
(3) |
| Core NACE (B-C-D-E-46-H-J-K-71-72-73) |
Total |
2.2 |
3.4 |
3.7 |
| Core industry (B_C_D_E - excluding construction) |
Total |
2.6 |
2 |
4.7 |
| Core Services (46-H-J-K-71-72-73) |
Total |
3.3 |
6.9 |
5.3 |
[1] = Coefficient of variation for the percentage of innovative enterprises (INN) in the total population of enterprises (ENT20)
[2] = Coefficient of variation for the turnover of product innovative enterprises with new or improved products (TUR_PRD_NEW_MKT), as a percentage of total turnover of product innovative enterprises [TUR20,INNO_PRD].
[3] = Coefficient of variation for percentage of product and/or process innovative enterprises (incl. enterprises with abandoned and or on-going activities) involved in any innovation co-operation arrangement [COOP_ALL,INN], as a percentage of innovative enterprises (INN).
13.2.1.2. Variance estimation method
The variance estimator of the direct population total estimator (or the Horvitz-Thomson) was used.
13.3. Non-sampling error
Non-sampling errors occur in all phases of a survey. They add to the sampling errors (if present) and contribute to decreasing overall accuracy. It is important to assess their relative weight in the total error and devote appropriate resources for their control and assessment.
13.3.1. Coverage error
Coverage errors (or frame errors) are due to divergences between the target population and the frame population. The frame population is the set of target population members that has a chance to be selected into the survey sample. It is a listing of all items in the population from which the sample is drawn that contains contact details as well as sufficient information to perform stratification and sampling.
13.3.1.1. Over-coverage - rate
Not requested.
13.3.1.2. Common units - proportion
Not requested.
13.3.1.3. Under covered groups of the target population
There were some divergences between the target population and the frame population due of economically not active enterprises. These errors were estimated according to the sample design.
13.3.1.4. Coverage errors in coefficient variation
The information is not available.
13.3.2. Measurement error
Measurement errors occur during data collection and generate bias by recording values different than the true ones. The survey questionnaire used for data collection may have led to the recording of wrong values, or there may be respondent or interviewer bias.
13.3.2.1. Measures for reducing measurement errors
There are no measures.
13.3.3. Non response error
Non response occurs when a survey fails to collect data on all survey variables from all the population units designated for data collection in a sample or complete enumeration.
There are two types of non-response:
1) Unit non-response, which occurs when no data (or so little as to be unusable) are collected about a population unit designated for data collection.
a) Un-weighted unit non-response rate (%) = 100*(Number of units with no response or not usable response) / (Total number of in-scope (eligible) units in the sample)
b) Weighted unit non-response rate (%) = 100*(Number of weighted units with no response or not usable response) / (Total number of in-scope (eligible) units in the sample)
2) Item non-response, which occurs when only data on some, but not all survey data items are collected about a population unit designated for data collection.
a) Un-weighted item non-response rate (%) = 100*(Number of units with no response at all for the item) / (Total number of eligible, for the item, units in the sample i.e. filters have to be taken into account)
The survey was carried out mandatory. The unit non-response rate stood at 1 percent.
Respondents must answer to all necessary questions. Electronic survey was with strict validation rules.
There was no item non-response. No imputation done
13.3.3.1. Unit non-response - rate
See below.
13.3.3.1.1. Un-weighted and weighted unit non-response rate by NACE categories and for enterprises with 10 or more employed persons
Un-weighted and weighted unit non-response rate by NACE categories and for enterprises with 10 or more employees
| NACE | Number of eligible units with no response | Total number of eligible units in the sample | Un-weighted unit non-response rate (%) | Weighted unit non-response rate (%) |
| Core NACE (B-C-D-E-46-H-J-K-71-72-73) | 0 | 2276 | 0 | 0 |
| Core industry (B_C_D_E - excluding construction) | 0 | 1094 | 0 | 0 |
| Core Services (46-H-J-K-71-72-73) | 0 | 1182 | 0 | 0 |
The number of eligible units is the number of sample units, which indeed belong to the target population.
13.3.3.1.2. Maximum number of recalls/reminders before coding
2 automatic reminders (3 days to deadline and 1 day after) were sent via the e-system. Then specialists of the Regional Statistical Offices sent / maked a call on average 3 times to enterprises before enterprises were coded as non-responding.
13.3.3.2. Item non-response - rate
See below.
13.3.3.2.1. Item non-response rate for Turnover (in Core NACE: B-C-D-E-46-H-J-K-71-72-73 enterprises with 10 or more employed persons)
Item non-response rate for Turnover (in Core NACE: B-C-D-E-46-H-J-K-71-72-73 enterprises with 10 or more employees).
| Item non-response rate (un-weighted) | Imputation | If imputed, describe method used, mentioning which auxiliary information or stratification is used | |
| Turnover | 0 |
There was no item non-response. No imputation done
13.3.3.2.2. Item non response rate for new questions
Item non-response rate for new questions in CIS t (in Core NACE: B-C-D-E-46-H-J-K-71-72-73 enterprises with 10 or more employees)
| NEW QUESTIONS IN CIS 2020 | Inclusion in national questionnaire | Item non response rate (un-weighted) | Comments |
| 2.2 Market conditions faced by enterprise | X | 0 | |
| 2.8 Factors related to climate change | X | 0 | |
| 3.16 Innovations with environmental benefits | X | 0 | |
| 3.17 Factors driving environmental innovations | X | 0 |
13.3.4. Processing error
The number of processing errors was relatively small. Logical errors were eliminated by the contacting with respondents. For logical inconsistencies about 7% of respondents were contacted.
13.3.5. Model assumption error
Not requested.
Timeliness and punctuality refer to time and dates, but in a different manner.
14.1. Timeliness
The timeliness of statistics reflects the length of time between data availability and the event or phenomenon they describe.
14.1.1. Time lag - first result
Timeliness of national data – date of first release of national level : 22-12-2021
14.1.2. Time lag - final result
Not requested.
14.2. Punctuality
Punctuality refers to the time lag between the release date of data and the target date on which they were scheduled for release as announced officially.
14.2.1. Punctuality - delivery and publication
Date of transmission of complete and validated data to Eurostat (Number of days between that data and 30 June 2022) : 29 June 2022 (1 day).
Comparability aims at measuring the impact of differences in applied statistical concepts and definitions on the comparison of statistics between geographical areas, non-geographical domains, or over time.
The coherence of statistical outputs refers to the degree to which the statistical processes by which they were generated used the same concepts (classifications, definitions, and target populations) and harmonised methods. Coherent statistical outputs have the potential to be validly combined and used jointly.
15.1. Comparability - geographical
Statistical data are comparable among the regions, counties of Lithuania and among EU countries.
15.1.1. Asymmetry for mirror flow statistics - coefficient
Not requested.
15.1.2. National questionnaire – compliance with Eurostat model questionnaire
Methodological deviations from the CIS Harmonised Data Collection (HDC)
| Questions not included in national questionnaire compared to HDC | Comment |
| 2.4 – 2.6 Used patents and IRPs | In order to reduce the burden on respondents, Lithuania did not include some voluntary questions (from HDC) in the national questionnaire |
| 4.1 What was the average number of persons employed by your enterprise in 2018 and 2020? | In order to reduce the burden on respondents, Lithuania did not include some voluntary questions (from HDC) in the national questionnaire |
| 4.2 Approximately what percentage of the persons employed in your enterprise in 2020 had a tertiary degree? (degree of novelty – Low) |
In order to reduce the burden on respondents, Lithuania did not include some voluntary questions (from HDC) in the national questionnaire |
| 4.3 What was your enterprise’s total turnover in 2018 and 2020? |
For information on turnover, structural Business statistics survey data are used. |
| 4.5 Age of enterprise | For information on age of enterprise, business Statistical Business Register data are used. |
| 4.6 Total expenditure in 2020 | In order to reduce the burden on respondents, Lithuania did not include some voluntary questions (from HDC) in the national questionnaire |
| 4.7 In 2020, was your enterprise part of enterprise group | For information on age of enterprise, business Statistical Business Register data are used. |
| 4.8 Enterprise group: inflows and outflows | In order to reduce the burden on respondents, Lithuania did not include some voluntary questions (from HDC) in the national questionnaire |
| Changes in the filtering compared to HDC | Comment |
| No deviations. |
15.1.3. National questionnaire – additional questions
Methodological deviations from the CIS Harmonised Data Collection (HDC)
| Additional questions in national questionnaire (not included in HDC) | Comment |
| 1 additional question was included in the national questionnaire (in the section Basic information on your enterprise). |
15.2. Comparability - over time
Due to important methodological changes driven by Oslo Manual 2018, CIS 2018 and CIS 2020 cannot be directly compared with previous CIS waves.
15.2.1. Length of comparable time series
Not requested.
15.3. Coherence - cross domain
See the comparison between SBS and CIS data in the section 15.3.3 below.
15.3.1. Coherence - sub annual and annual statistics
Not requested.
15.3.2. Coherence - National Accounts
Not requested.
15.3.3. Coherence – Structural Business Statistics (SBS)
This part compares key variables for aggregated CIS data with SBS data
Definition of relative difference between CIS and SBS data: DIFF = (SBS/CIS)*100
Comparison between SBS and CIS data (relative difference) by NACE categories and for enterprises with 10 or more employees
| NACE | Size class | Number of enterprises (SBS/CIS)* | Number of employees (SBS/CIS)* | Total Turnover (SBS/CIS)* |
| Core NACE (B-C-D-E-46-H-J-K-71-72-73) | Total | 99.6 | 95.6 | 98.7 |
| Core industry (B_C_D_E - excluding construction) | Total | 102.4 | 100.5 | 101 |
| Core Services (46-H-J-K-71-72-73) | Total | 97.5 | 91.1 | 97.1 |
* Numbers are to be provided for the last year of the reference period (t)
15.4. Coherence - internal
Not requested.
Confidential information on the production cost of the CIS.
16.1. Cost
The assessment of costs associated with a statistical product is a rather complicated task since there must exist a mechanism for appointing portions of shared costs (for instance the business register or shared IT resources and dissemination channels) and overheads (office space, utility bills etc). The assessment must become detailed and clear enough so that international comparisons among agencies of different structures are feasible.
For measuring the cost on statistical offices, Eurostat proposes to make use of the following very short calculation, even if Eurostat is aware of the fact that such a measure may be complicated.
| Costs for the statistical authority | In thousands of national currency |
| Total cost (in thousand currency units) | 114,6 |
| Staff cost (in %) | 100 |
| Other direct cost (in %) | - |
| Overheads (in %) | - |
National currency used for this amount: Euros
17.1. Data revision - policy
The revision policy applied by Statistics Lithuania is described in the Description of Procedure for Performance, Analysis and Publication of Revisions of Statistical Information.
17.2. Data revision - practice
Not requested.
17.2.1. Data revision - average size
Not requested.
18.1. Source data
See below:
18.1.1. Sampling frame (or census frame)
The source of the frame - the Statistical Business Register.
18.1.2. Sampling design
In accordance with section 2 of the annex of the Commission Regulation on Community statistics on innovation, enterprises in the NACE Rev. 2 sections B, C, D, E, H, J, K and in the NACE Rev. 2 divisions 46 and divisions 71, 72 and 73 are covered.
The official up-to-date statistical Business Register of the country was used as a sampling frame. The target population were stratified into similar groups; the characteristics for the breakdown were: economic activities (in accordance with NACE Rev. 2) at least at a 2-digit level and enterprise size according to the number persons of employed (10–49, 50–249, 250+, excluding enterprises with 0-9 persons of employed).
The enterprises with 10-49 and 50-249 persons of employed are covered by sampling.
The enterprises size class (250+) persons of employed are covered by complete enumeration.
Within every NACE Rev 2 group the strata of enterprises were formed by number of persons employed groups. If in the strata are 7 or less enterprises, they are all involved in the statistical survey. The Neyman optimal allocation (with variable number of persons employed) was used for determination of the sample size for each stratum specified.
In each stratum simple random sampling was used. The final number of strata was 161.
The sample was designed with no reference to other surveys. Sample rate is 29.9 per cent of the population.
18.1.3. Target population and sample size
| Sample/census indicator | Number of enterprises |
| Target population | 7626 |
| Sample | 2295 |
| In case of combination sample/census: | |
| Sampled units | 2009 |
| Enumerated units/census | 286 |
| Overall sample rate (overall sample/target population) | 29.9 |
Gross sample – 2295. Net sample – 2276. Number of units with a response in the realised sample – 2276.
18.1.4. Data source for pre-filled variables
Variables and indicators filled or prefilled from other sources.
| Variables/Indicators | Source | Reference year |
| Turnover | Main sourse – Structural business statistics (SBS) survey. | 2020 |
| Number of employed | Structural business statistics (SBS) survey data and administrative data sources (State Social Insurance Fund Board (Sodra) | 2020 |
| Age of enterprise | The Statistical Business Register | 2020 |
| Belonging to an enterprise group | The Statistical Business Register | 2020 |
18.1.5. Data source and variables used for derivation and weighting
| Item | Response |
| Data source used for deriving population totals | Any auxiliary data source unused for deriving population totals. |
| Variables used for weighting | The variables used for weighting were the same as for stratification, i. e. the economic activities and enterprise size according to the number of employees. |
18.2. Frequency of data collection
According to the Commission Regulation (UE) 995/2012, the innovation statistics shall be provided to Eurostat every two years in each even year t+18.
18.3. Data collection
For data collection, electronic questionnaires with a possibility to fill online or print and fill in a paper version were used. Data for the survey were collected at regional statistical offices. The specialists of these offices were responsible for statistical data collection, sending reminders to the respondents, consulting them, micro data editing, checking and correction by the protocols of logical errors.
Data entry together with data quality control was done using software specially designed for that purpose (on the basis of Oracle). It was prepared by ICT specialist of Statistics Lithuania. Data from electronic questionnaires are loaded automatically, papers questionnaires are entered by specialists of regional offices. After the data entry, checking and correction, the results were validated, the non-response rate was calculated and the grossing-up of the data was done.
18.3.1. Survey participation
The survey was carried out mandatory, it was included in the Official statistical programme.
18.3.2. Survey type
The survey type – combination census/sample survey.
18.3.3. Combination of sample survey and census data
The enterprises with 10-49 and 50-249 employed are covered by sampling.
The enterprises size class (250+) employed are covered by complete enumeration.
18.3.4. Census criteria
The enterprises size class (250+) employed are covered by complete enumeration.
18.3.5. Data collection method
Data collection method
| Survey method | Yes/No | Comment |
|---|---|---|
| Face-to-face interview | ||
| Telephone interview | ||
| Postal questionnaire | No |
|
| Electronic questionnaire (format Word or PDF to send back by email) | Yes | |
| Web survey (online survey available on the platform via URL) | Yes | |
| Other |
18.4. Data validation
Not requested.
18.5. Data compilation
Operations performed on data to derive new information according to a given set of rules.
Estimates of statistical indicators in the assessment areas and whole population are calculated using the Horvitz-Thompson estimate for stratified samples.
Enterprises which refused to participate in the survey, weight conversion is performed.
18.5.1. Imputation - rate
Imputation is the method of creating plausible (but artificial) substitute values for all those missing.
Definition of imputation rate:
Imputation rate (for the variable x) (%) = 100*(Number of replaced values) / (Total number of values for a given variable)
Definition of weighted imputation rate:
Weighted imputation rate= 100*(Number of total weighted replaced values) / (Total number of weighted values for a given variable)
18.5.1.1. Imputation rate for metric variables
Imputation rate for metric variables by NACE categories and for enterprises with 10 or more employees:
| NACE | Size class | Total Turnover (1) | Turnover from products new to the market (2) | R&D expenditure in-house (3) | |||
| Unweighted | Weighted | Unweighted | Weighted | Unweighted | Weighted | ||
| Core NACE (B-C-D-E-46-H-J-K-71-72-73) | Total | 0 | 0 | 0 | 0 | 0 | 0 |
| Core industry (B_C_D_E - excluding construction) | Total | 0 | 0 | 0 | 0 | 0 | 0 |
| Core Services (46-H-J-K-71-72-73) | Total | 0 | 0 | 0 | 0 | 0 | 0 |
(1) = Total turnover in the last year of the reference period (t) (TUR)
(2) = Share of the turnover in the last year of the reference period (t) due to new or improved product new to the market in the total turnover for product innovative enterprises TUR_PRD_NEW_MKT/TUR(INNO_PRD)
(3) = R&D expenditure performed in-house (EXP_INNO_RND_IH)
18.5.2. Weights calculation
Weights calculation method for sample surveys
| Method | Selected applied method | Comments |
| Inverse sampling fraction | - | |
| Non-respondent adjustments | Economically non active enterprises was excluded from target population. | |
| Other | All results were weighted against the total population by means of sample weights. The weights were established by using the probability of each enterprise to be included in the sample. The primary strata were not changed and the primary weights were used for actual estimation domains. |
18.6. Adjustment
The calibration method was not used.
18.6.1. Seasonal adjustment
Not requested.
The Community Innovation Survey (CIS) is a survey about innovation activities in enterprises. The survey is designed to collect the information on types of innovation, processes of development of innovation like cooperation patterns, financing and expenditure, objectives of innovation activities or barriers for initiating or implementing innovation.
The CIS provides statistics by type of innovators, economic activity and size class of enterprises. The survey is currently carried out every two years across the EU Member States, EFTA countries and EU candidate countries.
In order to ensure comparability across countries, Eurostat together with the countries develops a Harmonised Data Collection (HDC) questionnaire and drafts the methodological recommendations for implementation of each survey round.
CIS 2020 is a second in a row to implement concepts and methodology of the Oslo Manual 4th Edition revised in 2018. The changes in the CIS driven by the revision of the manual and their impact on collected indicators are described in the Statistics Explained article: Community Innovation Survey – new features.
The legal framework for CIS since 2012 is the Commission Regulation No 995/2012 that establishes the quality conditions for the data collection and transmission and identifies the obligatory cross-coverage of economic sectors, size class of enterprises and innovation indicators. The target population are enterprises with at least 10 employees classified in the core NACE economic sectors (see 3.3). Further activities may be covered on a voluntary basis in national datasets. Most statistics are based on the 3-year reference period (t, t-1, t-2), but some use only one calendar year (t or t-2). Please refer to the Annex section of the European metadata (ESMS) for details of the time coverage of collected indicators.
31 October 2022
The description of concepts, definitions and main statistical variables is available in CIS 2020 European metadata file (ESMS) Results of the community innovation survey 2020 (CIS2020) (inn_cis12) in Eurostat database.
The statistical unit – the legal unit.
Legal unit – a conditional unit comprising legal persons whose existence is recognized by law, independently of the individuals or institutions that may manage or be members of them, and natural persons legally engaged in economic activities activities.
Core target population are all enterprises in CORE NACE activities (see 3.3.1) with 10 or more employees.
Reference area – country.
Five main indicators – by regions, counties.
For CIS 2020, the time covered by the survey is the 3-year period from the beginning of 2018 to the end of 2020.
Some questions and indicators refer to one year — 2020.
The list of indicators covering the 3-year period and referring to one year according to the HDC is available in the Annex section of the European metadata (ESMS).
Accuracy in the statistical sense denotes the closeness of computations or estimates to the exact or true values. Statistics are not equal with the true values because of variability (the statistics change from implementation to implementation of the survey due to random effects) and bias (the average of the possible values of the statistics from implementation to implementation is not equal to the true value due to systematic effects).
CIS indicators are available according to 3 units of measure:
NR: Number for number of enterprises and number of persons employed.
THS_EUR: Thousands of euros. All financial variables are provided in thousands of euros, i.e. Turnover or Innovation expenditure.
PC: Percentage. The percentage is the ratio between the selected combinations of indicators.
Operations performed on data to derive new information according to a given set of rules.
Estimates of statistical indicators in the assessment areas and whole population are calculated using the Horvitz-Thompson estimate for stratified samples.
Enterprises which refused to participate in the survey, weight conversion is performed.
See below:
CIS is conducted and statistical information disseminated at two-year interval.
The timeliness of statistics reflects the length of time between data availability and the event or phenomenon they describe.
Statistical data are comparable among the regions, counties of Lithuania and among EU countries.
Due to important methodological changes driven by Oslo Manual 2018, CIS 2018 and CIS 2020 cannot be directly compared with previous CIS waves.
