|
 |
|
| For any question on data and metadata, please contact: Eurostat user support |
|
|||
| 1.1. Contact organisation | Swedish Environmental Protection Agency |
||
| 1.2. Contact organisation unit | Environmental and Waste Analysis Unit |
||
| 1.5. Contact mail address | |||
|
|||
| 2.1. Data description | |||
See section 3.1 |
|||
| 2.2. Classification system | |||
See section 8.1 |
|||
| 2.3. Coverage - sector | |||
See section 6. Accuracy and reliability. |
|||
| 2.4. Statistical concepts and definitions | |||
See section 6. Accuracy and reliability. |
|||
| 2.5. Statistical unit | |||
See section 6. Accuracy and reliability and annex 2 |
|||
| 2.6. Statistical population | |||
See section 6. Accuracy and reliability. |
|||
| 2.7. Reference area | |||
Sweden |
|||
| 2.8. Coverage - Time | |||
Reference year 2020, for comparability over time see section 8.2 |
|||
| 2.9. Base period | |||
NA |
|||
|
||||||||||||||||||||||||||||||||||||||||||||||
| 3.1. Source data | ||||||||||||||||||||||||||||||||||||||||||||||
12.1.1 Institutions involved and distribution of tasks Table 1 shows the institutions involved and distribution of tasks within WStatR2022. Table 1. Institutions involved and distribution of tasks.
In preparation for the current reporting, the work has been organised as in Figure 1. Figure 1. Description of the parties involved for data collection, processing and presentation.
General description of which methods are used in which part of the data set Data set 1: Waste generation by waste category (EWC-Stat) and economic activities (NACE) General description of methodology Several methods have been combined to collect data. When selecting methods, a starting-point has been to prioritise good quality of statistics for flows of hazardous waste and large flows of waste that have been associated with environmental or resource issues. Another starting point has been to reduce the burden of respondents. Data on waste generation and waste treatment has as far as possible been checked against other administrative data and other sources, e.g. Avfall Sverige (Waste Management Sweden), trade organisations, earlier surveys and other international reporting, such as packaging waste, ELV, dredging spoils, etc. In the survey, environmental reports were used as a data source. The environmental report is a legal requirement, and it is one of the instruments that the authorities can make use of in order to inspect an environmentally hazardous activity. The information in the environmental report is expected to be of high quality and does not increase the burden of respondents. In addition to environmental reports web surveys are used for facilities in the manufacturing industries (NACE C that lack mandatory reporting to the Swedish Portal for Environmental Reporting (SMP (environmental reports)).
Table 12, Annex 1, gives an overview of the methodologies used to collect waste statistics. It should be emphasized that there are usually several methods used in each industry or sector. For example a web survey can be the main method, but model calculations are used for small enterprises (less than 10 employees). Some NACE sectors may also consist of several sub sectors, where different methods have been used for different sub sectors. The methods indicated in Table 12, Annex 1 are the major methods used. Determination of waste generation in the economy on the basis of information on waste collection Information from waste collection has not been used. Determination of waste generation in the economy on the basis of administrative sources Environmental reports The most common administrative source in the WStatR-production work for Sweden is environmental reports. Statistics from different industries are based on the register of environmentally hazardous activities in The Swedish Emission Reporting Portal (SMP). It is operated by the county administrative boards and the Swedish environmental protection agency. It covers facilities with permits for environmentally harmful operations according to the Environmental Code. Facilities with permits for treatment of waste were selected from this database. Information on generation and treatment of waste was extracted manually from the text reports and registered in the WStatR production database. Obvious coding- and unit errors were corrected.
Facilities with permits for waste treatment have to make a separate report for received construction and demolition wastes (wastes according to chapter 17 in the list of waste). These separates reports include LoW codes for waste, treatment method (R- and D-code according to the Annex I and Annex II in the waste framework directive), and secondary wastes aroused during sorting, mechanical treatment and other pre-treatment.
Hazardous Waste Register Hazardous Waste in NACE G-U excl. G46.77 is from WStatR 2022 collected from the hazardous waste-register (Avfallsregistret) managed by the Swedish Environmental protection agency. Businesses that generate hazardous waste should report to the register. End-of-Life-Vehicle Statistics Sweden and the Swedish Agency for Transport Policy Analysis publish statistics about registration of vehicles, including private cars, lorries, cars, buses, trailers, semi-trailers, caravans, motorbikes, mopeds class 1, tractors and snowmobiles. In addition, the organisation registration number (VAT number) of the owner, in the case of private car the birth registration number, is registered as well as the kerb weight of each vehicle. All changes in the ownership, as well as deregistering, are reported to the register continuously. A search in the register was made to extract all information about all deregistered vehicles, including organisation registration number of the last owner and the kerb weight that were deregistered during 2020. It was assumed that the main reason for deregistering is that the deregistered cars have been handed over to an authorised car dismantling facility[1]. There may be some exceptional reasons for deregistering, e.g. export of private car, or sole use of the car on private property, but we have judged these occurrences negligible. The organisation registration number was linked and matched with the business register. In this way, the weight of deregistered vehicles for each NACE was obtained, including households for vehicles owned by private persons. Data sets 2 and 3: Waste treatment, general description of methodologyWaste treatment occurs in several economic sectors. The waste treatment in all sectors has been covered in a coordinated survey. The survey included facilities registered as waste treatment plants in the register of environmentally hazardous activities. In addition, industrial facilities with treatment of waste are included in the register. Environmental reports were used as data sources. Identification of relevant treatment facilities The registers used for identification of waste treatment plants are presented in Table 2. The register of environmentally hazardous activities is used as the main frame. The other registers have been used to check the completeness.
Table 2. Registers used for identification of waste treatment operations.
The waste treatment facilities were identified by their activity code in the register of environmental hazardous waste activities. Both primary codes and secondary codes were assessed. All facilities with incineration, landfilling and biological treatment of more than 50 tonnes per year are in the register as well as other treatment facilities for sorting, mechanical treatment and so on. Treatment facilities for household waste were also identified by information from the trade organisation Avfall Sverige (Waste Management Sweden), see Table 2.
Some types of waste are legally used as fuel in industrial or energy facilities or used as raw materials in manufacturing processes without waste treatment permits. These facilities cannot be identified by their activity code. Most of them have been identified in earlier surveys or in connection with the waste generation surveys, but there may be a few facilities that are not included.
From the registers 1959 facilities with potential waste treatment were identified. This includes 1 639 waste treatment facilities (in NACE E38 and E46.77) and 320 industry facilities that also treat waste. Pre-treatment plants and sorting plants were included in this figure. The register also contained some non-active facilities, for example older facilities that have closed down but still were registered, or new facilities with new permits or licenses that still were in the planning or construction stage.
The register of waste treatment plants included all facilities with a permitted or licensed treatment capacity of more than 50 tonnes/year of incineration, landfilling and biological treatment, and other treatment. Treatment plants with lower capacity have been excluded. Smaller plants that use soils and mineral waste for backfilling or for construction purposes are excluded. As already mentioned, there are also facilities in manufacturing industry that use different wastes or rest products as raw material in their production without being registered as waste treatment facilities. We have tried to identify as many as possible of these (for example in connection with the waste generation surveys), but there may still be under-coverage.
The register of all permitted or licensed waste treatment plants does not contain any facilities with permission to release waste to water. However, we have judged that release to water occurs mainly from facilities already in the register (for example landfills releasing leachate water), or from industries that are studied in the waste generation survey (in which also treatment not included in our register was looked for). There is also information from earlier surveys about facilities with release of waste into water. Data collection on treated quantities An overview of methods and sources for waste treatment is shown in Table 3. Table 3. Determination of treated waste quantities.
The data on treated quantities were collected as follows:
When evaluating the environmental reports, the following information was extracted from the environmental reports:
The amounts of treated waste and the capacity were then summarised. The number of plants in each NUTS 2 region was also counted. We have earlier found that it is difficult to survey recovery in manufacturing industries. The respondents often have a broad concept of "recovery", and in earlier questionnaire surveys, it was found that respondents often classify different kind of pre-treatment as "recovery" and "recycling". For the WStatR-production, statistics is classified as "final" recovery or recycling when the waste cease to be a waste and is transposed to a new product, material or construction. Often industries do not classify that as recovery or waste treatment, they regard it as use of secondary raw materials. Special efforts have been made to survey the real "final" recovery and recycling, and to exclude different kinds of pre-treatment and sorting. Data collection on capacity of treatment facilities The environmental report shall contain information about given permits and production data. However, the permits are usually expressed in terms that are difficult to convert to terms that are used on WStatR-production:
The number of facilities in different regions has been retrieved automatically from the database. [1] Occasional deregistration is not included. |
||||||||||||||||||||||||||||||||||||||||||||||
| 3.2. Frequency of data collection | ||||||||||||||||||||||||||||||||||||||||||||||
Data on waste generation is collected every second year for households and most industries. However, a few industries which generate very small amounts of waste are surveyed less frequently, e.g. NACE 13-15, 16, 19, 20-22, 23, 26-30 and 31-33. All aforementioned NACE:s were surveyed regarding waste generation in 2020. Data on waste treatment is collected every second year. |
||||||||||||||||||||||||||||||||||||||||||||||
| 3.3. Data collection | ||||||||||||||||||||||||||||||||||||||||||||||
Prior to each WStatR-production round, all relevant data sources are listed, e.g. environmental reports and data from business associations. For the manufacturing industry, a sample survey is also carried out as described in Annex 2 Waste generation in the economy – sample survey. In order to minimize response burden and optimize the use of resources, some industries are surveyed less frequently as described above. The data collection period for the web survey is mainly April-June, but a few facilities are given respite. Starting from waste generated in 2020 the local units included in the sample surveys are obligated to report generated waste according to a change in the Swedish legislation (SFS 2020:614). Data collection from environmental reports and other administrative sources takes place in April- February. |
||||||||||||||||||||||||||||||||||||||||||||||
| 3.4. Data validation | ||||||||||||||||||||||||||||||||||||||||||||||
In WStatR2022 Sweden implemented a data validation tool for generated waste, which compares the values for 2020 to previous years’ values according to facility and waste type. The validation takes into account the impact of the change to the total value per waste type. This has been done in effort to use the labour resources most efficiently, and to objectively validate the data. When external reference data sources have been available, these have been used for validation of WStatR data. |
||||||||||||||||||||||||||||||||||||||||||||||
| 3.5. Data compilation | ||||||||||||||||||||||||||||||||||||||||||||||
All input data is stored in a database. Estimation for each activity item is made by a standardized script. Statistical disclosure control is made when all data is in place. |
||||||||||||||||||||||||||||||||||||||||||||||
| 3.6. Adjustment | ||||||||||||||||||||||||||||||||||||||||||||||
No adjustments are made. |
||||||||||||||||||||||||||||||||||||||||||||||
|
|||
| 4.1. Quality assurance | |||
See below. |
|||
| 4.2. Quality management - assessment | |||
Relevance and accuracy For most economic activities (NACE), relevance and accuracy are good. However, for a few activities data is more uncertain, which is indicated with the “E” flag in GENER. Timelines The timetable was set up in order to deliver data to Eurostat and Swedish EPA in time. The deadlines have been met. Accessibility The statistics is published in Statistics Sweden’s Statistical database, which is open to the public. The quality report and the report “Waste in Sweden 2020” will be published by Swedish EPA in June 2022. Extracts from the statistics will also be published on the Swedish EPA’s website. Information leaflets regarding waste statistics for certain NACEs and waste streams will also be available on the Swedish EPAs website in June 2022. Comparability The regulatory framework and guidelines from Eurostat have been followed as far as possible. This should guarantee that the statistics are comparable with corresponding statistics from other member states. The current survey WStatR2022 is essentially comparable to the prior surveys from WStatR2020 to WStatR2012. Methodological changes are marked with B for break in time series in the delivery file. Coherence The Swedish official statistics on generated and treated waste are based on the same general statistical information, same general methods, scopes and limitations as other statistics that are reported to Eurostat. |
|||
|
||||||
| 5.1. Relevance - User Needs | ||||||
There are many different users of waste statistics - citizens, politicians, municipal, regional and national authorities, central government offices, industry, researchers, press reporters, the public, etc. The needs differ depending on type of user. Some users are interested in the total numbers from the statistics, whereas others are interested in certain NACE or sub-categories of NACE, or certain waste types. |
||||||
| 5.2. Relevance - User Satisfaction | ||||||
Apart from the reporting obligations to the EU in accordance with the waste statistics regulation, statistics on waste generation and recovery and disposal of waste are needed in Sweden for the follow-up and development of environmental policies, the 16 national environmental objectives, the national waste management plan, and other action plans. The existing waste statistics are considered to be useful for both the follow-up and the development of action plans in this field, even if follow-up indicators and other uses based on the statistics need to be further developed |
||||||
| 5.3. Completeness | ||||||
Table 4. Description of missing data in data set one on waste generation.
No missing data in dataset 1.
Table 5. Description of missing data in data set two and three on treated waste quantities and capacities.
No missing data in dataset 2 and 3. |
||||||
| 5.3.1. Data completeness - rate | ||||||
The data on waste generation is considered to be complete across waste types and economic activities, i.e. the rate is 100 %. In the cells where the reported values are zero, there are strong indications that the combinations of waste type and economic activities are not occurring. For example, the waste type may not be reported by any of the several hundred enterprises included in the survey, or that the combinations of activity and waste type is extremely unlikely. The data on waste treatment is also considered to be complete for all facilities with permission to treat waste. The data covers all incineration, with and without energy recovery, all landfilling, all other disposal, and most of the recovery. Backfilling and recovery of inert wastes (mineral waste and soils) in smaller facilities are not covered, but the overall rate is considered to be very close to 100 %. In the cells where the reported values are zero, the combinations of waste type and treatment method are not occurring. |
||||||
|
||||||||||||||||||||||||||||||||||||||||||||||||||||||||||||||||||||||||||||||||||||||||||||||||||||||||||||||||||||||||||||||||||||||||||||||||||||||||||||||||||||||||||||||||||||||||||||||||||||
| 6.1. Accuracy - overall | ||||||||||||||||||||||||||||||||||||||||||||||||||||||||||||||||||||||||||||||||||||||||||||||||||||||||||||||||||||||||||||||||||||||||||||||||||||||||||||||||||||||||||||||||||||||||||||||||||||
The overall accuracy varies between industries and types of waste. Typically, the accuracy is good for waste treatment and for generated waste from waste treatment facilities, households, and in industrial branches with large amounts of waste, i.e. NACE 05-09, 10-12, 17-18 and 24-25. For other industries, the uncertainties are larger, especially in NACE G-U excl. 46.77. Random errors are described under sampling errors below. Measurement errors and nonresponse are also considered to be random to some extent. Regarding bias, it is assumed to be negligible at the aggregated level for non-hazardous waste. This is because the mining industry accounts for most of the non-hazardous waste and the mining industry is subject to a total coverage survey. |
||||||||||||||||||||||||||||||||||||||||||||||||||||||||||||||||||||||||||||||||||||||||||||||||||||||||||||||||||||||||||||||||||||||||||||||||||||||||||||||||||||||||||||||||||||||||||||||||||||
| 6.2. Sampling error | ||||||||||||||||||||||||||||||||||||||||||||||||||||||||||||||||||||||||||||||||||||||||||||||||||||||||||||||||||||||||||||||||||||||||||||||||||||||||||||||||||||||||||||||||||||||||||||||||||||
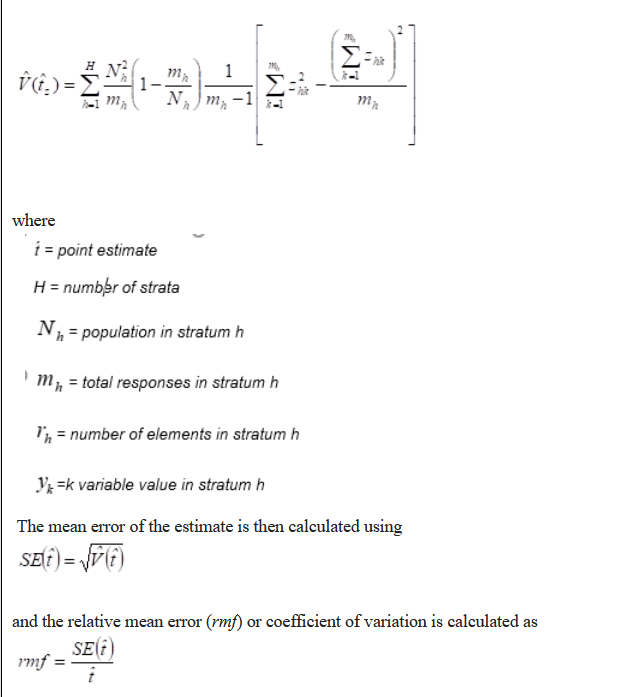
Sampling errors may occur when a sample of the local units/facilities/enterprises that are included in the target population is surveyed. The error is due to the degree of variation in the data and can be controlled by choosing the appropriate sampling design. In sample surveys, the sampling errors are assessed by the coefficients of variation. In cases where data on the generation of waste and treatment of waste have been produced from surveys (questionnaire or environmental reports as the data source), sampling errors (coefficients of variation) are estimated together with the estimates of population totals for each waste category. Surveys are used for estimation of waste generation in mining and quarrying and manufacturing industries. Web surveys were used for NACE C10-33. Environmental reports were used in NACE 05-33, 38 and 46.77. For NACE 05-09 and 38.1-2, a total survey of environmental reports is the only data source, and hence there are no sampling errors in these industries. In practice, the unit nonresponse is treated as being random. In the estimation process, the number of selected units in each stratum is replaced by the number of responding units (mh in the formula below). This means that the unit nonresponse is reflected in an increased sampling error. The variance is calculated according to the formula:
In the tables reported, the variance coefficients are expressed as percent of the point estimate. In sectors other than those mentioned above, sample surveys are not used and hence sampling error is not applicable for these sectors. For disposal and recovery of waste all facilities with a permission to treat waste is surveyed by environmental reports, i.e. it is a total survey with no sampling error.
Annexes: Annex 6.2 formulas |
||||||||||||||||||||||||||||||||||||||||||||||||||||||||||||||||||||||||||||||||||||||||||||||||||||||||||||||||||||||||||||||||||||||||||||||||||||||||||||||||||||||||||||||||||||||||||||||||||||
| 6.2.1. Sampling error - indicators | ||||||||||||||||||||||||||||||||||||||||||||||||||||||||||||||||||||||||||||||||||||||||||||||||||||||||||||||||||||||||||||||||||||||||||||||||||||||||||||||||||||||||||||||||||||||||||||||||||||
Uncertainties in key aggregates Table 6 presents the key aggregates reported. For waste generation, coefficients of variation are calculated as the overall standard deviation from the sample surveys in relation to the estimated total amount of waste. Only aggregated data from administrative sources is used for waste generation from households, and hence there is no sampling error. The mining industry (NACE 05 – 09) accounts for 80 % of the non-hazardous and 64 % of the hazardous waste generated from enterprises. Since no sample survey is conducted for this industry, the contribution to the sampling error is zero for non-hazardous waste. The largest contributors to hazardous waste from enterprises other than NACE B are NACE F, G-UX46.77 and D. None of these industries are surveyed by means of a sample survey, and hence the coefficient of variation is rounded to zero also for generation of hazardous waste in enterprises. For waste treatment, the coefficients of variation are zero because it is not a sample survey.
It has been assumed that the different sub-sectors are independent of one another when they are summed to the key aggregate. The standard formula for propagation errors can thus be applied:
Where: Utotal is the percentage uncertainty for the total waste quantity xi is the incoming waste quantity Ui is the percentage uncertainty for waste quantity xi For all the sub-categories that are not subject to sample surveys, Ui = 0. Waste treatment is surveyed by a total survey to all registered waste treatment facilities. Since it is a total survey the variation coefficient is 0.
Annexes: Annex 6.2.1 Formula |
||||||||||||||||||||||||||||||||||||||||||||||||||||||||||||||||||||||||||||||||||||||||||||||||||||||||||||||||||||||||||||||||||||||||||||||||||||||||||||||||||||||||||||||||||||||||||||||||||||
| 6.3. Non-sampling error | ||||||||||||||||||||||||||||||||||||||||||||||||||||||||||||||||||||||||||||||||||||||||||||||||||||||||||||||||||||||||||||||||||||||||||||||||||||||||||||||||||||||||||||||||||||||||||||||||||||
In the Swedish reporting of waste statistics, sample surveys account for only part of the estimates and hence various types of non-sampling errors are the main contributors to the total survey error (TSE). Non-response, coverage errors and erroneous and/or incomplete answers can cause non-sampling errors. Table 7 and table 8 below show the distributions of object status in the questionnaire survey and environmental report survey, respectively. Table 7. Distribution of object status in questionnaire survey (observation object=local unit)
Table 8. Distribution of object status in environmental reports (observation object=facility)
|
||||||||||||||||||||||||||||||||||||||||||||||||||||||||||||||||||||||||||||||||||||||||||||||||||||||||||||||||||||||||||||||||||||||||||||||||||||||||||||||||||||||||||||||||||||||||||||||||||||
| 6.3.1. Coverage error | ||||||||||||||||||||||||||||||||||||||||||||||||||||||||||||||||||||||||||||||||||||||||||||||||||||||||||||||||||||||||||||||||||||||||||||||||||||||||||||||||||||||||||||||||||||||||||||||||||||
Coverage errors regarding the population occur when the survey method results in:
Coverage errors lead to waste quantities either being missed, counted twice, or overestimated due to over-coverage. Under- and over-coverage problems related to the population that have been detected in connection to the collection of data include:
To compile data adapted to the waste statistics regulation, different methods have been used for different activities. In the surveys for waste generation reaching 100 % coverage has been aimed for by the following strategies/techniques:
In NACE 05-09, waste from NACE 08 is not covered. This has several reasons. Historically, very few environmental reports for this industry were available. In the business register, the sites are either part of a local unit included in some other economic activity, typically in NACE 23, or correspond to local units with less than 10 employees. This known deficit has not been prioritised, mainly because the contribution from NACE 08 to the waste generation from the group NACE 05-09 is negligible compared to NACE 07 and 09 (NACE 05-06 are practically not occurring in Sweden). Depending on the size and activity, waste treatment facilities can be divided into three categories:
|
||||||||||||||||||||||||||||||||||||||||||||||||||||||||||||||||||||||||||||||||||||||||||||||||||||||||||||||||||||||||||||||||||||||||||||||||||||||||||||||||||||||||||||||||||||||||||||||||||||
| 6.3.1.1. Over-coverage - rate | ||||||||||||||||||||||||||||||||||||||||||||||||||||||||||||||||||||||||||||||||||||||||||||||||||||||||||||||||||||||||||||||||||||||||||||||||||||||||||||||||||||||||||||||||||||||||||||||||||||
Over-coverage rate due to units being closed before 2020 or not active in 2020, is calculated. See tables 7 & 8 above. |
||||||||||||||||||||||||||||||||||||||||||||||||||||||||||||||||||||||||||||||||||||||||||||||||||||||||||||||||||||||||||||||||||||||||||||||||||||||||||||||||||||||||||||||||||||||||||||||||||||
| 6.3.1.2. Common units - proportion | ||||||||||||||||||||||||||||||||||||||||||||||||||||||||||||||||||||||||||||||||||||||||||||||||||||||||||||||||||||||||||||||||||||||||||||||||||||||||||||||||||||||||||||||||||||||||||||||||||||
Different frames have been used in different surveys, i.e.:
This may lead to over-coverage (object counted in several surveys) as well as under-coverage (objects in the target population missing in all frames used). The different frames have been checked against each other with the aim of detecting objects that have appeared in several of the frames. Any cases identified where data have appeared twice have been corrected. It is hence assumed that no data has been counted twice. Local units have been used as observation unit in the surveys of manufacturing industries. In the surveys of NACE 05-09, 38 and 46.77 facilities were applied. A "facility", in this case, is a unit that has permission for environmental hazardous activities and is registered in SMP. Usually a facility is equivalent to local unit, but there are exceptions since the facility is based on the environmental hazardous activities and the local unit is based on the economic activities. There are examples where one local unit consists of two or more facilities (two separate permissions), as well as where one facility consists of two or more local units. This causes coverage problems in those sectors where the frame is based on the business register, i.e. local units, while the data is actually collected on facility level. We have tried to overcome this problem by checking that each local unit is only counted in one of the sub populations (web-survey or environmental reports population). It happens that a facility is matched to several local units, coded as different activities (e.g. NACE 08 and 23), and the facility may represent each of the local units, or both/all of them. The waste must be allocated to one activity only, and the choice is made manually using information in the business register and the environmental report. This does not have any influence on the total amounts of waste, but may affect the distribution of waste between different activities. Coverage rates in the questionnaire survey and environmental report survey, respectively, are shown in tables 7 and 8 above.
In NACE G-U excl. G46.77, the under-coverage-rate is unknown, but suspected to be non-negligible. For example, the statistics on waste from harbours does not cover all harbours, which leads to large under-coverage mainly for the waste items 10.2 and 11. We also know that there is major under-coverage in the data used for waste from airports, medical care and distribution of newspapers. The under-coverage rate is not possible to quantify, mainly due to lack of documentation, and hence no compensation is possible. The data source used for hazardous waste 2020 is considered to have better coverage rate than the data source used for previous years, but still the under coverage could be substantial. Many companies in these industries are not represented in the hazardous waste register, however, it is not known how many of these companies that actually generated hazardous waste. There may be an under-coverage of recovery of soils and mineral waste from construction and demolition – smaller facilities do not need permission (only notification to the local authority), and they are not included in the survey of waste treatment. This will also have an influence of the generation of the corresponding secondary wastes. Another possible under-coverage is when wastes, usually well-defined “clean” wastes, are used as fuel or raw material in industries. There are several examples where the industries do not report this as waste treatment in the environmental report. During several years there has been an attempt to identify these facilities, and today all major facilities should have been identified and are included in the survey. The definition of waste has been interpreted according to European regulation and practices. After 2008 there has been a tendency towards classifying some rest-products as by-products instead of waste. This means that rest-products that have been included in the waste statistics before 2008 are no longer included. A difficulty is when a facility generating a rest-product and a facility receiving the rest-product classify the same rest-product in different ways. Since waste generation and waste treatment are separate surveys, there are usually no possibilities to discover those discrepancies. It is a recognized task for the supervising and monitoring authorities to give guidance so the classifying of rest-products as waste or by-product becomes harmonized in all parts of the waste management chain.
|
||||||||||||||||||||||||||||||||||||||||||||||||||||||||||||||||||||||||||||||||||||||||||||||||||||||||||||||||||||||||||||||||||||||||||||||||||||||||||||||||||||||||||||||||||||||||||||||||||||
| 6.3.2. Measurement error | ||||||||||||||||||||||||||||||||||||||||||||||||||||||||||||||||||||||||||||||||||||||||||||||||||||||||||||||||||||||||||||||||||||||||||||||||||||||||||||||||||||||||||||||||||||||||||||||||||||
|
||||||||||||||||||||||||||||||||||||||||||||||||||||||||||||||||||||||||||||||||||||||||||||||||||||||||||||||||||||||||||||||||||||||||||||||||||||||||||||||||||||||||||||||||||||||||||||||||||||
| 6.3.3. Non response error | ||||||||||||||||||||||||||||||||||||||||||||||||||||||||||||||||||||||||||||||||||||||||||||||||||||||||||||||||||||||||||||||||||||||||||||||||||||||||||||||||||||||||||||||||||||||||||||||||||||
The unweighted response rate for the web surveys on waste generation was 75 % on the total level. This is much better than in previous reference periods, thanks to the fact that the survey is mandatory from reference year 2020. The proportion of valid environmental reports is similar, except among smaller facilities in NACE 16-18, 24-25 and 38+46.77. The unit nonresponse was compensated by means of proportional adjustment, that is, linear expansion within each stratum. Thus, it was assumed that each stratum is homogeneous and that the respondents are representative for the non-respondents. The nonresponse adjustment and the sample adjustment are made at the same time. Such adjustments have been made for the surveys in the manufacturing industry. Nonresponse- and sampling error has not been estimated separately, but the nonresponse error is reflected as a larger sampling error. In the waste generation survey for NACE 38 and 46.77 there was non-response due to environmental reports with classified information or with missing information about waste generation. No compensation for these rare cases was made, and hence there is a negative nonresponse bias in waste generation in NACE 38 and 46.77. In addition, in the survey of waste treatment there was non-response due to environmental reports with classified information or with missing information about waste treatment. This also leads to a negative nonresponse bias. The description above concerns unit non-response. Item non-response can also occur. No adjustment for item nonresponse has been made because it is not obvious which types of waste that should occur for a specific facility. When adjusting for non-response at least two different errors can occur:
|
||||||||||||||||||||||||||||||||||||||||||||||||||||||||||||||||||||||||||||||||||||||||||||||||||||||||||||||||||||||||||||||||||||||||||||||||||||||||||||||||||||||||||||||||||||||||||||||||||||
| 6.3.3.1. Unit non-response - rate | ||||||||||||||||||||||||||||||||||||||||||||||||||||||||||||||||||||||||||||||||||||||||||||||||||||||||||||||||||||||||||||||||||||||||||||||||||||||||||||||||||||||||||||||||||||||||||||||||||||
At the overall level, the unit non-response rate in the web-survey was 24 %. For environmental reports, 199 of the 811 reports in the mining & quarrying and manufacturing industries were missing or did not contain useful information. See table 6 for response to web survey. Table 6. Response rate for web survey
Npop=number of units in the population Nsamp=number of units sampled Nresp=number of responding units Due to over coverage the response- and nonresponse rate do not always summarize to 100 percent.
In the waste generation survey for NACE 38 and 46.77, the number of surveyed facilities was 994, of which 509 generated waste and 145 facilities were reported as unit non-response. In addition to the non-responding objects, some of the treatment plants in NACE 38 and 46.77 generate no waste. Thus, they are not considered unit non-response. It was judged that the non-responses to a large part were from non-active facilities, and no adjustment was made. However, it is likely that some of the non-responding facilities have waste generation that should be included in the statistics. Also, in the survey of waste treatment 1639 facilities were surveyed of which 314 are reported as unit non-response. The non-responses are expected to large part come from non-active facilities, and no adjustment was made. However, it is not impossible that some of the non-response facilities have waste treatment that should have been included in the statistics. |
||||||||||||||||||||||||||||||||||||||||||||||||||||||||||||||||||||||||||||||||||||||||||||||||||||||||||||||||||||||||||||||||||||||||||||||||||||||||||||||||||||||||||||||||||||||||||||||||||||
| 6.3.3.2. Item non-response - rate | ||||||||||||||||||||||||||||||||||||||||||||||||||||||||||||||||||||||||||||||||||||||||||||||||||||||||||||||||||||||||||||||||||||||||||||||||||||||||||||||||||||||||||||||||||||||||||||||||||||
The rate of item non-response is impossible to determine in this case, since it is often not obvious which types of waste that “must” be generated in a specific industry, and it is even more difficult to reveal if some rare wastes are missed. Generally, item non-response has been assumed to be not occurring, and hence the rate is zero. Units with obvious multiple item non-response, e.g. only reporting a couple of hazardous waste items and no non-hazardous ones, are not used in the estimation. Such objects are treated as unit nonresponse. There is a risk of a small negative bias due to item non-response, but the effect on the estimates is assumed to be negligible. |
||||||||||||||||||||||||||||||||||||||||||||||||||||||||||||||||||||||||||||||||||||||||||||||||||||||||||||||||||||||||||||||||||||||||||||||||||||||||||||||||||||||||||||||||||||||||||||||||||||
| 6.3.4. Processing error | ||||||||||||||||||||||||||||||||||||||||||||||||||||||||||||||||||||||||||||||||||||||||||||||||||||||||||||||||||||||||||||||||||||||||||||||||||||||||||||||||||||||||||||||||||||||||||||||||||||
Processing errors occur when the raw data are processed in various ways during the data production. The following processing errors can occur:
The aim has been to reduce or avoid the above mentioned types of processing errors by an iterative process of micro- and macro-editing during and after the data collection. Controls have been made both before and after the input to the database. The scripts used for estimation and table production are reviewed independently by two persons to detect errors. |
||||||||||||||||||||||||||||||||||||||||||||||||||||||||||||||||||||||||||||||||||||||||||||||||||||||||||||||||||||||||||||||||||||||||||||||||||||||||||||||||||||||||||||||||||||||||||||||||||||
| 6.3.4.1. Imputation - rate | ||||||||||||||||||||||||||||||||||||||||||||||||||||||||||||||||||||||||||||||||||||||||||||||||||||||||||||||||||||||||||||||||||||||||||||||||||||||||||||||||||||||||||||||||||||||||||||||||||||
No imputation was done in the web survey. In the environmental report survey of NACE B and C, 3 objects were imputed with data from the 2019 environmental report, and 7 were imputed with data from other sources. Hence the imputation rate was 10/ 881 = 1,1 %. The rate in terms of waste amounts has not been calculated.
In the survey of waste generation in NACE 38 and 46.77 the number of surveyed facilities was 595, of which all waste data was imputed for 2.
5.3.4.2. Common units – proportion Ideally, there should be no common units (i.e. duplicates) since the web survey frame has been constructed as the complement to the register of environmental hazardous activities (SMP). However, due to the different unit definitions, in total 19 units, were sampled in both the web survey and in the environmental reports. This is less than 2 %, sampled in the web survey. This was dealt with by imputing the questionnaires with data from the environmental reports.
|
||||||||||||||||||||||||||||||||||||||||||||||||||||||||||||||||||||||||||||||||||||||||||||||||||||||||||||||||||||||||||||||||||||||||||||||||||||||||||||||||||||||||||||||||||||||||||||||||||||
| 6.3.5. Model assumption error | ||||||||||||||||||||||||||||||||||||||||||||||||||||||||||||||||||||||||||||||||||||||||||||||||||||||||||||||||||||||||||||||||||||||||||||||||||||||||||||||||||||||||||||||||||||||||||||||||||||
In e.g. NACE 01-03, 41-43 and G-U excl. 46.77, the data available covers only part of the population, and various assumptions have been made to estimate the amounts for the whole population. Typically, waste generation is assumed to be proportional to turnover, number of employees etc. but these assumptions have not been verified and may infer model error.
Waste from small enterprisesNone of the surveys covers the entire population in the industries surveyed. Waste generated in local units with less than 10 employees is estimated by means of cut-off expansion. Proportional adjustmentsIn NACE 38.3 and NACE 46.77 only major facilities were investigated (usually facilities that have permission to handle more than 10 000 tonnes of waste per year). A proportional adjustment based on the number of employees (metal facilities in one group and non-metal in another) has been made. This calculation is based on the assumption that the waste generation is the same per employee in small enterprises as in big enterprises. Waste factors The main problem with waste factors is that only one or a few factors that can affect the amount of generated waste is reflected by the factor. For example, if the factor is expressed as tonnes of waste per employee, the change in amounts of generated waste between two years only mirrors the change in number of employees and does for example not capture any measures taken to reduce the amount of waste generated per employee or improved sorting at source in different waste types. Waste factors have been used in several cases. In some cases the factors are based on current measurements, e.g. household waste from enterprises. These factors can be regarded as rather accurate. In other cases data from case studies, e.g. bio-degradable wastes from shops and restaurants have been used to estimate waste factors, which may increase uncertainty. |
||||||||||||||||||||||||||||||||||||||||||||||||||||||||||||||||||||||||||||||||||||||||||||||||||||||||||||||||||||||||||||||||||||||||||||||||||||||||||||||||||||||||||||||||||||||||||||||||||||
| 6.4. Seasonal adjustment | ||||||||||||||||||||||||||||||||||||||||||||||||||||||||||||||||||||||||||||||||||||||||||||||||||||||||||||||||||||||||||||||||||||||||||||||||||||||||||||||||||||||||||||||||||||||||||||||||||||
Not relevant since the statistics only includes annual data. |
||||||||||||||||||||||||||||||||||||||||||||||||||||||||||||||||||||||||||||||||||||||||||||||||||||||||||||||||||||||||||||||||||||||||||||||||||||||||||||||||||||||||||||||||||||||||||||||||||||
| 6.5. Data revision - policy | ||||||||||||||||||||||||||||||||||||||||||||||||||||||||||||||||||||||||||||||||||||||||||||||||||||||||||||||||||||||||||||||||||||||||||||||||||||||||||||||||||||||||||||||||||||||||||||||||||||
Normally, no data revisions are made unless specific and significant reasons exist, e.g. new standards or requirements from Eurostat. |
||||||||||||||||||||||||||||||||||||||||||||||||||||||||||||||||||||||||||||||||||||||||||||||||||||||||||||||||||||||||||||||||||||||||||||||||||||||||||||||||||||||||||||||||||||||||||||||||||||
| 6.6. Data revision - practice | ||||||||||||||||||||||||||||||||||||||||||||||||||||||||||||||||||||||||||||||||||||||||||||||||||||||||||||||||||||||||||||||||||||||||||||||||||||||||||||||||||||||||||||||||||||||||||||||||||||
When errors have been detected in the Eurostat review process, corrected data has been reported to Eurostat. |
||||||||||||||||||||||||||||||||||||||||||||||||||||||||||||||||||||||||||||||||||||||||||||||||||||||||||||||||||||||||||||||||||||||||||||||||||||||||||||||||||||||||||||||||||||||||||||||||||||
| 6.6.1. Data revision - average size | ||||||||||||||||||||||||||||||||||||||||||||||||||||||||||||||||||||||||||||||||||||||||||||||||||||||||||||||||||||||||||||||||||||||||||||||||||||||||||||||||||||||||||||||||||||||||||||||||||||
Generally, revisions are small. |
||||||||||||||||||||||||||||||||||||||||||||||||||||||||||||||||||||||||||||||||||||||||||||||||||||||||||||||||||||||||||||||||||||||||||||||||||||||||||||||||||||||||||||||||||||||||||||||||||||

|
|||||||||||||||||||||||||||||||||||||||
A general time schedule for the reporting according to the EU waste statistics regulation is shown in Table 9. Table 9. Time schedule for reporting waste statistics
|
|||||||||||||||||||||||||||||||||||||||
| 7.1. Timeliness | |||||||||||||||||||||||||||||||||||||||
. |
|||||||||||||||||||||||||||||||||||||||
| 7.1.1. Time lag - first result | |||||||||||||||||||||||||||||||||||||||
The time lag between the end of the reference period and the publishing date is around 18 months. |
|||||||||||||||||||||||||||||||||||||||
| 7.1.2. Time lag - final result | |||||||||||||||||||||||||||||||||||||||
Final results are submitted to Eurostat two weeks after the publishing date. |
|||||||||||||||||||||||||||||||||||||||
| 7.2. Punctuality | |||||||||||||||||||||||||||||||||||||||
. |
|||||||||||||||||||||||||||||||||||||||
| 7.2.1. Punctuality - delivery and publication | |||||||||||||||||||||||||||||||||||||||
All data and publications were delivered in time to Eurostat. |
|||||||||||||||||||||||||||||||||||||||
|
||||||||||||||||||||||||||||||||||||||||||||||||||||||||||||||||||||||||||||||||||||||||||||||||||||||||||||||||||||||||||||||||||||||||||||||||||||||||||||||||||||||||||
The regulatory framework and guidelines from Eurostat have been followed as far as possible. All surveys have been carried out to achieve 100 % coverage of waste quantities. This should guarantee that the statistics are comparable with corresponding statistics from other member states. However, the following areas should be highlighted as somewhat problematic concerning comparability:
Local unit, establishment, facility and station have mostly been used as survey objects. A local unit, establishment, facility or station can have several different economic activities, one main activity and several secondary activities. In this case the entire local unit, establishment, facility or station has been classified by its main activity. For example, coking plants can be found at steelworks. Independent coking plants (not existing in Sweden) should be classified as NACE 19 and steelworks as NACE 24. In our survey, coking plants at steelworks have been classified as belonging to NACE 24, and the waste generated there has been allocated to NACE 24. |
||||||||||||||||||||||||||||||||||||||||||||||||||||||||||||||||||||||||||||||||||||||||||||||||||||||||||||||||||||||||||||||||||||||||||||||||||||||||||||||||||||||||||
| 8.1. Comparability - geographical | ||||||||||||||||||||||||||||||||||||||||||||||||||||||||||||||||||||||||||||||||||||||||||||||||||||||||||||||||||||||||||||||||||||||||||||||||||||||||||||||||||||||||||
The same methods are used in across Sweden. For mobile treatment equipment the generation of waste and the recovery and disposal of waste, have been reported where it has been used. Capacity data have, however, been reported in the municipality where it is registered or permitted. Only a few mobile operations have been found in the surveys, so the locations of these facilities are not considered to have any significant impact on the total reported quantities of waste or treatment capacities. See table 10 for classification used. Table 10. Description of classification used.
|
||||||||||||||||||||||||||||||||||||||||||||||||||||||||||||||||||||||||||||||||||||||||||||||||||||||||||||||||||||||||||||||||||||||||||||||||||||||||||||||||||||||||||
| 8.1.1. Asymmetry for mirror flow statistics - coefficient | ||||||||||||||||||||||||||||||||||||||||||||||||||||||||||||||||||||||||||||||||||||||||||||||||||||||||||||||||||||||||||||||||||||||||||||||||||||||||||||||||||||||||||
This measure has not been calculated. |
||||||||||||||||||||||||||||||||||||||||||||||||||||||||||||||||||||||||||||||||||||||||||||||||||||||||||||||||||||||||||||||||||||||||||||||||||||||||||||||||||||||||||
| 8.2. Comparability - over time | ||||||||||||||||||||||||||||||||||||||||||||||||||||||||||||||||||||||||||||||||||||||||||||||||||||||||||||||||||||||||||||||||||||||||||||||||||||||||||||||||||||||||||
The current survey WStatR2022 is mostly similar to the prior surveys WStatR2020, WStatR2018, WStatR2016, WStatR2014 and WStatR2012. All surveys follow the guidelines from Eurostat, which means they should be comparable over time. However, some methodological improvements have the effect that the estimates for different years are not always comparable. These cases are described under Major changes compared with previous year, together with a description of observed major changes since last survey in 2020.
For a few industries with relatively low rates of waste generation data is not collected for every reference year, but less frequent (typically every 4 years). This affects the comparability over time for NACE 01-03, 13-15, 16, 19, 20-22, 23, 26-30, 31-33. For these industries, interpretations and comparisons of trends are not meaningful. For all industry NACE:s (C), a survey was used regarding generated waste 2020. This was to make sure that we included the potential impact of Covid-19 on generated waste. NACE 16 was investigated with survey method for the first time since 2008. A new method was also used for estimating hazardous waste from NACE G-U excl 46.77. Administrative register data on hazardous waste was used for the first time in WStatR 2022. Waste amounts from NACE D35 in WStatR2022 is extrapolated from gross electricity supply in combination with waste amounts from WStatR2020.
There have also been some changes in methodology and interpretations as described in earlier quality reports. The amounts of rest products classified as by-products are increasing. Many rest-products that in more recent WStatR are reported as by-products were reported as waste in WStatR2006 and WStatR2008. For example, there are two waste types in the steel sector, which in the current and more recent surveys are classified as by-products: electric arc furnace slag and blast furnace slag. In the paper industry, bark and wood residues that are used as fuel have been reclassified as by-products. As mentioned earlier in this report, many of the reported estimates are associated with considerable uncertainties. This means that even if the results are comparable, it can be difficult to interpret the differences between reference years. The differences can, in some cases, reflect statistical uncertainties or different interpretations of for example by-products, and in other cases be due to actual changes in waste amounts.
Major changes compared with previous year
For WStatR 2022 some new methods were introduced: - Vegetal waste (09.2) in NACE A is now estimated using a new method - Mineral wastes (12.A*) A clarification regarding hazardous-classification in the environmental reports of some 12.A waste in the NACE B05-09 has increased the amount of hazardous waste reported significantly. - NACE 16: survey method was used for the first time since 2008 - Hazardous waste in the NACE G-U excl. G46.77 sector is now estimated using a new method using register data.
WASTE GENERATION The total amount of waste generated in Sweden increased from ca 140 000 000 tonnes in 2018 and to ca 150 000 000 tonnes 2020. The majority of this waste (116 000 000 tonnes) is mineral waste (12.A) from the mining and extraction industry (NACE B05-09). This is also where the majority of the increase has occured (comp. 103 000 000 tonnes in the same category generated in 2018). There has been a 6% increase in non-hazardous waste and a 274% increase in hazardous waste between 2018 and 2020. The increase in hazardous waste is due to a classification clarification regarding hazardous status of some 12.A waste generated in the mining and extraction industry. The increase of 4 740 000 tonnesof 12.A* in the mining and extraction industry explains almost the entire increse in hazardous waste of 5 000 000 tonnes between 2018 and 2020.
Other major changes are driven by an increase of waste in NACE F41-43, an increase of hazardous waste in NACE G-U excl. G46.77 (driven by a method change), variation in NACE E38 and a general decrease in generated waste in the manufacturing industries (NACE C, notably C26-20).
For more detailed descriptions see each NACE below.
For waste types that are classified as confidential the publication of the statistic would run thw risk of disclosing confidential information regarding one or more reporting facilities/companies. For these waste types or waste type and treatment combination the changes have still been verified by SMED, but are not disclosed here.
NACE A (01-03) The total amount of non-hazardous wastes in NACE A has increased from 940 600 tonnes in 2018 to 1 034 900 tonnes in 2020. This is mainly driven by a new method to measure vegetable wastes (09.2) in the agricultural sector (NACE 01), which SMED thinks gives a more correct result. An observable increase in manure (09.3) is also clear, correctly reported, and contributes to the overall increase of non-hazardous wastes. Vegetal waste (09.2): One major change in the reporting from NACE A is the inclusion of vegetal waste from codigesters, where substrate from NACE A is now included. This results in an increase of ca 40 000 tonnes of vegetal waste. This addition gives a more accurate result. Animal and mixed wastes (09.1): During 2020 there was an emergency inhibition of fishing for cod in the Baltic Sea resulting in a large decrease in 09.1 reported from the fishing industry. The amount dropped from 54 tonnes in 2018 to 2 tonnes in 2020. Glass wastes (07.1), mixed and undifferentiated wastes (10.2) and common sludges (11) have all increased because of an increase in the number of persons employed in the fishing industry. The change in other wastes (such as Batteries and accumulator wastes (08.41)) is a very small reduction in absolute numbers, but because of small amounts in the sector give large relative changes. The amounts of 08A and 08A* have also reduced, as a result of a reduction in the number of worked hours in the forestry industry. NACE B (05-09) The sector has had an increase in production according to the national authority Geological Survey of Swedish. They state that the production of ore was the highest ever, so therefore it is expected that the typical waste 12A (EWC 12.2, 12.3 and 12.5) is higher than in 2018.
12A (EWC 12.2, 12.3 and 12.5) Mineral wastes has increased with almost 8 million tonnes. The mining sector has large fluctuations between the years, and it is reflected mostly in this waste category, and as stated above the ore production was the highest ever.
Also Hazardous waste 12A* (EWC 12.2, 12.3 and 12.5) has increased from almost nothing (20 tonnes) to almost 5 million tonnes. In the environmental reports, which SMED uses as a data source, the classification of a certain waste type has been unclear if hazardous or non-hazardous. Hence, this year we made an extra control with the companies about the classification of this waste, which led to a change to from non-hazardous to hazardous waste for several companies. This also gives a very large increase in total amounts of hazardous waste, but is the result of reclassification because of clarification from the facilities regarding this given type of waste.
EWC 10.2 (mixed and undifferentiated materials) has a large decrease from 2018 (18 800 tonnes) to 10 700 tonnes in 2020. During the years there has been large fluctuations in this waste category. The sorting of waste can affect this waste category.
The metal wastes 06.1 and 06.3 have decreased with about 6 000 tonnes and 2 000 tonnes respectively. There have been quite large fluctuations during the years, so this appears to be a sound decrease. Also, in 2018 there was a very high value for 06.1 (highest since 2010).
12.8A (Mineral wastes from waste treatment): There is a change in 12.8A but the waste type is classified as confidential.
Both 12.1 and 12.1* (Mineral wastes from construction and demolition) have increased with about 1 700 tonnes resp 1 400 tonnes. This has been double checked and the change is correct.
07.5 (Wood wastes) has had a quite large increase, but SMED believes the change is sound, wooden waste can differ due to different projects etc. Also 07.5* had an increase of about 90 tonnes which is judged to be correct.
12.6* Hazardous soils has had a quite large decrease, about 600 tonnes. Large differences in soils are likely due to variations in different projects. 12.6 has instead an increase of about 20 tonnes which SMED also believes is sound for the same reason.
07.4, plastic waste, has had a decrease of about 400 tonnes. It is natural with large fluctuations here due to different degree of sorting of plastic wastes.
01.3* Hazardous oils, a decrease of 350 tonnes. There have been quite large fluctuations during the years and SMED believe this decrease is sound.
09.2 decreases from 81 tonnes to 0 tonnes. Vegetal waste is quite unusual in this sector. It has only appeared in 2018, all other years it has been 0. Therefore SMED believes the 0 is correct.
07.2. Paper waste. A decrease from 120 tonnes to about 60 tonnes. There have been large fluctuations in this sector during the years, the change is correctly reported.
The other changes are small numerically (less than 10 tonnes) and SMED believes they are sound.
NACE C10-12 The food, drink and tobacco processing industry (C10-12) reported a total amount of non-hazardous waste of 579 000 tonnes in 2020 compared to 699 400 tonnes in 2018. This is a reduction of 17%. The reduction is mainly due to a change in the handling of wet waste from a few producers, where the water content has now been removed from the reported waste (see 09.2 Vegetal waste). The amount of hazardous waste was 2 750 tonnes 2020 compared to 2 650 tonnes in 2018, that is a reduction of 3.6 % and must be considered a similar amount between years.
Vegetal waste (09.2): Between 2018 and 2020 there has been a reduction of 118 000 tonnes. This is mainly driven by a removal of water from very watery wastes such as fruit water from rinsing pipes. 100 000 tonnes of water have been removed compared to comparable reporting in 2018. In 2020, 90 000 tonnes of vegetal waste were reported.
Animal faeces, urine and manure (09.3): Between 2018 and 2020 there was an increase of 23 600 tonnes of animal faeces, urine and manure. There has been an increase in reporting from several facilities. In 2020, 66 300 tonnes of waste were reported.
Mixed and undifferentiated materials (10.2): Mixed and undifferentiated materials have increased by approx. 10 000 tonnes between 2018 and 2020. The amount reported was 44 000 in 2018 and 54 000 tonnes in 2020. Many small increases lie behind this change.
Paper and cardboard waste (07.2): Waste has decreased by 6 000 tonnes from 21 000 tonnes to 15 000 tonnes. The change is driven by many small changes.
Changes in Metal wastes, ferrous, non-ferrous, and mixed ferrous and non-ferrous (06.1, 06.2 and 06.3): There seems to be changes in coding between the metal codes between the years. The total change is not significant.
Textile wastes (07.6): Textile waste (bags) reported from more facilities in the sector. The increase is deemed sound.
Common sludges (11): Increased from 14 600 to 19 000 tonnes between 2018 and 2020. This may be due to an effort to code sludges to EWC 11. A reported increase from actors is also clear.
Sorting residues (10.3): Clarification in the environmental reports is likely behind the reduction in sorting residues.
Household and similar wastes (10.1): A reduction in 10.1 (from 4 560 tonnes to 3 340 tonnes) is likely due to a shift to 10.2. The data has been verified at the facility-level.
Chemical Wastes (02.A*): Has increased from 1 800 tonnes to 2 200 tonnes between 2018 and 2020. The data has been verified at the facility-level.
Discarded equipment (08A and 08A*): A shift between hazardous and non-hazardous waste results in difference between years, but not in the total amount.
Soils (12.6 and 12.6*): Variation in a variable waste type is to be expected. Fewer facilities had projects resulting in 12.6* type of waste in 2020 compared to 2018.
Wood waste, hazardous (07.5*): The data has been verified at the facility-level. The increase is deemed sound.
Industrial effluent sludges, hazardous (03.2*): The data has been verified at the facility-level.
Healthcare and biological wastes (05*): There is a change in amount of this waste type, but the value of the waste type is classified as confidential for 2020.
All other smaller changes are checked and are deemed to be correctly reported and/or may have overlapping intervals of estimated amounts.
NACE C13-15 The reduction in Textile wastes (07.6) is directly proportional to the increase in Mixed and undifferentiated wastes (10.2) indicating that for the surveys and environmental reports a considerable proportion of the textile wastes were reported as combustible wastes.
Variation in Construction and demolition wastes (12.1) between years are natural as construction projects vary in time.
Plastic wastes (07.4) have reduced by a significant amount. Because no facility-level comparison is possible for this NACE it is impossible to say what this reduction is due to. Since four years have passed since the last survey changes are, however, to be expected.
Because of a gap in the investigation of the NACE a comparison at microlevel/facility level is not possible, which makes it difficult to explain the remaining differences. Differences in waste amounts are to be expected, however.
NACE C16 Data has been collected in a different way than before. We now use data from the environ-mental reports together with data from a survey. Therefore comparisons between earlier years must be done with caution. There are several waste types where there are very large differences between data for 2020 and earlier years. We believe that the method used for data for 2020 has better quality and therefore we assume that the results for 2020 are correct although there are large differences, in total for hazardous and non-hazardous as well as for several waste types. For comments on changes in specific waste types, see below.
This year even more wood rest products have been classified as by-products and not waste. This gives a large difference in the total non-hazardous waste and also for EWC 07.5 wood waste. We believe the classification made regarding generated waste 2020 is accurate.
In the case of Metal wastes EWC 06.1 and 06.2 the increase from 0 tonnes in 2018 is due to the fact that all metal was allocated to metal waste code 06.3.
In the case of Animal and mixed food wastes EWC 09.1 there is an increase in the amount reported between 2018 and 2020. A general trend in Sweden is that also companies have separately collected food waste. This trend may be the explanation for this increase.
There is a large decrease in hazardous Mixed and undifferentiated materials EWC 10.2*, which is expected. Waste treatment facilities continuously work towards reducing mixed wastes.
Soil, both non-hazardous and hazardous, was 0 in 2018. For 2020 there are some thousand tonnes reported. This is due to the new survey for 2020, which gives SMED possibilities to get data for these waste types.
NACE C17-18 The total amount of non-hazardous waste is very similar to 2018. The total in 2018 was about 1.5 million tonnes, and 2020 1.6 million tonnes. This is expected since the economic turnover has been very similar between the years, a small decrease (although we do not know that there is a straight correlation between turnover and waste, but it gives an indication). When it comes to total hazardous waste there is a very large decrease which mainly is due to a very large decrease of hazardous soils, a waste category with large variations historically, which SMED judges to be correctly reported. However, there are some changes in some specific waste categories which should be mentioned.
A large increase occurs for 07.2 paper waste. All companies report this waste type and there are large variations, some have an increase other a decrease. The change in total seems to be OK.
One of the largest differences between 2018 and 2020 is for EWC 12.4 (combustion wastes), with a 56 000 tonnes increase. The change has been verified in the facility-level data.
There is a large decrease in EWC 03.2 (33 000 tonnes) and a large increase in EWC 11 (28 000 tonnes). It is hard to distinguish between 03.2 (Industrial effluent sludges) and 11 (common sludges). If you add these together, the sum is very similar between 2018 and 2020.
For EWC 03.3 (Sludges and liquid wastes from waste treatment) there is a large decrease. 2018 was a year with a very high value, so a decrease was expected. The dry substance content gives large differences, and are sometimes difficult to verify. However, we believe the decrease is correct.
Metals, EWC 06.1, 06.2 and 06.3: Together they are as in 2018. It is often difficult to choose the right metal code, which could be the explanation for the decrease of 06.1 and 06.2 and the increase of 06.3.
For EWC 07.1 (glass waste) there is a rather large increase. The change has been verified in the facility-level data.
For EWC 09.1 (animal and mixed waste) there is a large decrease. The change has been verified in the facility-level data.
For EWC 09.2 (vegetal wastes) there is a large increase. The change has been verified in the facility-level data.
For EWC 12.1 (Mineral waste from construction and demolition) there is a large increase. It is due to different building activities which can vary from one year to another,
For soil, EWC 12.6 there is a quite large increase, but it is natural that this waste type fluctuates over the years. The amount is depending on current construction activities.
EWC 12.7, dredging spoils has a large decrease. This is not a common waste type for this sector, so it was more unusual to have this waste in 2018. 0 ton is therefore an expected value.
When it comes to hazardous waste there are several waste types which show an increase or decrease of more than 20 %. For quite a few of them (EWC 01.1 (spent solvents), (03.2 (industrial effluent sludges), 07.5 (wood wastes), 08 excl 08.41, 08.41 (Batteries), 12.6 (Soil), it is natural with large variations and hence we assess that the values are correct. During the years from 2010 and onwards there has been large variations for these waste types. For example, for EWC 08 large variations can be expected since companies can change a large part of the equipment (for example heavy electric equipment) a certain year and not another year. And for some waste types the values are very small which then gives large variations, this is the case with EWC 05 (healthcare and biological waste) and 12.4 (Combustion waste).
For EWC 12.1 (Mineral wastes from construction and demolition) and 12.8 (Mineral wastes from waste treatment and stabilized waste) there is a very large increase. The change has been verified in the facility-level data.
NACE C19 Total non-hazardous and hazardous: The non-hazardous waste has increased from 7 900 tonnes in 2018 to 58 800 tonnes in 2020. This increase is driven by an increase in 12.6 and 12.1 and due to construction work. Excluding these waste types gives an increase of 1 050 tonnes.
Soils (12.6): There is a large increase (49 300 tonnes) driven by construction projects.
Acid, alkaline or salt wastes (01.2*): The decrease in 01.2* (2 300 tonnes) between 2018 and 2020. The change has been verified in the facility-level data.
Mineral waste from construction and demolition (12.1): There is a large increase in waste 12.1 (1 800 tonnes) driven by construction projects.
Industrial effluent sludges (03.2*): The change has been verified in the facility-level data.
Batteries and accumulators wastes (08.41*): The increase is as reported from facilities in the NACE (200 tonnes).
Vegetal waste (09.2): There is a change in amount of this waste type, but the waste type is classified as confidential for WStatR 2022 so SMED cannot comment on the statistics.
Other changes in NACE 19 result from small changes in absolute amounts that may still give relatively large percentage changes.
NACE C20-22 Total Hazardous waste: Large decrease which is due to a decrease in 02A Chemical wastes, see below. SMED thinks the decrease is sound. 02A* Hazardous chemical wastes There is a change in amount of this waste type, but the waste type is classified as confidential for WStatR 2022 so SMED cannot comment on the statistics. Other large changes in hazardous waste: 12.6* Hazardous soils There is a change in amount of this waste type, but the waste type is classified as confidential for WStatR 2022 so SMED cannot comment on the statistics. 03.2* Hazardous industrial sludges Large increase. This is a consequence of the large decrease in 02A* having now been classified as 03.2*. All other companies have small variations between 2018 and 2020. The change has been verified in the facility-level data.
Non hazardous waste: 03.2. Industrial sludges Large decrease. There are large variations between the companies, where some show an increase and others a decrease. The change has been verified in the facility-level data. 06.1. Metal Large decrease. It is often difficult to determine which of the metal codes is the most correct. However, the total amount of metals (06.1, 06.2 and 06.3) was 12 700 tonnes in 2018, and for 2020 the total is 10 000. SMED believes the change is correct for 06.1. 09.2. Vegetal wastes. Large decrease. The change is due mainly to a large decrease in one company. SMED believes the change is sound.
NACE C23 This group of industries were previously surveyed regarding data year 2018. Data for year 2020 covers a period during the COVID-19 pandemic. Because of this, some sectors have suffered more than others in terms of decrease of the economic turnover. It is expected that waste quantities follow the economic development. The economic turnover in this group of industries has increased by 1 percent from year 2018 to year 2020. Generated hazardous waste has decreased by 24 percent and generated non-hazardous waste has decreased by 23 percent. Some waste categories have increased, and some have decreased. The waste categories with the largest changes in quantities of generated waste from year 2018 to year 2020 are presented and explained by EWC-Stat category below. Decreasing quantities of generated waste: The most important waste categories in terms of quantities that have decreased are: 12.1 Mineral waste from construction and demolition: Waste quantity year 2020: 6 000 tonnes, decreasing by 81 %. Explanation: A group of facilities are showing a decrease of waste quantities, which is deemed to be correct. 12A Other mineral waste: Waste quantity year 2020: 23 400 tonnes, decreasing by 50 %. Explanation: The change has been verified in the facility-level data.
07.5 Wood wastes: Waste quantity year 2020: 16 300 tonnes, decreasing by 22 %. Explanation: The change from year 2018 to year 2020 may be a result of random errors occuring when sampling respondents, since the intervals of uncertainty for the year 2018 and year 2020 are overlapping. 06.1 Metal waste, ferrous: Waste quantity year 2020: 6 900 tonnes, decreasing by 30 %. Explanation: The waste classification among of the EWC-Stat categories 06.1 (Metal waste, ferrous), 06.2 (Metal waste, non-ferrous) and 06.3 (Metallic wastes, mixed ferrous and non-ferrous) are a bit uncertain. The change from year 2018 to year 2020 may be a result of random errors occurring when sampling respondents, since the intervals of uncertainty for the year 2018 and year 2020 are overlapping. 12.4* Combustion wastes*: Waste quantity year 2020: 700 tonnes, decreasing by 63 %. Explanation: A group of facilities are showing a decrease of waste quantities, which is deemed to be correct. 11 Common sludges: Waste quantity year 2020: 40 tonnes, decreasing by 91 %. Explanation: The change from year 2018 to year 2020 may be a result of random errors occurring when sampling respondents, since the intervals of uncertainty for the year 2018 and year 2020 are overlapping. 12A* Other mineral wastes*: There is a change in amount of this waste type, but the waste type is classified as confidential for WStatR 2022 so SMED cannot comment on the statistics. 01.2* Acid, alkaline or salt wastes*: Waste quantity year 2020: 100 tonnes, decreasing by 42 %. Explanation: The change from year 2018 to year 2020 may be a result of random errors occurring when sampling respondents, since the intervals of uncertainty for the year 2018 and year 2020 are overlapping. 08A Discarded equipment Waste quantity year 2020: 3 tonnes, decreasing by 96 %. Explanation: Due to the low quantity of the change between year 2018 and year 2020, the change is considered to be insignificant. The change may be correct, or a result of minor errors in the incoming data from the reporting companies, or a result of the statistical sampling. 07.3 Rubber waste Waste quantity year 2020: 0 tonnes, decreasing by 100 %. Explanation: Due to the low quantity of the change between year 2018 and year 2020, the change is considered to be insignificant. The change may be correct, or a result of minor errors in the incoming data from the reporting companies, or a result of the statistical sampling. Other waste categories that have decreased in quantity are regarded as insignificant. Increasing quantities of generated waste: The most important waste categories in terms of quantities that have increased are: 12.4 Combustion wastes: Waste quantity year 2020: 21 000 tonnes, increasing by 47 %. Explanation: The change from year 2018 to year 2020 may be a result of random errors occurring when sampling respondents, since the intervals of uncertainty for the year 2018 and year 2020 are overlapping. 12.6 Soils: Waste quantity year 2020: 7 300 tonnes, increasing by 159 %. Explanation: The change from year 2018 to year 2020 may be a result of random errors occurring when sampling respondents, since the intervals of uncertainty for the year 2018 and year 2020 are overlapping. 10.2 Mixed and undifferentiated materials: Waste quantity year 2020: 19 600 tonnes, increasing by 30 %. Explanation: The change from year 2018 to year 2020 may be a result of random errors occurring when sampling respondents, since the intervals of uncertainty for the year 2018 and year 2020 are overlapping. 01.2 Acid, alkaline or salt wastes: Waste quantity year 2020: 8800 tonnes, increasing by 169 %. Explanation: The change has been verified in the facility-level data.
12.7 Dredging spoils: Waste quantity year 2020: 500 tonnes, increasing from 0 tonnes. Explanation: The change has been verified in the facility-level data.
07.4 Plastic wastes: Waste quantity year 2020: 1 200 tonnes, increasing by 69 %. Explanation: The change from year 2018 to year 2020 may be a result of random errors occurring when sampling respondents, since the intervals of uncertainty for the year 2018 and year 2020 are overlapping. 02A* Chemical wastes*: Waste quantity year 2020: 800 tonnes, increasing by 79 %. Explanation: The change origins mostly from two plants that have increased the waste quantities from year 2018 to year 2020. 03.2* Industrial effluent sludges*: Waste quantity year 2020: 300 tonnes, increasing by 454 %. Explanation: The change origins mostly from a single plant that has increased the waste quantity from year 2018 to year 2020. Other waste categories that have increased in quantity are regarded as insignificant. NACE C24-25 The sum of hazardous waste has decreased with 32 000 tonnes, or 15,6 % between 2018 and 2020. The biggest waste category that contributes to this difference is Combustion waste (12.4*), which has decreased with 25 000 tonnes (33 %).
The sum of non-hazardous waste has decreased with 26 000 tonnes, or 3% between 2018 and 2020. The biggest waste category that contributes to this difference is Combustion waste (12.4) that have decreased with 59 000 tonnes (14 %).
EWC 12.4* Combustion wastes continues to decrease and is now 50 200 tonnes. In 2018 the amount was 75 400 tonnes, a decrease with 33 %. The decrease is mainly due to a general decrease at all companies that have a lot of waste of this type.
EWC 03.2* Industrial effluent sludges has decreased by 3 800 tonnes since the previous measurement and is now 7 600 tonnes. In 2018 the amount was 11 400 tonnes, a decrease with 34 %. The change has been verified in the facility-level data.
EWC 02A* Chemical wastes has increased by 3 600 tonnes to 15 900 tonnes since the previous measurement. An increase of 29 %. In 2018, the amount was 12 300 tonnes. The change is verified and ok. If you look at the more long-term trend, the quantities are back to the level from 2014. The quantities therefore do not stand out this year despite this increase. However, the quantities are well below the levels from 2010 and 2012.
EWC 12.6* Soils more than doubled from the previous measurement and are now 4 600 tonnes. It is an increase of 135 %. In 2018 the amount was 2 000 tonnes. The change is verified and is ok.
EWC 03.3* Sludges and liquid wastes from waste treatment has increased significantly since the previous measurement, from 60 tonnes 2018 to 1 470 tonnes 2020. The change is verified and is ok.
EWC 12.4 Combustion wastes continues to decrease and is now 370 700 tonnes. In 2018 the amount was 430 100 tonnes. It is a decrease with 14 %. The change has been verified in the facility-level data.
EWC 12A Other mineral wastes has increased from 35 700 to 60 000 tonnes between 2018 and 2020. It is an increase of 68 %. There are more companies reporting waste of this type this time. One company reports much more waste than before and contribute greatly to the increase.
EWC 10.2 Mixed and undifferentiated materials has continued to decrease. This type of waste has decreased by 21 200 tonnes compared to 2018, and is now 28 300 tonnes. This is a decrease of 43 %. There are fewer companies that have this type of waste 2020 than 2018 which contributes to the reduction.
EWC 06.2 Metallic wastes, non-ferrous increases with 9 000 tonnes to 39 500 tonnes 2020. That is an increase of 30%. There are slightly more facilities in 2020 compared with 2018 that have registered this type of waste. There are also companies that have increased their amount of waste of this type, contributing to the increase. Sometimes it is hard to decide if the waste shall be coded with EWC 6.1, EWC 6.2 or EWC 6.3, therefore it can be of interest to compare the total sum of these three codes. Looking at the total sum of these three codes, the quantity increases from 309 800 tonnes to 319 700 tonnes. It is an increase of 3 %.
EWC 12.1 Mineral waste from construction and demolition has decreased by 5 600 tonnes since 2018 to 7 900 tonnes. That is a decrease of 42 %. The change is verified. This is a type of waste that companies can have a lot of one year and a little of another year.
EWC 12.7 Dredging spoils (dry weight) has increased from 0 tonnes 2018 to 2 400 tonnes 2020. The change has been verified.
EWC 03.3 Sludges and liquid wastes from waste treatment has increased to 1 300 tonnes 2020. The amount 2018 was 100 tonnes. The change has been verified and is ok.
EWC 03.2 Industrial effluent sludges continue to decrease and remain at the low level recorded in 2018. This year, 1 000 tonnes were registered. That is a decrease with 48 %. In 2018 there was 1 800 tonnes. The decrease is due to the fact that fewer companies have registered this type of waste 2020, and each company generally has slightly smaller amounts than before.
All other changes of the amount of waste between 2018 and 2020 have been verified and are ok.
NACE C26-30 This group of industries were previously surveyed regarding data year 2018. Data for year 2020 covers a period when the COVID-19 pandemic was ongoing. Some sectors have because of this suffered more than others in terms of decrease of the economic turnover. It is expected that waste quantities follow the economic development.
The economic turnover in this group of industries has decreased by 8 percent from year 2018 to year 2020. Generated hazardous waste has decreased by 7 percent and generated non-hazardous waste has decreased by 28 percent. The decrease of the waste quantities is verified by several data control steps. The changes are going in different directions for different waste categories.
The waste categories with the largest changes in quantities of generated waste from year 2018 to year 2020 are presented and explained by EWC-Stat category below.
Decreasing quantities of generated waste: The most important waste categories in terms of quantities that have decreased are:
06.1 Metal waste, ferrous: Waste quantity year 2020: 115 900 tonnes, decreasing by 62 %. Explanation: There is a decrease of metal waste as a whole. The waste classification among the EWC-Stat categories 06.1 (Metal waste, ferrous), 06.2 (Metal waste, non-ferrous) and 06.3 (Metallic wastes, mixed ferrous and non-ferrous) may be more uncertain.
12A Other mineral wastes: Waste quantity year 2020: 94 200 tonnes, decreasing by 25 %. Explanation: The change has been verified in the facility-level data.
10.2 Mixed and undifferentiated materials: Waste quantity year 2020: 50 900 tonnes, decreasing by 22 %. Explanation: The change from year 2018 to year 2020 may be a result of random errors occurring when sampling respondents, since the intervals of uncertainty for the year 2018 and year 2020 are overlapping.
01.3* Used oils*: Waste quantity year 2020: 34 500 tonnes, decreasing by 17 %. Explanation: The change from year 2018 to 2020 may be a result of random errors occurring when sampling respondents, since the intervals of uncertainty for the year 2018 and year 2020 are overlapping.
06.2 Metal waste, non-ferrous: Waste quantity year 2020: 7 800.4 tonnes, decreasing by 43 %. Explanation: There is a decrease of the quantities of metal waste as a whole. The waste classification among the EWC-Stat categories 06.1 (Metal waste, ferrous), 06.2 (Metal waste, non-ferrous) and 06.3 (Metallic wastes, mixed ferrous and non-ferrous) may be more uncertain.
07.4 Plastic wastes: Waste quantity year 2020: 5 000 tonnes, decreasing by 50 %. Explanation: The change from year 2018 to year 2020 may be a result of random errors occuring when sampling respondents, since the intervals of uncertainty for the year 2018 and year 2020 are overlapping.
10.2* Mixed and undifferentiated materials*: Waste quantity year 2020: 160 tonnes, decreasing by 97 %. Explanation: The change has been verified in the facility-level data.
12.6 Soils: Waste quantity year 2020: 1 800 tonnes, decreasing by 70 %. Explanation: The change has been verified in the facility-level data.
12.1* Mineral waste from construction and demolition*: Waste quantity year 2020: 600 tonnes, decreasing by 72 %. Explanation: The change from year 2018 to year 2020 may be a result of random errors occurring when sampling respondents, since the intervals of uncertainty for the year 2018 and year 2020 are overlapping.
02A Chemical wastes: Waste quantity year 2020: 2 400 tonnes, decreasing by 22 %. Explanation: The change from year 2018 to year 2020 may be a result of random errors occurring when sampling respondents, since the intervals of uncertainty for the year 2018 and year 2020 are overlapping.
03.2* Industrial effluent sludges*: Waste quantity year 2020: 1 100 tonnes, decreasing by 36 %. Explanation: The change has been verified in the facility-level data.
08A* Discarded equipment*: Waste quantity year 2020: 1 700 tonnes, decreasing by 25 %. Explanation: The change from year 2018 to year 2020 may be a result of random errors occurring when sampling respondents, since the intervals of uncertainty for the year 2018 and year 2020 are overlapping.
07.5* Wood wastes*: Waste quantity year 2020: 660 tonnes, decreasing by 41 %. Explanation: The change from year 2018 to year 2020 may be a result of random errors occurring when sampling respondents, since the intervals of uncertainty for the year 2018 and year 2020 are overlapping.
01.1* Spent Solvents*: Waste quantity year 2020: 240.1 tonnes, decreasing by 59 %. Explanation: The change has been verified in the facility-level data.
01.2 Acid, alkaline or salt wastes: Waste quantity year 2020: 70 tonnes, decreasing by 75 %. Explanation: The change has been verified in the facility-level data.
09.1 Animal and mixed food waste of food preparation and products Waste quantity year 2020: 541, 6 tonnes, decreasing by 23 %. Explanation: The change from year 2018 to year 2020 may be a result of random errors occurring when sampling respondents, since the intervals of uncertainty for the year 2018 and year 2020 are overlapping.
Other waste categories that have decreased in quantity are regarded as insignificant.
Increasing quantities of generated waste: The most important waste categories in terms of quantities that have increased are:
12.6* Soils*: Waste quantity year 2020: 10 072.3 tonnes, increasing by 3 487 %. Explanation: The change has been verified in the facility-level data.
12.1 Mineral waste from construction and demolition: Waste quantity year 2020: 11 046.3 tonnes, increasing by 232 %. Explanation: The change has been verified in the facility-level data.
12.4* Combustion wastes *: There is a change in amount of this waste type, but the waste type is classified as confidential for WStatR 2022 so SMED cannot comment on the statistics.
08A Discarded equipment: Waste quantity year 2020: 1 778.3 tonnes, increasing by 90 %. Explanation: The change from year 2018 to year 2020 may be a result of random errors occurring when sampling respondents, since the intervals of uncertainty for the year 2018 and year 2020 are overlapping.
07.1 Glass waste: Waste quantity year 2020: 1 128.8 tonnes, increasing by 258 %. Explanation: The change has been verified in the facility-level data.
12A* Other mineral waste*: Waste quantity year 2020: 749.0 tonnes, increasing by 180 %. Explanation: The change has been verified in the facility-level data.
03.2 Industrial effluent sludges: Waste quantity year 2020: 349.1 tonnes, increasing by 181 %. Explanation: The change origins mostly from two plants that have increased the waste quantities from year 2018 to year 2020.
Other waste categories that have increased in quantity are regarded as insignificant.
NACE C31-33 Two companies have been removed from SNI 31-33 since the last survey. Those companies have a large amount of waste all together (55 500 tonnes) which affects the total sum of waste. The largest impact can be observed in EWC 06.1, EWC 12A and EWC 10.2, but those companies have waste in a total of 30 EWCs.
The sum of hazardous waste has decreased with 5 600 tonnes, or 39 % between 2018 and 2020. The biggest waste category that contributes to this difference is the Chemical wastes (EWC 02A*), that have decreased with 6 900 tonnes (61.5%).
The sum of non-hazardous waste has decreased with 76 500 tonnes, or 54 % between 2018 and 2020. The waste category that contributes the most to this difference is Other mineral wastes (EWC 12A) that have decreased with 27 000 tonnes (96.1 %).
EWC 12A Other mineral wastes has decreased with 27 000 tonnes, or 96 % between 2018 and 2020. One company with a lot of waste in this category has been removed from this sector and stands for most of the decrease.
Sometimes it is hard to decide if the waste shall be coded with EWC 6.1 Metal wastes, ferrous, EWC 6.2 Metal wastes, non-ferrous or EWC 6.3 Metal wastes, mixed ferrous and non-ferrous, therefore it can be of interest to compare the total sum of these three codes. Looking at the sum of these three codes the quantity decreased from 62 500 tonnes to 17 000 tonnes, a decrease of 73 %. The change has been verified in the facility-level data.
EWC 07.5 Wood wastes has decreased with 7 000 tonnes, or 37 % between 2018 and 2020. The change has been verified in the facility-level data.
EWC 02A* Chemical wastes has decreased with 7 000 tonnes, or 62 % between 2018 and 2020. A few of the companies with large amounts of waste of this type in 2018 reported very low amounts or nothing 2020 for this EWC. This together stands for the decrease.
EWC 10.1 Household and similar wastes has increased with 1 300 tonnes, or 67 % between 2018 and 2020. There are more companies that have this kind of waste 2020 than 2018.
EWC 07.4 Plastic waste has decreased with 650 tonnes, or 37 % between 2018 and 2020. The picture is that many companies together cause the decrease, not a single company.
EWC 12A* Other mineral waste has increased with 650 tonnes between 2018 and 2020. It is an increase by a factor 20. The change has been verified in the facility-level data.
EWC 12.1 Mineral waste from construction and demolition has increased with 550 tonnes, or 114 % between 2018 and 2020. This is a kind of waste that can vary between the years. There has been a large increase at one company 2020.
EWC 01.2* Acid, alkaline or saline wastes has increased with 550 tonnes, or 99 % between 2018 and 2020. It is nearly the same number of companies that have reported this type of waste in 2018 and 2020. The change has been verified in the facility-level data.
EWC 03.3 Sludges and liquid wastes from waste treatment has increased from 0 tonnes 2018 to 500 tonnes 2020. The change has been verified in the facility-level data.
EWC 02A Chemical waste has increased with 475 tonnes, or 59 % between 2018 and 2020. More companies have reported this type of waste 2020 than 2018.
EWC 12.4 Combustion wastes has decreased with 470 tonnes, or 75 % between 2018 and 2020. The change has been verified in the facility-level data.
EWC 08A Discarded equipment (Excl. EWC 08.1 and EWC 08.41) has increased with 409 tonnes, or 283 % between 2018 and 2020. There are more companies that have reported this kind of waste 2020 than 2018.
EWC 12.6 Soils has increased with 333 tonnes, or 422 % between 2018 and 2020. The change has been verified in the facility-level data.
EWC 08.41* Batteries and accumulators waste has increased with 280 tonnes, or 293% between 2018 and 2020. There are more companies that have reported this type of waste 2020 than 2018 combined with one company with a bigger amount of waste of this kind 2020 than 2018.?
EWC 01.1* Spent solvents has increased with 280 tonnes, or 1 716% between 2018 and 2020. The change has been verified in the facility-level data.
EWC 07.5* Wood wastes has increased with 230 tonnes, or 86% between 2018 and 2020. There are more companies that report this type of waste 2020 than 2018.
EWC 09.1 Animal and mixed food waste has decreased with 105 tonnes, or 63% between 2018 and 2020. There are fewer companies 2020 than 2018 with this type of waste. Also, a few companies with much of this type of waste 2018 do not report this type of waste 2020.
EWC 12.1* Construction and demolition wastes has increased with 100 tonnes, or 33% between 2018 and 2020. This is a type of waste that can vary much from year to year at the companies. Changes in the total amount of waste between years are expected.
Other changes within the EWC codes vary but contribute less to the bigger picture and will not be described in detail.
NACE D35 Looking at the big waste streams, compared to 2018, there was a decrease of 4 000 tonnes in EWC-stat 6.1, metal waste, corresponding to 22 %. In EWC-Stat 6.3 metal waste, there was a decrease of 1 200 tonnes. In EWC-stat 7.2 (paper and cardboard waste) there was a decrease of 2 000 tonnes which corresponds to 34 %. There was a decrease of 12 000 tonnes in EWC-Stat 10.2 (mixed and undifferentiated wastes), corresponding to 32 % while in EWC 11(common sludges) there was a decrease of 900 tonnes which correspond to 38 %. In EWC 12.6 (soils) there was a decrease of 5 400 tonnes which correspond to 39 %. The total amount of generated waste decreased by 3 % as compared to 2018.
NACE E36, 37, 39 No major changes, due to that data are largely reused.
NACE E38 Waste collection, treatment and disposal activities; materials recovery; and G46.77 Wholesale of waste and scrap The wastes reported as generated in E38 and G46.77 are to the predominant part secondary wastes generated from pre-treatment and treatment of wastes. The largest uncertainties depend on uncertainties in the interpretation of what is a secondary waste (that has changed properties in the treatment/pre-treatment) and what is waste that has only been stored and transferred (has not changed properties in the treatment/pre-treatment plant).
The explanations to the major changes are in many cases the same for G46.77 as for E38 because the same method and the same data sources are used. A difference between E38 and G46.77, however, is that the calculated scale-up influences G46.77 more since the entire sector is concerned. In E38 only 38.3 is up-scaled (not 38.1-38.2). The facilities investigated in E38 and G46.77 have been taken from the register of environmentally hazardous activities in the Swedish Portal for Environmental Reporting (SMP), operated by the county administrative boards and the Swedish EPA.
Overall, the change in the generation of total non-hazardous waste for NACE E38 has decreased from 6 729 200 tonnes to 5 948 000 tonnes. This is a decrease with 781 200 tonnes (12 %). This decrease seems to be caused mainly by large decreases in the generation of sorting wastes (10.3) metal wastes (6.1, 6.2, and 6.3) mineral waste from waste treatment and stabilized waste (12.8A) and other mineral wastes (12A).
The generation of sorting wastes (10.3) has decreased from 2 649 000 tonnes to 2 365 000 tonnes. This is a decrease by 284 000 tonnes (11 %). This decrease seems to be mainly due to a decrease in the pretreatment of waste.
The generation of metal wastes (6.1, 6.2, 6.3) has decreased from 1 765 500 tonnes to 1 511 000 tonnes. This is a decrease by 254 000 tonnes (24 %). This decrease seems to be mainly due to decreases in secondary generation of metal wastes. The change has been verified in the facility-level reported data.
The generation of mineral waste from waste treatment and stabilized waste (12.8A) has decreased from 767 400 tonnes to 535 000 tonnes. This is a decrease by 232 000 tonnes (30 %). The change has been verified in the facility-level reported data.
The generation of other mineral waste (12A) has decreased from 565 000 tonnes to 471 000 tonnes. This is a decrease by 94 000 tonnes (17 %) The change has been verified in the facility-level reported data.
The total generation of hazardous waste for NACE E38 has increased from 485 000 tonnes to 619 000 tonnes. This is an increase by 134 000 tonnes (28 %). The increase seems to be mainly due to increases in oil waste* (01.3*), chemical waste* (02A*) and wood waste* (07.5*). The generation of mineral waste from oil waste* (01.3*) has increased from 66 000 tonnes to 131 000 tonnes. This is an increase by 65 000 tonnes (99 %). The change has been verified in the facility-level reported data.
The generation of chemical waste* (02A*) has increased from 155 000 tonnes to 205 000 tonnes. This is an increase by 50 000 tonnes (32 %). The change has been verified in the facility-level reported data.
The generation of wood waste (07.5*) has increased from 67 000 tonnes to 113 000 tonnes. This is an increase by 46 000 tonnes (70 %). The change has been verified in the facility-level reported data.
The total generation of hazardous waste for G46.77 has decreased from 35 400 tonnes to 35 600 tonnes. This is a decrease by 800 tonnes (2 %), which can be considered negligible when taken into account the uncertainty in the data.
The total generation of non-hazardous waste for G 46.77 has decreased from 569 400 tonnes to 234 000 tonnes. This is a decrease by 335 000 tonnes (59 %). This decrease seems to be mostly due to large decreases in the generation of metal wastes (6.1, 6.2, 6.3) and sorting wastes (10.3). The decrease has been verified in the facility-level reported data. The generation of metal wastes (6.1, 6.2, 6.3) has decreased from 360 100 tonnes to 145 400 tonnes, this is a decrease of 214 700 tonnes (60 %). This decrease seems to be mainly due to decreases in secondary generation of metal wastes. The change has been verified in the facility-level reported data. The generation of sorting wastes (10.3) has decreased from 116 600 tonnes to 44 500 tonnes, this is a decrease of 71 500 tonnes (62 %). The change has been verified in the facility-level reported data.
NACE F41-43 The total amount 2020 was close to 13.5 million tonnes, compared to 12.5 million tonnes in 2018 and 10.7 million tonnes in 2016. The increase in the total waste, both between 2018 and 2020 and between 2016 och 2020, are larger than expected from the economic development. The largest changes of waste inn F41-43 between 2018 and 2020 are:
Changes in 12.7 and 12.7H Dredging spoils.The amounts of dredging spoils are mostly based on information from the Swedish agency for Marine and Water management, where the following trends have been reported.
The Swedish Agency for Marine and Water Management collects data about all dredging projects in Swedish Coastal waters. The Agency collects data from county councils as a part of the international conventions HELCOM and OSPAR. The figures use to vary a lot from one year to another, depending on the actual dredging projects going on. NACE G-U XG46.77 All fractions of hazardous waste, except 08.1*, have reported major changes. The same goes for the total amount of hazardous waste. This is due to a change in methodology. The new method relies on mandatory reporting by all companies generating hazardous waste. Estimates reported for 2018 and earlier were based on a small sample. In addition, the nonresponse rate was high and no relevant auxiliary information was available, and hence the estimates were uncertain.
This year, no waste has been reported on waste codes 01.2, 02A, 03.2, 08.1, 08.41 or 10.3, although small amounts have been reported previous years. This is due to variations in generation and reporting from few sources. These are also types of waste that are more often reported as hazardous waste.
Similar to the above, 08A The data has been verified at the facility-level.
06.1, 12.4, 12.6 and 12.8A have changed much in ratio but not in amount, due to variations in generation and reporting from few sources.
07.1 Glass wastes has increased due to increase in collected amounts of glass packaging.
07.4 Plastic wastes has decreased much due to smaller amounts of calculated plastic packaging from the sector. The calculation is based on two sets of register data. Those data are developed using different methods and may not correlate, increasing variation between years for this sector.
07.5 wood wastes has decreased much due to new definitions of waste treatment for wood packaging.
10.2 Mixed and undifferentiated materials has increased due to variations in generation and reporting from few sources, in this case ports.
11 Common sludges has decreased considerably, variations in generation and reporting from few sources, in this case ports.
12.1 Mineral waste from construction and demolition has decreased considerably. This is due to large amounts being collected by municipalities that are now considered to actually belong to the construction sector and has not been allocated to this sector this year.
HOUSEHOLDS Major changes in the amount of generated waste from households regarding WStatR2022 compared to WStatR 2020 are listed below:
- The amount of waste collected at the recycling centres has generally increased for almost all bulky fractions, in general at around 10 % or more (e.g. for glass, non-hazardous wood, metal, etc.). The largest increase was seen in generation of Hazardous Wood waste category (07.5) by 21 300 tonnes (or 43 %) compared to WstatR 2020. According to the Swedish waste management association, cleaning and rebuilding of private houses during the pandemic period were among the main reasons for the increased collection of bulky waste at the recycling centres.
- Quantities of lead-acid batteries (08.41 and 08.41 *) have increased by 1 100 tonnes (non-hazardous) and 2 000 tonnes (hazardous) since WstatR 2020 (48 % for hazardous and 43 % for non-hazardous). The increase is probably due to the same reasons as for all bulky waste mentioned above. In addition, the distribution of waste generated by households and operational waste is very uncertain. It could simply be that more waste within professional activities was allocated to the household sector.
- The amount of vegetal waste generated (09.2), which in practice is garden waste collected at recycling centres, has increased to 94 300 tonnes or by 27 000 tonnes compared to WstatR 2020. This may have depended on the weather conditions facilitating more vegetation and partly because of the pandemic related restrictions with households spending more time at home and spending more own time for gardening instead of hiring professionals.
WASTE TREATMENT The major differences in waste treatment between 2018 and 2020 have four main explanations:
Below is an overview of the largest changes observed for the treatment categories Recycling, Other recovery and Disposal and the underlying causes for the observed changes. Recycling here means recovery where the same material is recycled (paper waste to paper, rubber waste to rubber and so on). Other recovery means other recovery operation than recycling and backfilling, and includes energy recovery.
This analysis is based on the statistics of waste treatment excluding treatment of mining wastes (rocks and tailings). This is because those wastes are arisen in huge quantities and will dominate the statistics of waste treatment, especially landfilling, other disposal and material recovery including backfilling. In this analysis the presentation of the waste treatment categories is more detailed than in the WStatR reporting to EU, so biological recovery (composting and anaerobic digestion) and backfilling are presented separately from material recovery. We have also included preparatory treatment which is not included in the WStatR reporting. This has been done to make it easier to do relevant analyses of the development of the waste treatment. It should also be added that the primary data collection is more detailed which leads to, for example, that material recovery is split up into anaerobic digestion, composting, spreading on land, conventional material recycling, recovery as construction material and backfilling. The discussion below is divided into two parts. First, changes in each treatment category are analysed and discussed, and then changes in each waste category (EWC-Stat). It is to a large part the same underlying data, but the data is analysed from two perspectives. Changes in waste treatmentUse as fuel (incineration with energy recovery)The total amount of hazardous waste used as fuel has decreased with 119 000 tonnes between 2018 and 2020. The data has been verified at the facility-level. The total amount of non-hazardous waste used as fuel has increased slightly between 2018 and 2020. There are new incineration facilities that have been taken into operation between 2018 and 2020. Waste incineration facilities also import combustible waste from other countries, for example U.K. and Norway. Incineration of 10.1 Household waste has decreased slightly. The same tendency is reported by Waste Management Sweden who presents statistics on management of municipal waste. There is an increase of 10.2 Mixed and undifferentiated materials, and a decrease of 10.3 Sorting residues. Often the respondents do not differ between those two categories, and report them as business waste, independent if the waste has been sorted and mechanically treated at a waste facility or is only presorted at source. The sum of 10.2 and 10.3 has increased, which is in accordance with an increasing waste incineration capacity in Sweden. A large part of the 10.2 and 10.3 waste is imported waste from other European countries. Incineration on land (incineration without energy recovery)There is a distinct decrease in the amount of incinerated 02A* Chemical wastes. One chemical industry reported 37 900 tonnes of incinerated in 2018 but changed the waste classification to non-hazardous 03.3. It is called “process water” and contains different organic chemicals. In 2018 the total wet weight was accounted, but in 2020 only the dry content. The data has been verified at the facility-level. Backfilling (excluding mining waste)The total amount of backfilled waste has increased with more than 1.7 million tonnes. The largest increases are 06.2 Soil and 12.1 Mineral waste from construction and demolition. Several bigger facilities have reported considerably more 12.6 to backfilling in 2020 than in 2018. There is also a decrease in the amount of materially recovered 12.6 Soils, so some of the changes depend on changes in the classification of the waste treatment. Backfilling become implemented in the Swedish waste legislation in 2018, and this implementation should have influenced how the treatment is classified. Also 12.1 Mineral waste from construction and demolitions has increased between 2018 and 2020. There are several bigger facilities that report backfilling of 12.1 Mineral waste from construction and demolition in 2020, but not in 2018. Also, the total amount of treated 12.1 has increased with about 100 000 tonnes between 2018 and 2020, and there are several bigger facilities that report larger amounts of 12.1 in 2020 than in 2018. There is also an increase in backfilling of 12.8 Mineral waste from waste treatment and stabilized wastes. It is mainly bottom ash and slag from waste incineration. The data has been verified at the facility-level. More than 61 000 tonnes of chemical waste (W02A) is used for backfilling. This waste is "green liquor dredge" (Grönlutslam in Swedish) with LoW code: 03 03 02, a waste product from the paper industry and which can be used in / treated by backfilling. The composition and properties of the dredge are similar to ashes from biofuels. Several tests have shown that the green liquor sludge can be used in this way. In 2020, There are 3 facilities in Sweden that reported backfilling of green liquor dredge.
RecyclingRecycling is here divided into several sub-categories: biological recovery and other recycling including use as construction material. In the following discussion mining wastes are excluded (mining waste may affect the other recycling, including use as construction material) Anaerobic digestion and composting (biological recovery) The total amount of waste treated by anaerobic digestion and composting is increasing. There is a national environmental goal that states: “in 2023 more than 75 percent of food wastes from households, commercial kitchens, shops and restaurants shall be treated biologically so nutrients and biogas can be recovered”. There are also special policy instruments to support this development, for example financial support to new biogas facilities. The total amount of waste to anaerobic digestion and composting has increased between 2018 and 2020. For several wastes there are also tendencies to transfer wastes from composting to anaerobic digestion. Especially 09.1 Animal and mixed food waste is increasing (“food waste” according to the environmental goal is included in 09.1) and especially the amounts to anaerobic digestion are increasing. Material recovery (including recovery as construction material – excluding wastes from mining) In this treatment category we have included mainly the recovery operations R2 – R11, but excluded backfilling (that is a sub-category to R3 and R5). Treatment of mining waste is excluded from this section. Conventional material recycling This category of material recovery includes recycling of waste when the material is recycled to the same material and use, for example metal recycling, paper recycling, plastic recycling and glass recycling. Conventional recycling has decreased between 2018 and 2020. Above all, it is the recycling of 06.1 Metal wastes, ferrous that has decreased considerably. One reason for this decrease is, probably, how the facilities report, or rather do not report, end-of-waste criteria. The metal wastes are usually transported to a sorting plant, which may also include mechanical treatment and storage. It is expected that a large part of the metal waste should fulfil the end-of-waste criteria when leaving the sorting plant. However, only a few facilities have referred to the end-of-waste criteria in their environmental reports. The sorted waste, or material fulfilling the end-of-waste criteria is then transported to steelworks and other metal works, and they do not report it as waste, not even as “end-of-waste scrap”. If the metal waste reaches the end-of-waste stage at the sorting facilities, the recycling should be allocated to the sorting facilities, but in their environmental reports it is not possible to identify when or if the material has gained the end-of-waste stage. Conventional recycling of 07.2 Paper and cardboard wastes has decreased. This decrease is in accordance with the development of the pulp and paper industry. The Swedish Forest Industries Federation reports that the production of recycled pulp decreased from 662 000 tonnes in 2018 to 532 000 tonnes in 2020. Also, the total production of paper and cardboard decreased from 10.4 million tonnes in 2018 to 9.7 million tonnes in 2020. Material recovery of 09.2 vegetal wastes has decreased. Also, the overall treatment of 09.2 has decreased. About 20.000 tonnes were used in 2018 for final landfill cover, and the landfill wasclosed in the end of 2018. Those 20.000 tonnes or corresponding amount in 2020 seem to have disappeared from the waste statistics and cannot be traced to other facilities or other treatments. There are also less quantities treated in the connection to food industry which probably depends on that more residues from the food industry have been classified as by-products in 2020. Material recovery as construction materialMaterial recovery (including recovery as construction material) has decreased. To a part this can be explained by increased backfilling. Backfilling was implemented in Swedish waste legislation in 2018 but was used from 2016 in reporting of construction and demolition wastes. The implementation of backfilling in the legislation should have influenced the respondents (for other wastes than C&D waste) to report backfilling rather than material recovery. However, the difference between material recovery and backfilling is difficult. We have recommendations that state that material recovery as construction material is when the use of waste requires special technical specifications (for example material composition, particle size, hydraulic conductivity and others), and backfilling when it doesn’t matter what material is used. Another challenge, in this context, is that backfilling is a sub-category to R3 (material recovery of organic substances) and R5 (material recovery of inorganic substances). Recovery of construction material is classified as R3 or R5 depending on the waste, and thus backfilling will be a sub-category to use as construction material. The transfer of treatment from material recovery to backfilling is noticeable for 12.6 Soils and 12.6H Soils containing hazardous substances. For both 12.6 and 12.6H there is also an increase in landfilling while the material recovery is decreasing. There are several larger facilities (municipal landfills) that have reported decreased quantities of material recovery as construction material and instead increased quantities of landfilled waste and/or backfilled waste. There are also facilities that have developed the opposite and reported increased amounts to material recovery as construction material and decreased backfilling or landfilling, but they are fewer. Material recovery as construction material of 12.4: There is a change in waste type and treatment combination, but the waste type and treatment combination is classified as confidential. SMED cannot comment on the statistics here, though the change has been verified. Material recovery of 12.6 Soils has decreased but there is a corresponding increase in Backfilling, so this change is mainly explained by the transition from material recover to backfilling, already discussed above in the section about backfilling. Material recovery of 12.6H Contaminated soils has decreased. This decrease seems to be balanced by an almost equal increase in landfilling. This may depend on harder regulations on the management of contaminated soils. Landfilling (excluding mining wastes)Landfilling of non-hazardous waste has increased with about 6% between 2018 and 2020. It is mainly 12.1 Mineral waste from construction and demolition, 12A Other mineral wastes, and 12.6 Soils that have increased. Data for 12.1 and 12.6 are collected in a special C&D waste inquiry, and the data should be reliable. The data has been verified at the facility-level. There is also a decrease of landfilling of 12.4 Combustion residues. The largest differences depend on three steel mills that now report the slag (LoW 10 02 01 and 10 02 02) as by-products which are sold as construction material and others outside the steel mills. The amount of landfilled hazardous waste has increased about 11% between 2018 and 2020. It is mainly 12.6H Soils (excluded mineral waste from mining) that has increased. Data for 12.6H is collected in the special reporting of construction and demolition waste. There are three ordinary landfills that have reported larger amounts in 2020 than in 2018. PretreatmentPretreatment is not reported to Eurostat in WStatR, but in Sweden data about pretreatment is presented. Pre-treatment occurs mainly in NACE 38 and NACE 46.77, and there is a balance between the amount of pre-treatment and the generation of secondary wastes. The largest decreases are 12.1 Mineral waste from construction and demolition. The change has been verified in the facility-level data. Also, the amount of pretreated 06.3 Mixed metals has decreased between 2018 and 2020. The change has been verified in the facility-level data. Treatment of mining wasteThe largest changes in the treatment depends on changed classification of tailings. In 2018 and earlier the tailings were classified as non-hazardous, but in 2020 the facilities have been asked if the tailings are hazardous waste or non-hazardous waste. The amounts of mining wastes often change from one year to another, because it is coupled to the production which is coupled to the economy. The amounts of generated mining waste (rocks and tailings), and the total treatment of mining waste have been checked against production data. Since the amounts of mining wastes are huge, there is a tendency to use both rocks and tailings for construction and backfilling, also backfilling in old mines and pits. Tailings are pre-treated before backfilling in a special process. Changes by waste type
|
||||||||||||||||||||||||||||||||||||||||||||||||||||||||||||||||||||||||||||||||||||||||||||||||||||||||||||||||||||||||||||||||||||||||||||||||||||||||||||||||||||||||||
| 8.2.1. Length of comparable time series | ||||||||||||||||||||||||||||||||||||||||||||||||||||||||||||||||||||||||||||||||||||||||||||||||||||||||||||||||||||||||||||||||||||||||||||||||||||||||||||||||||||||||||
The time series for reference years 2010-2020 are overall comparable, with good comparability among years 2014-2020. Methodological improvements over time may affect the comparability slightly. For some waste types, interpretation of what is a waste or a by-product has been problematic, which may have affected the results somewhat. |
||||||||||||||||||||||||||||||||||||||||||||||||||||||||||||||||||||||||||||||||||||||||||||||||||||||||||||||||||||||||||||||||||||||||||||||||||||||||||||||||||||||||||
| 8.3. Coherence - cross domain | ||||||||||||||||||||||||||||||||||||||||||||||||||||||||||||||||||||||||||||||||||||||||||||||||||||||||||||||||||||||||||||||||||||||||||||||||||||||||||||||||||||||||||
see section 8.5 |
||||||||||||||||||||||||||||||||||||||||||||||||||||||||||||||||||||||||||||||||||||||||||||||||||||||||||||||||||||||||||||||||||||||||||||||||||||||||||||||||||||||||||
| 8.4. Coherence - sub annual and annual statistics | ||||||||||||||||||||||||||||||||||||||||||||||||||||||||||||||||||||||||||||||||||||||||||||||||||||||||||||||||||||||||||||||||||||||||||||||||||||||||||||||||||||||||||
Not relevant. No sub annual or annual waste statistics is produced in Sweden. |
||||||||||||||||||||||||||||||||||||||||||||||||||||||||||||||||||||||||||||||||||||||||||||||||||||||||||||||||||||||||||||||||||||||||||||||||||||||||||||||||||||||||||
| 8.5. Coherence - National Accounts | ||||||||||||||||||||||||||||||||||||||||||||||||||||||||||||||||||||||||||||||||||||||||||||||||||||||||||||||||||||||||||||||||||||||||||||||||||||||||||||||||||||||||||
The same classifications and frames are used in most business surveys and economic statistics at Statistics Sweden. |
||||||||||||||||||||||||||||||||||||||||||||||||||||||||||||||||||||||||||||||||||||||||||||||||||||||||||||||||||||||||||||||||||||||||||||||||||||||||||||||||||||||||||
| 8.6. Coherence - internal | ||||||||||||||||||||||||||||||||||||||||||||||||||||||||||||||||||||||||||||||||||||||||||||||||||||||||||||||||||||||||||||||||||||||||||||||||||||||||||||||||||||||||||
Efforts are made to avoid double counting and data gaps, but it could still occur to a limited extent. There are some discrepancies between total amounts of treated and generated waste. These differences for WStatR2022 have been handled and for the majority of the discrepancies explanations, e.g. amounts of import and export of different waste types, have been found. |
||||||||||||||||||||||||||||||||||||||||||||||||||||||||||||||||||||||||||||||||||||||||||||||||||||||||||||||||||||||||||||||||||||||||||||||||||||||||||||||||||||||||||
|
|||
| 9.1. Dissemination format - News release | |||
Swedish EPA is responsible for dissemination formats, e.g. press releases relating to the publication of the report “Waste in Sweden 2020” as well as the statistics leaflets. Statistics on waste generation, recovery and disposal of waste and the current quality report will be published on the website of the Swedish Environmental protection agency (EPA), when reporting to Eurostat is complete. A report will be published in June 2022, in which the statistical material on waste generation and treatment in Sweden will be presented and discussed. For more details compared to what is presented in the overarching report, statistics leaflets covering waste statistics in specific NACE:s (e.g. NACE F41-43) and waste types (e.g. municipal waste) will also be published on the Swedish EPA:s website. The statistics on waste generation and treatment in Sweden will be available in Statistic Sweden´s public database. The intention for this quality report is to be a resource for more advanced statistical users in order to increase clarity regarding methods and checking procedures. The statistics have been produced according to the Official Statistics Act (SFS 2001:99) and the Public Access to Information and Secrecy Act (SFS 2009:400). Data collection from environmental reports is done according to The Swedish Environmental Code (SFS 2000:61) and EPA ordinance (NFS 2016:8). |
|||
| 9.2. Dissemination format - Publications | |||
Report: Waste in Sweden 2020 will be published by Swedish EPA in June 2022. Leaflets: Information on waste statistics in a number of selected NACE and for different waste types are been published on the Swedish EPA:s website in June 2022. These information leaflets present statistics on common waste types as well as trends in the given NACE:s. These are: - Construction - Electricity, gas, steam and air conditioning supply - Households - Service industry - Construction and demolition wastes - Municipal waste |
|||
| 9.3. Dissemination format - online database | |||
Data tables are published in Statistics Sweden’s public database together with summary tables and figures.
Extract of the waste statistics data is published in data tables on the Swedish EPA´s webpage. |
|||
| 9.3.1. Data tables - consultations | |||
Not applicable. |
|||
| 9.4. Dissemination format - microdata access | |||
Not applicable. Micro data is confidential and no public use files are produced. |
|||
| 9.5. Dissemination format - other | |||
Not applicable. |
|||
| 9.6. Documentation on methodology | |||
The Quality Report is published. |
|||
| 9.7. Quality management - documentation | |||
SMED has its own quality management documentation, which was used during the project. |
|||
| 9.7.1. Metadata completeness - rate | |||
Not applicable. |
|||
| 9.7.2. Metadata - consultations | |||
Not applicable. |
|||
|
|||||||||||||||||||||||||||||||||||||||||||||||||||||||||
Estimates made in WStatR2014 and earlier, indicate an average response burden of 1 hour per respondent in questionnaire surveys. In WStatR2022, environmental reports have been the major data source, and they are not connected to any extra burden for the respondents, as these are mandatory for other purposes than waste statistics. In the case of web surveys, there is an extra burden for the 755 respondents, estimated to 755 hours in total. Since reference year 2020, it is mandatory for facilities to respond to surveys. The response rate as such was therefore significantly higher för WStatR 2022 than it has been previously. Waste producers of hazardous waste should also register amounts of generated hazardous waste in the Swedish hazardous waste register. This register has been a new data source for generated hazardous waste from the service industries (G-U excl. G46.77) in WStatR2022. Since reference year 2016, it is mandatory for facilities that receive construction and demolition waste to report amounts and treatment of received construction and demolition waste, which has increased the burden. The reason was mainly to improve the evaluation of the Waste Framework Directive 2008/98/EC aim to have 70 % of construction and demolition waste recycled by 2020. A contributing reason was also the need of improvement of the quality of the official statistics. SMED has also collected data from organisations and authorities that collect waste data for their own purposes, independently of the WStatR work. This work is not included in Table 11. Table 11. Burden of respondents
[1] 1 h per respondent |
|||||||||||||||||||||||||||||||||||||||||||||||||||||||||
|
|||
Data is treated according to the Public Access to Information and Secrecy Act (2009:400). 11.2. Confidentiality - data treatment The p% rule is used for primary cell suppression. The software TauArgus is used for statistical disclosure control. |
|||
| 11.1. Confidentiality - policy | |||
Data is treated according to the Public Access to Information and Secrecy Act (2009:400). |
|||
| 11.2. Confidentiality - data treatment | |||
The p% rule is used for risk assessment, and the software TauArgus is used to apply primary and secondary cell suppression. Companies that cause unsafe cells have been asked for consent, which has reduced the number of suppressed cells. |
|||
|
|||
No further comments. Annexes on data methods: Annex Description of methods for determining waste generation - overview Annex Waste generation in the economy – sample survey Annex Waste generation in the economy on the basis of information on waste treatment Annex Waste generation in the economy on the basis of models or other methods Annex Determination methods for waste generated by households |
|||
|
|||