|
 |
|
| For any question on data and metadata, please contact: Eurostat user support |
|
|||
| 1.1. Contact organisation | Labour Market Department, Ministry of Finance (as of 2019 the Labour Market Department operates under the Ministry of Innovation and Technology). Quality of Life Statistics Department, Division for Earnings Statistics, Hungarian Central Statistical Office
|
||
| 1.2. Contact organisation unit | Labour Market Department, Ministry of Finance (as of 2019 the Labour Market Department operates under the Ministry of Innovation and Technology). Quality of Life Statistics Department, Division for Earnings Statistics, Hungarian Central Statistical Office |
||
| 1.5. Contact mail address | Labour Market Department, Ministry for Innovation and Technology – 1011 Budapest, Fő utca 44-50. Quality of Life Statistics Department, Division for Earnings Statistics, Hungarian Central Statistical Office – 1024 Budapest, Keleti Károly utca 5-7.
|
||
|
|||
– |
|||
| 2.1. Data description | |||
Hungary has conducted earnings surveys similar to the Structure of Earnings Survey annually, with the reference month of May, for more than 30 years. The earnings survey was modified 20 years ago; the requirements of Council Regulations (EC) No. 530/1999 concerning SES have been fulfilled since 2002. The earnings survey provides information on the charateristics of employers including their main activity code, size, location, the number of employees, collective pay agreement and ownerhsip structure as well as on employees such as their occupation, highest educational attainment, age, sex, contractual working time, working time actually paid and earnings elements.The unit of observation is the local unit. Differently from other countries, SES Hungary has collected earnings data for the reference month of May. It was important to keep May as the reference month as it allowed the Ministry of Finance to use the latest figures in the wage agreement process as early as November or December the same year. Since May was kept as the reference month, annual non-regular payments could not be collected for the reference year, therefore, the non-regular yearly earnings of the previous year were collected. As described in the quality report of SES-2002 in great details this is not a serious setback, because the difference caused by this limitation is certainly less than the sampling error. In 2018 the Labour Market Department of the Ministry of Finance carried out the survey. Similarly to the previuos years, the scope of statistical observation in 2018 included businesses with at least 1 employee, all budgetary organizations and non-profit organizations significant in respect of employment. As previously, the response rate of micro enterprises was much lower than the average response rate, therefore data were only transferred for organizations with at least 4 employees. Business organizations with 1-49 employees were observed on a representative basis. The sampling frame arose from a fixed file extracted from the Business Regsiter. Non-profit organizations siginficant in respect of employment were obeserved, including organizations in NACE branches E, P, Q that were observed fully above 2 employees and organizations in all other bracnhes that were observed fully above 49 employees. Religious organizations that provide primarily faith related services are excempt from obligatory data provision. Budgetary organisations were observed on a full scope basis. The data of the central payroll system were taken over from the Hungarian State Treasury that provided 99% of the data. Three organizations provided data individually. Data for NACE '08 categories B to S (including O) and organizations with at least 5 employees were transferred to Eurostat.
Annexes: Cover_budgetary_organizations_2018 Cover_businesses_2018 Datasheet_budgetary_sector_2018 Datasheet_businesses_nonprofit_2018 |
|||
| 2.2. Classification system | |||
SES 2018 includes variables defined mostly by Eurostat applying classification systems that are harmonized with international classification systems. The Hungarian classifications are translated (FEOR/ISCO, Educational attainment/ISCED, TEÁOR/NACE) according to the official instructions of HCSO. Classifications used: NACE Rev 2.: Business entities, budgetary and non-profit organisations are classified into different categories of NACE Rev 2. according to their main activities. ISCO-08: Employees are classified according to the International Standard Classification of Occupations '08. Data by the occupation of employees are produced by ISCO-08. ISCED11: The highest educational attainment of employees are published according to ISCED11. NUTS: Updated territorial standards for statistical purposes are used. Regional statistics are produced for NUTS1 and NUTS2 breakdown. |
|||
| 2.3. Coverage - sector | |||
Businesses employing at least 1 employee, all budgetary organizations, and selected non-profit institutions are covered by the survey, covering all NACE Rev. 2 sections. Data on organizations in NACE Rev. 2 B-S employing at least 5 employees are transferred to Eurostat. |
|||
| 2.4. Statistical concepts and definitions | |||
Employees: are members of staff who have a legally binding relationship with their employers based on a working contract, regulating that they work at least 60 hours per month for financial compensation. Mean monthly gross earning of the refeince month (May): is the total remunaration paid in cash including contractual wages and other earnings elements paid under different titles to employees regularly each month (such as special payments of shift work or overtime, premiums and bonuses paid each month). However, mean monthly earnings in SES statistics do not include premiums and bonuses not paid regularly. Mean monthly gross earnings include personal income tax, social security payments and labour market contributions. Mean annual earnings: is the total of monthly earnings paid in cash and in kind in the refernce year, including premiums and bonuses paid irregularly - that is not in each pay period - and annual payments in kind paid during the reference year. Annual premiums and bonuses not paid at each pay period: Irregularly paid bonuses, premiums or 13th month salaries that are subsumed within annual gross earnings. Annual payments in kind: include benefits in cash and in kind subsumed in gross annual earnings. Such elements are e.g.: dwelling cost reimbursements, meal vouchers, transport cost reimbursements, reimbursements of costs connected to company car ensured exclusively for own use, jubilee rewards, presents, etc. are collected for the whole year. Mean hourly gross earnings: is the ratio of mean monthy earnings for the reference month and hours paid in the same period. Hours actually paid for the reference month: include all normal and overtime hours consistent with mean monthly earnings. |
|||
| 2.5. Statistical unit | |||
The basic statistical unit of data collection was the legal unit. The basic unit of reporting was the local unit. |
|||
| 2.6. Statistical population | |||
The target population of possible data providers of organizations employing at least 5 employees in NACE Rev. 2 B-S included about 88,000 organizations.
|
|||
| 2.7. Reference area | |||
The reference area is the territory of Hungary. Data of local units outside the territory of Hungary of businesses residing in Hungary are not included. |
|||
| 2.8. Coverage - Time | |||
Data refer to the reference month of May 2018, however, in the case of non-regular bonuses and payments in kind data refer to the year of 2017. |
|||
| 2.9. Base period | |||
Not applicable. |
|||
|
|||
- |
|||
| 3.1. Source data | |||
The source of data is the Earnings survey of individual employees in Hungary. Sampling design: A two-stage sampling design is applied. First stage:
Second stage:
Retention/renewal of sampling units: Every year. Sample size: 9,700 institutions from the budgetary sector and 22,600 business units, altogether 32,300 units. Stratification: The survey is based on stratified probability sample. The criteria for stratification are the following:
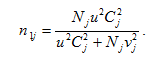
The total samples sizes are determined by taking into account both accuracy demands and cost limitation. Grossing up by simple inflation, the sample sizes for the various strata are determined by where Nj is the size of the stratum, u = 1.96 is the standard normal percentile belonging to the level of confidence 0.95, Cj is the coefficient of variation calculated from data of previous surveys and vj is the relative margin of error (the radius of the relative confidence interval) which we would like not to exceed. Then the percentage sampling rate is given by the formula:
The values of vj are determined in such a way that the sample scheme should correspond to a modified Neyman allocation. |
|||
| 3.2. Frequency of data collection | |||
The survey is conducted once a year. The reference month of the data is May. |
|||
| 3.3. Data collection | |||
The deadline for data collection was 9 November, 2018. Data suppliers could send in their statistics electronically through an online recording system developed by the National Employment Serrvice specifically for this survey. The data of most budgetary organizations were taken over from the Central Payroll Sysetm of the Hungarian Treasury. |
|||
| 3.4. Data validation | |||
The first step of the validation process included the correction of simple coding errors and the inputation of missing codes with the help of an online platform developed specifically for the survey by the National Employment Service. The correction of simple errors included the following steps:
In addition, incorrect data were identified through plausibility checks with the help of predefined algorithms. Possible false data were validated individually by contacting the data provider. The micro validation process was performed from 6 January through 31. May 2019.
|
|||
| 3.5. Data compilation | |||
After the micro validation process, sampling weights were determined for the data. In the case of business units employing less than 50 employees, where data suppliers are subject to representative sampling by HCSO, we apply a two-step weighting procedure. First, data are estimated by a weight figure defined by dividing the number of all employees by the number of employees included on the data sheet of a given organization. (As a rule, businesses with less than 50 employees have to provide data on every employee. However, they have to exclude those who were absent for more than three days in the reference month not to distort earnings data.) In the second step estimations are made by assigning a second weight to each individual. The second correction weight is the reciprocal of the sampling ratio where the sampling ratio is the ratio of the total number of employees in a given size band provided by HCSO and the number of employees we received data for in that size band. If, for example, on the basis of a 5% sampling ratio, we assign a multiplier of 1:0.05=20, this means that the individual represents 20 members of the total population and similarly a sampling ratio of 8.25% implies a weight of 12. Business organizations with more than 50 employees and a small part of government institutions provide data only on a selected part of their employees. In their case the weight figures are defined by dividing the number of all employees of the organization by the number of employees included in the sample. The same procedure is applied to the budgetary sector data we receive from the central payroll system. Before the finalisation of the data file, the values were also compared with the results of the institutional monthly earnings data of HCSO. Data processing of 2018 data was completed in April 2020. |
|||
| 3.6. Adjustment | |||
No adjusments were applied. |
|||
|
|||
– |
|||
| 4.1. Quality assurance | |||
The Ministry of Finance does not not have specific quality objectives regarding statsitical surveys defined by a decree or a policy. |
|||
| 4.2. Quality management - assessment | |||
To secure the accuracy of data the Labour Market Department developed a specific data collection and validation system that aimed at improving data quality. An electronic data recording platform was developed in 2014 that simplified the data upload function and incorporated a new data entry checking system inlcuding global and plausibilty checks. Since 2015 all data have been sent electronically and the program is increasingly user friendly. THe department maintained close contacts with payroll software developers and consulted with them on systematic errors in the delivered survey data to filter out possible programming errors. During the data collection process the department provided assistance to data suppliers. The average response rate for the survey was 55% in 2018, however it reached 65% exlcuding businesses under 5 employees. Errors due to the sampling error have been measured by the relative standard error. If the standard error of a cell was between 10% and 20%, the number is marked by '*'. However if the standard error is larger than 20%, the cell is marked '**' and data are not published. The survey data were compared with the institutional earnings data of HCSO as part of the annual validation process. There are not known serious quality problems.
|
|||
|
|||
- |
|||
| 5.1. Relevance - User Needs | |||
|
|||
| 5.2. Relevance - User Satisfaction | |||
User satisfaction is not evaluated through a specific survey, however the Department collected feedback concerning the data from the users. In most cases regular and the specific requests could be satsified, the only occasional limits were the rules of data protection. |
|||
| 5.3. Completeness | |||
SES-2018 is complete and contains all compulsory variables required by Commission Regulation 1738/2005. In 2018 all necessary breakdowns were provided (NACE, ISCO, ISCED, NUTS), the transcoding was made on the required levels (NACE Rev. 2 classes, ISCO-08 first digit, ISCED 0-6 and NUTS level 1). SES-2018 Hungary is completely comparable on EU level. The Hungarian survey uses May as the reference month instead of October, however, this doesn’t cause serious limitations. Annual non-regular bonuses, premiums and 13th month salaries and payments in kind are reported for the year preceeding the reference year. The survey is conducted every year, all surveys are conducted according to EU regulations. |
|||
| 5.3.1. Data completeness - rate | |||
Data completeness rate was not computed. |
|||
|
|||
No seasonal adjustment applied. |
|||
| 6.1. Accuracy - overall | |||
Although the response rate is satisfactory, non-response is the main source of errors biasing data. The under-coverage of the survey population is rather small because the online connection between HCSO’s Business Register and the Registry Court assures a reliable sampling frame. Over-coverage is not calculated, however it is low. As described under point 3.1. in details, a two-stage sampling design is applied in the survey. Due to the sampling procedure data may be subject to random deviation, that is sampling error. |
|||
| 6.2. Sampling error | |||
Due to the probability sampling method, there is no systematic bias in the estimations. |
|||
| 6.2.1. Sampling error - indicators | |||
The coefficients of variation for monthly and hourly earnings of full-time and part-time employees, according to the breakdowns required by Council Regulation (EC) No 530/1999 were computed and presented in Attachments C and D. The CVs are relatively high because the dispersion of wages is much bigger among individuals than in the case of company averages. Annexes: CV_monthly_earnings_FT_2018 CV_monhtly_earnings_PT_2018 CV_hourly_earnings_FT_2018 CV_hourly_earnings_PT_2018 |
|||
| 6.3. Non-sampling error | |||
The main sources of the non-sampling errors for labour data are non-response and coverage errors. |
|||
| 6.3.1. Coverage error | |||
Both under- and overcoverage are small.
The Business Register of HCSO has direct online connection with the registry court in Hungary. The register is updated daily, however, possible under- or over coverage may occur because the birth, merger and demerger of business units.To avoid under- or over coverage to the possible rate, we use the latest updated version of the sampling frame.
Under- or over-coverage may occur because of misclassification of the number of employees by size bands. Multiple listing is not known. |
|||
| 6.3.1.1. Over-coverage - rate | |||
The over-coverage rate was not calculated in 2018. . |
|||
| 6.3.1.2. Common units - proportion | |||
Multiple listing is not known. |
|||
| 6.3.2. Measurement error | |||
In the survey measurement errors are mainly reporting errors. The most important sources of measurement errors include:
In the validation process measurement errors are checked, validated and if necessary corrected by the data providers.
|
|||
| 6.3.3. Non response error | |||
The survey is part of the annual National Programme of (mandatory) Statistical Reports. It is compulsory for all firms over 50 employees, for all budgetary institutions and for firms in the business sector with less than 50 employees which were selected for the sample. In spite of obligatory reporting, however, a number of business units including some larger companies do not respond to the survey. |
|||
| 6.3.3.1. Unit non-response - rate | |||
In 2018 the response rate in the business sector was 65% in case of organizations with at least 5 employees. In case of micro organizations (of those under 5 employees) , the response rate was much lower (around 11%). In the case of larger business units (above 250 employees) the response rate was between 80-99%, the highest is in the largest size bands.
Using arrival lists data are collected from the most important respondents by calling them on the phone. The lack of capacity limited these efforts.
In the budgetary sector the response rate reached 99.9% in 2018, thanks to the well functioning central payroll system. The non-response rate causes biases concerning the total number of employees and their distribution by size bands, but these biases affect the estimates of monthly or annual earnings and hours paid to a limited extent, which are the most important variables of the survey. |
|||
| 6.3.3.2. Item non-response - rate | |||
A general item non-response rate is not calculated. Although item non-response rate was low in the case of most variables in 2018, it was higher than the average related to the highest educational attainment which was missing in 9% of the cases. Missing values were inputed by contacting data suppliers again or on the basis of predefined algorithms. |
|||
| 6.3.4. Processing error | |||
The number of processing errors are not monitored. |
|||
| 6.3.4.1. Imputation - rate | |||
The imputation rate was not computed. |
|||
| 6.3.5. Model assumption error | |||
Model assumptions are not used for the survey. |
|||
| 6.4. Seasonal adjustment | |||
No seasonal adjustment was applied. |
|||
| 6.5. Data revision - policy | |||
There are no planned revisions. |
|||
| 6.6. Data revision - practice | |||
No revision took place concerning 2018 data. |
|||
| 6.6.1. Data revision - average size | |||
No revisions took place concerning data of 2018. |
|||
|
|||
– |
|||
| 7.1. Timeliness | |||
Respondents were informed about the survey in November 2017 after the National Statistical Council accepted the National Data Collection Program. Key data collection dates in 2018 were as follows:
Post collection phases:
SES data production:
|
|||
| 7.1.1. Time lag - first result | |||
First and final results were published in July 2020. The time lag between the first result and the reference period was 27 months. The exceptionally long period between data collection and first results were due to a major reorganization of the central administration which affected the survey as well. The management of the Earnings survey of individal employees was taken over by the HCSO in May 2020. |
|||
| 7.1.2. Time lag - final result | |||
First and final results were published in July 2020. The time lag between the final result and the reference period was 27 months. |
|||
| 7.2. Punctuality | |||
Deadlines for data delivery and publication were delayed regarding the 2018 data due to a major reorganization of the Ministry of Finance in the course of which the Earnings survey was taken over by the HCSO. The changes in the management of the survey and the pandemic situation in 2020 delayed the transfer of the SES data and the Quality Report somewhat as well. |
|||
| 7.2.1. Punctuality - delivery and publication | |||
Deadlines for data delivery and publication were delayed due to the reorganization of the government administration and the take over of the survey by the HCSO. Data delivery to Eurostat was also delayed by the increased number of data reuqirements in the pandemic situation. |
|||
|
|||
SES data are produced compiling survey and administrative data, however the data are coherent. Within Hungary the same statistical concepts and calculation methods are applied over all of its territory. The national concepts, terms and definitions are almost fully harmonized with the international classifications and the SES regulations. The classification by economic branches corresponds with the NACE coding system generally used in the EU. The Hungarian classification of occupations (FEOR'08) is harmonized with ISCO'08, transcoding is possible on the two and three-digit levels. The classification used regarding the highest educational attainment in the survey was transcoded to ISCED (0 to 6). All sources of data are of full regional coverage. There are no difficulties concerning the geographical comparability, internationally accepted NUTS categories are used. Comparibility over time is also assured: data are collected with the same methodology since 2002.
|
|||
| 8.1. Comparability - geographical | |||
The definition of the variables and classifications of the SES survey in Hungary are harmonized with the requirements of EU regulations. Therefore, Hungarian SES data are comparable on the EU level.
|
|||
| 8.1.1. Asymmetry for mirror flow statistics - coefficient | |||
Not calculated |
|||
| 8.2. Comparability - over time | |||
SES data in Hungary are comparable since 2002 except for data by occupations and NACE classes. The Hungarian survey was harmonized with EU regulations concerning SES in 2002. The scope of the survey was extended, new variables were introduced. However, when the ISCO and NACE classifications changed, data were not revised retrospectively and were not published according to the new classification systems. |
|||
| 8.2.1. Length of comparable time series | |||
The structure of the survey has not changed since 2002, therefore comparability is assured since then for most of the breakdowns (such as regional, gender, age, ownership). However, as new NACE codes were introduced in 2008 comparisons between SES-2006 and SES-2010 SES-2014 and SES-2018 data broken down by industry is not possible. In 2011 new ISCO codes were introduced, therefore the comparision of SES-2014 and SES-2018 data with SES-2006 and SES-2010 data is limited. |
|||
| 8.3. Coherence - cross domain | |||
The comparability of the survey results are confronted with the main outcomes of the labour market surveys based on businesses. Regarding 2018 data, gross monthly mean earnings and the number of employees were compared with the results of the Institutional earnings survey and earnings data collected on the level of local units were confronted with the annual earnings survey. The cross domain coherence of labour data was satisfactory. |
|||
| 8.4. Coherence - sub annual and annual statistics | |||
– |
|||
| 8.5. Coherence - National Accounts | |||
According to Commission Regulation 698/2006 the coherence regarding the compensation per employees between SES and SNA-based figures are presented. The results can be found in the tables below. The possible explanations for the difference between the two sources can be as follows:
Annexes: SES_SNA_2018 |
|||
| 8.6. Coherence - internal | |||
Not relevant. |
|||
|
|||
– |
|||
| 9.1. Dissemination format - News release | |||
Not relevant, no press release was published. |
|||
| 9.2. Dissemination format - Publications | |||
a) For the open public: some of the most important results are accessible for the public, free of charge, on the website of the National Employment Service under the following link: https://nfsz.munka.hu/tart/stat_egyeni_berek b) For govenment organizations, trade unions and employers' organizations the results of model computations to prepare negotiations on minimum wage decisions and macro level wage agreements were also computed and were made available c) For selected important users (social partners, HCSO, Regional Labour Centres, universities, research institutes, ministries, libraries) a predefined set of tables are produced since 2002 that are available on request. |
|||
| 9.3. Dissemination format - online database | |||
Microdata are not accessible online. |
|||
| 9.3.1. Data tables - consultations | |||
Consultations for data users are offered if required. The number of consultations are not reported. |
|||
| 9.4. Dissemination format - microdata access | |||
Microdata for 2018 are accessible through the HCSO's system. In HCSO the following four data access channels are available only for researchers for scientific purposes. The HCSO performs a researcher accreditation procedure for all data requests for these four data access channels. The HCSO offers access to deidentified microdata sets for scientific purposes in the safe environment of the Safe Centre operated by the HCSO in Budapest. The offers access to deidentified microdata sets for scientific purposes in the safe environment of the remote access points operated by the HCSO under the same access conditions as the Safe Centre access. For scientific purposes, the HCSO produces the requested research outputs inside its own safe environment based on the specifications/syntax files provided by the researcher. By using this data access channel the HCSO provides anonymised microdata sets for the researcher for scientific purposes.
|
|||
| 9.5. Dissemination format - other | |||
No other format. |
|||
| 9.6. Documentation on methodology | |||
Methodological comments and explanations are attached to the data and the tables we disseminate or publish. |
|||
| 9.7. Quality management - documentation | |||
There is no special quality management related to documentation. |
|||
| 9.7.1. Metadata completeness - rate | |||
Not calculated. |
|||
| 9.7.2. Metadata - consultations | |||
Consultations for data users are offered if required. The number of consultations is not reported. |
|||
|
|||
The total costs associated with the collection and production of the survey amounted to about HUF 30,000,000 that is about EUR 93,000 in 2018. |
|||
|
|||
- |
|||
| 11.1. Confidentiality - policy | |||
At European level:
At national level:
|
|||
| 11.2. Confidentiality - data treatment | |||
HCSO ensures confidentiality for all the data reported by data providers and the exclusive use of the data for statistical purposes. HCSO disseminates only aggregated data in full compliance with the rules of confidentiality. Individual data, as well as aggregated data consisting of fewer than 3 enterprises are regarded as confidential and therefore not published. Researchers have access to de-identified data sets and to anonymised micro data for scientific purposes with appropriate legal and methodological guaranties in place. As for the employees, they can work with datasets in their competence with registered and controlled access rights. For details see the information on confidentiality for data providers on the website of HCSO. |
|||
|
|||
The required results for tabular analyses are attached in Attachments A and B. The distributions of full-time (FT) employees and part-time (PT) employees are provided separately according to the required breakdowns. Annexes: Distribution_of_full_time_employees_2018 Distribution_of_part_time_employees_2018 |
|||
|
|||
|
|||