Archive:Urban Europe — statistics on cities, towns and suburbs — working in cities
- Data extracted in February–April 2016. Most recent data: Further Eurostat information, Main tables and Database.

(%)
Source: Eurostat (lfsa_pgauws)

(%)
Source: Eurostat (lfst_r_ergau)
(%)
Source: Eurostat (met_lfe3emprt)

Source: Eurostat (urb_cfermor), (urb_clma) and (urb_cpop1) and Swiss Federal Statistical Office

Source: Eurostat (urb_ceduc), (urb_clma) and (urb_cpop1)
(%)
Source: Eurostat (edat_lfs_9913)
(%)
Source: Eurostat (urb_percep) and (urb_cpop1)

(% of total)
Source: Eurostat (urb_ctran)

(% of total)
Source: Eurostat (urb_ctran) and (urb_cpop1)

(minutes)
Source: Eurostat (urb_ctran)

(minutes)
Source: Eurostat (urb_ctran) and (urb_cpop1)
(hours)
Source: INRIX 2015 Traffic Scorecard (http://inrix.com/scorecard/key-findings-us/#key-findings-europe)

Source: INRIX 2015 Traffic Scorecard (http://inrix.com/scorecard/key-findings-us/#key-findings-europe)

(% of total employment)
Source: Eurostat (urb_ctran) and (urb_clma)

(% of total employment)
Source: Eurostat (urb_ctran) and (urb_clma)

(thousands)
Source: Eurostat (urb_ctran)
(persons)
Source: ISTAT (http://gisportal.istat.it/bt.flussi/)
This chapter is part of an online publication that is based on Eurostat’s flagship publication Urban Europe — statistics on cities, towns and suburbs (which also exists as a PDF).
Definitions of territorial units
The various territorial units that are presented within Urban Europe — statistics on cities, towns and suburbs are described in more detail within the introduction. Readers are encouraged to read this carefully in order to help their understanding and interpretation of the data presented in the remainder of the publication.
The European Union’s (EU’s) cities, towns and suburbs provide a high proportion of the total number of jobs that are available in the economy at large. This pattern has been apparent since the industrial revolution when the population started to move from the agricultural labour force to look for/take-up job opportunities within close proximity of expanding industrial centres. It subsequently continued as some cities developed into post-industrial employment hubs with a prevalence of service-based activities. The service sector is today, by far, the most important source of employment in urban areas of the EU; this is particularly the case in some of the largest, western European cities; for example, services account for over 90 % of employment in Paris (France) or Inner London (the United Kingdom).
Knowledge-intensive services attract highly-qualified staff, providing a stimulus for growth
Those cities which attract knowledge-intensive services — such as professional, financial or computer services — are likely to require more highly-qualified staff; this often means they have greater productivity and salaries, which may in turn drive economic growth at the regional or local level. On the other hand, cities which fail to attract knowledge-intensive services may have their labour markets characterised by lower skills/qualifications — for example, within the retail sector, back-office functions, or proximity services — and this may result in fewer employment opportunities and lower rates of economic growth.
Jobs tend to be concentrated in urban areas, but some cities are characterised by considerable income inequalities and urban deprivation
Although urban areas have the highest concentration of job opportunities, it is nevertheless relatively commonplace to find large numbers of marginalised people living in cities. This is particularly true in western and southern Europe, where cities are often characterised by jobless households and urban deprivation (more information on poverty and social exclusion in cities is presented in Chapter 12). Furthermore, the working poor who remain in the labour force may also face considerable difficulties, insofar as income inequalities are generally wider in cities than in rural areas, while the low-paid are unlikely to be able to afford to live in affluent areas near to city centres and instead occupy dwellings in more peripheral locations and thereby spend more time and money commuting to work — further reinforcing patterns of inequality.
Main statistical findings
Working life
In 2014, there were almost 210 million persons aged 20–64 who were employed in the EU-28. Figure 1 shows their working status by degree of urbanisation. A somewhat lower proportion of the men aged 20–64 who were living in EU-28 cities were employed (74.2 %) when compared with the corresponding shares for either towns and suburbs (75.6 %) or rural areas (75.3 %). On the other hand, a higher proportion (64.2 %) of the total number of women aged 20–64 living in EU-28 cities were in employment when compared with the shares recorded among women in towns and suburbs (63.3 %) or rural areas (62.3 %).
The EU-28 employment rate (again for people aged 20–64) was 69.2 % in 2014. An analysis by degree of urbanisation shows that employment rates were considerably higher in cities compared with rural areas in Bulgaria, Slovakia, Hungary and the Baltic Member States. By contrast, some of the other EU Member States were characterised by recording their lowest employment rates in cities; this was the case, for example, in Belgium, Germany, the Netherlands, Austria, Sweden and the United Kingdom.
As such, there was a considerable difference in labour market characteristics: in the eastern EU Member States it was commonplace to find higher employment rates and earnings in cities, coupled with lower levels of poverty, thereby contributing a considerable pull-effect from rural to urban areas. In western parts of the EU, people living in cities often faced higher levels of deprivation and social exclusion, lower employment rates and lower levels of income (than those people living in towns and suburbs or rural areas).
Overall employment rates in the EU Member States are strongly influenced by female participation
In most northern and several western EU Member States, women make a significant contribution to higher overall employment rates; this was particularly the case in the Nordic and Baltic Member States, as well as in Germany, Luxembourg, the Netherlands and the United Kingdom (see Figure 2). In most of the southern and eastern Member States there was a relatively low proportion of women in work, with the highest rates of female labour market participation often recorded in cities, towns and suburbs. This may, at least in part, reflect increased social mobility in urban areas that broadens the range of potential occupations available to women, in contrast to more traditional lifestyles in rural areas where women may continue to run the household/provide family support (both to children and older relatives). Indeed, no more than half of the working-age women living in the rural areas of Bulgaria, Greece, Spain, Croatia, Italy and Malta were in employment. The largest differences in female employment rates between cities and rural areas were recorded in Bulgaria — where the employment rate for women in cities was 18.5 percentage points higher than that for rural areas in 2014 — followed by Lithuania (10.7 points), Spain (10.1 points), Croatia (9.8 points) and Hungary (7.8 points).
Some of the lowest male employment rates were recorded in the cities of southern and eastern EU Member States. The lowest rate was recorded for cities in Greece (59.2 %), while male employment rates were in the range of 65–70 % for those living in the cities of Spain, Croatia, Italy, Portugal and Slovenia, as well as Belgium.
Relatively low employment rates were often recorded for the metropolitan regions of southern Europe
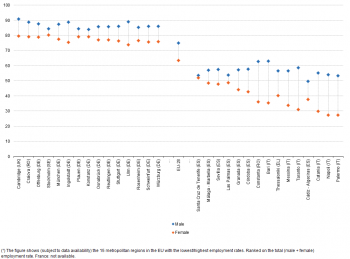
In 80 out of the 237 metropolitan regions for which data are available (no data for France), the employment rate was below the EU-28 average (69.2 %) in 2014. Some of the lowest employment rates were confirmed in southern and eastern EU Member States, as all 23 Spanish metropolitan regions and all but one metropolitan region in Romania — Craiova being the exception — recorded employment rates that were below the EU-28 average; this was also the case in 13 metropolitan regions from each of Italy and Poland.
In 2014, the lowest male employment rate (49.6 %) was registered in the south of Spain in Cádiz - Algeciras, the only metropolitan region in the EU where less than half of the male working-age population was in employment. The lowest female employment rates — where rates fell below 30 % — were recorded in southern Italy, for example, in Napoli and the two Sicilian cities of Catania and Palermo. There were also relatively low female employment rates in some of the metropolitan regions in southern Spain, as well as the Canary Islands (also Spain), Thessaloniki (Greece) and Constanța (Romania).
At the other end of the scale, the metropolitan region with the highest (85.1 %) employment rate in the EU was Cambridge (in the United Kingdom), where the male employment rate peaked at 90.9 % — also the highest in the EU. The highest female employment rate was recorded in the Swedish metropolitan region of Stockholm, at 80.3 %. Aside from Cambridge, Craiova and Stockholm, the remaining metropolitan regions with the highest employment rates were all located in Germany, with the majority from the south of the country, including Stuttgart and München.
Relatively high female employment rates were recorded in several cities in the south of the United Kingdom
Relatively young people may be more inclined to take spontaneous decisions to change their job, or show more flexibility if they have to move to secure a new post; this is particularly true when young people live alone or have yet to start a family. Recent evidence appears to suggest that a growing share of young people decide to postpone starting a family in order to complete their studies and to subsequently get a foothold on the jobs ladder; note that Figure 8 in Chapter 8 provides information on those cities with the highest proportion of mothers giving birth when aged 35 and over.
In 2013, some of the lowest crude birth rates were recorded in cities characterised by their elderly population — for example, Sanremo (Italy) — while some of the highest crude birth rates were recorded in cities characterised by relatively young populations, for example, the suburbs around the French capital of Paris.
Aside from delaying childbirth, cultural differences/attitudes may explain some of the differences in female employment rates between EU Member States. Seven of the top 10 cities with the highest female employment rates were located in southern and central England, including: Fareham, Exeter, Mansfield, Basingstoke and Deane, Chelmsford, Warwick and Dacorum (all data for the United Kingdom refer to 2014). The 10 highest female employment rates in European cities were completed by Friedrichshafen (on the shores of Lake Constance in southern Germany), Tartu (the second largest city in Estonia) and Utrecht (in the centre of the Netherlands). The lowest female employment rates were recorded in Italian cities (2011 data), including Napoli and its northern suburb of Giugliano in Campania, Catania and its northern suburb of Acireale, and Barletta in northern Apulia.
The availability and cost of childcare provision is another factor that may impact upon employment rates, particularly for women; Figure 5 contrasts the share of children aged 0–4 in day care with female employment rates. At one extreme, most of the cities in Norway (2011 data) were characterised by high female employment rates and high shares of young children in day care, while the opposite was true in cities such as Telde, Arrecife and Santa Lucía de Tirajana (in the Canary Islands, Spain; 2012 data) or Karviná, Most, Ústí nad Labem (in the Czech Republic; 2011 data). By contrast, there were cities that had relatively low female employment rates, but high shares of children aged 0–4 in day care (for example, the Spanish city of Granada, Spain; 2012 data), or relatively high female employment rates, but low shares of children aged 0–4 in day care (for example, the Czech capital of Praha; 2011 data).
In cities, more than one third of the population aged 25–64 had a tertiary level of educational attainment
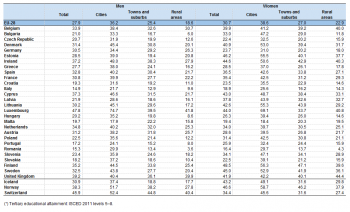
In 2014, almost one third (29.3 %) of the EU-28 population aged 25–64 had a tertiary level of educational attainment (ISCED 2011 levels 5–8). An analysis by sex and by degree of urbanisation shows that a considerably higher proportion of those living in cities — 36.2 % of men and 38.6 % of women — possessed a tertiary level of educational attainment; corresponding shares for people living in towns and suburbs and rural areas were below the overall EU-28 average.
The highest share of the working-age population (defined here as those aged 25–64) living in a city and in possession of a tertiary level of education was recorded in Luxembourg (74.7 % of men and 69.1 % of women). Germany, Greece, the Netherlands and Romania were the only other EU Member States to record a higher share of working-age men (rather than women) with a tertiary level of educational attainment among those living in cities; the same was true in Switzerland. On the other hand, for cities in the Baltic Member States, Bulgaria, Slovenia and the Nordic Member States the proportion of women with a tertiary level of educational attainment was much higher than the corresponding share for men; this pattern was repeated in most of the remaining EU Member States (although to a lesser degree). Information for individual cities and the shares of their working-age populations who are in possession of a tertiary level of education is provided in Chapter 5 on smart cities.
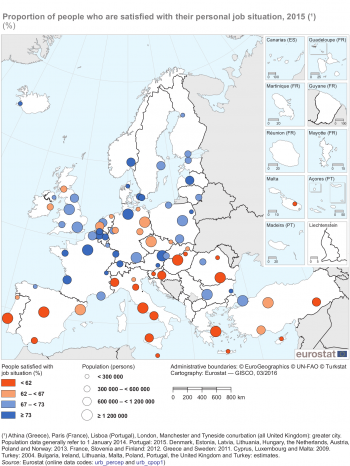
Map 1 provides information from a perception survey on the quality of life in 79 European cities. It shows that in 2015 the highest proportion (85 %) of city-dwellers who were satisfied with their personal job situation was recorded in Graz (the second largest city in Austria), while relatively high degrees of satisfaction were also recorded in the Austrian capital of Wien (79 %), the Danish capital of København (78 %), the western French city of Rennes (also 78 %) and the Belgian capital of Bruxelles/Brussel (77 %). By contrast, the lowest level of satisfaction (44 %) was recorded in the heavily industrialised city of Miskolc (north-east Hungary), while the Greek capital of Greater Athina (45 %) and the Hungarian capital of Budapest (49 %), along with Piatra Neamț (eastern Romania; also 49 %) were the only other cities where less than half the population declared they were satisfied with their personal job situation.
Commuter flows
Congestion leads to wasted time and associated economic and environmental costs in many European cities (for both individuals and enterprises). In an effort to encourage commuters to use public transport services, a few cities have experimented with the introduction of congestion charges and/or restrictions on polluting vehicles; these are primarily designed to discourage the use of roads at peak periods, for example: Milano (Italy), Valletta (Malta), Stockholm (Sweden) and central London (the United Kingdom). By freeing-up road space, policymakers hope to be able to reduce emissions, run more efficient public transport services, encourage sustainable modes of transport, and increase the safety of cycling/walking.
Public transport was the most common form of transport for commuting to work in some of the EU’s largest cities
The share of people who use public transport to get to work is generally much higher in the EU’s largest cities and in its capital cities, where integrated transport networks are based on rail, underground/metro, bus/tram services. At the start of 2013, Tallinn (the Estonian capital) became the first in the EU to provide free public transport services to all local inhabitants. On the other hand, in provincial cities, towns and suburbs the use of private motor vehicles tends to be the principal mode of transport for getting to work, with public transport systems sometimes underdeveloped or virtually non-existent.
Car use is relatively low in some of Europe’s biggest cities: this is particularly true in capital cities where a wide range of public transport services are generally on offer to provide relatively cheap and efficient transport alternatives. For example, in the French capital of Paris, the share of people going to work by public transport was 69.4 % in 2011, compared with a national average of 17.8 %. In a similar vein, the share of people commuting to work by public transport in the Portuguese capital of Lisboa (45.0 %) was some 31.8 percentage points higher than its national average.
As people move towards the periphery of big cities, or to smaller towns and suburbs, it is common to find that their dependence on the car as a preferred means of transport increases. For example, the share of people using a car to get to work was 18.3 percentage points higher among those living in Greater Manchester (71.1 %) than it was for people who lived in its centre (52.8 %); this pattern was also repeated for the other cities shown in Figure 6.
Given the considerable distances that may be involved, it is often problematic for commuters living in the biggest cities to go to work by foot. However, in smaller cities that have relatively compact centres, it is increasingly common to find a relatively high proportion of journeys to work being made by foot or by bicycle. Among the selected EU Member States shown in Figure 7, the highest national shares of journeys to work by foot in 2011 were recorded in Ruse (Bulgaria), Weimar (Germany; 2012 data), Poitiers (France; 2010 data) and Póvoa de Varzim (Portugal) — all of which are relatively small cities.
Those working in capital cities often faced the most lengthy journey times to work …
Based on the limited information shown in Figure 8, it would appear that the inhabitants of capital cities often had the longest journeys to and from work (in terms of the average time taken); this may reflect generally higher congestion in major cities, or the greater distances that might be involved when commuters have to cross large, dense cities to get to and from work. Those living in and around the EU’s biggest cities can spend a considerable amount of their lives commuting between home and work (and vice-versa). For example, commuters in Paris spent an average of 39 minutes for their journey time to work (2010 data). This pattern was apparent across much of the EU, with commuters in the Bulgarian capital of Sofia taking, on average, almost 20 minutes more to get to work than the national average, while the additional time required for commuting to work in the French and Portuguese capitals was almost as high (around 17 additional minutes).
Figure 9 shows that the average time taken for the journey to work was often linked to the size of a city; this relationship was particularly apparent in Germany (2012 data). Note also the relatively lengthy journey times to work for a number of relatively small Spanish and French cities (satellites/new towns within the larger metropolitan regions of their capitals), for example, Leganés, Móstoles and Parla around Madrid, or Marne la Vallée, Saint-Quentin en Yvelines, and Communauté d’agglomération Europ ’Essonne around Paris (all 2010 data).
… and some of the longest delays for traffic congestion
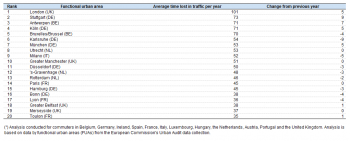
Tables 2 and 3 provide an indication of the average time lost in traffic congestion within functional urban areas (cities and their commuting zones) for some of the EU’s biggest cities; note the analysis was only conducted for 12 EU Member States, see Table 2 for details of coverage. In 2015, the most congested functional urban area was London, where commuters lost an average of 101 hours as a result of being stuck in traffic (equivalent to more than four whole days). There were also relatively high levels of congestion — at least 70 hours lost in traffic — in the Belgian cities of Bruxelles/Brussel and Antwerpen, and the German cities of Köln and Stuttgart.
More specific information on the five most congested corridors in selected EU Member States is provided in Table 3. In those Member States where the capital city is dominant and the pattern of urban development may be described as monocentric (for example, France and the United Kingdom), the five lengthiest traffic delays were all in and around the capital. By contrast, in Germany and Italy — both characterised by more polycentric patterns of urban development — some of the corridors with long traffic delays were outside of the capitals; for example, in München, Köln, or Milano.
The level of commuting into a city depends, at least to some degree, on the population density and patterns of urban development in surrounding areas
When there is limited space in city centres it is common to find satellite cities/new towns and other forms of suburban development emerging to house the growing number of urban inhabitants; this is particularly true around some of Europe’s largest (capital) cities. These patterns may explain why some cities act as employment hubs that draw in labour from a considerable surrounding area, while the labour force in other cities is principally supplied by the local population. Two contrasting examples are shown for Spain in Figure 10: 12.0 % of the workforce in the southern city of Córdoba commuted into the city for work, compared with 93.1 % of the workforce in the north-western city of Santiago de Compostela (2008 data for both cities). The area around Córdoba has a very low population density with only a few small towns and villages punctuating the arid landscape/sierras, while there is a much higher level of population density around Santiago de Compostela with a very high number of small settlements scattered across the landscape.
In 2011, the Bulgarian, German and Slovakian capitals — Sofia (7.5 %), Berlin (15.7 %; 2013 data) and Bratislava (36.1 %) — had the lowest shares of commuters (from outside the city) among any of the cities on their respective national territories. On the other hand, the capitals of Sweden, Denmark and Belgium recorded the highest proportion of commuters (from outside the city) among any of the cities on their national territories — Stockholm (45.1 %), København (47.2 %) and Bruxelles/Brussel (78.6 %; 2008 data). These figures would tend to suggest that, among others, urban sprawl and transport links in northern and western EU Member States have tended to result in high numbers of commuters from outside of cities, whereas in eastern Member States, urban development outside administrative boundaries is less common, therefore favouring intra-city commuting patterns.
Figure 11 looks at commuter flows in the opposite direction in 2011: as may be expected, there were generally fewer people who live in a city and commute elsewhere, and this was particularly the case in the Latvian capital of Rīga (4.3 %), Bratislava (3.3 %) or Sofia (1.3 %). There were much higher shares of people commuting out of some cities that were located close to major urban centres, for example, the Communauté d’agglomération des deux Rives de la Seine to the west of Paris, Spijkenisse to the south-west of Rotterdam, or L'Hospitalet de Llobregat to the south-west of Barcelona. This pattern was particularly prevalent in the urban agglomerations around the French capital, with 16 cities reporting that their total, local workforce was smaller in size than their number of commuters.
On average, more than a million people commute every day into the city of Paris
An analysis of the number of commuters flowing into and out of major European cities is presented in Figure 12; it is based on the top 30 cities with the highest inflows of commuters. Subject to data availability (no information for 15 of the EU Member States including most of Italy, Poland and the United Kingdom), the largest daily flows of commuters into a city were recorded in the northern Italian greater city of Greater Milano and the French capital of Paris, where in 2011 the local workforce was supplemented, on average, by more than a million commuters. There were more than half a million commuters arriving in the Portuguese, Spanish and Belgian capitals of Greater Lisboa, Madrid (2008 data) and Bruxelles/Brussel (also 2008 data).
In the largest German cities (2013 data) the relative scale of commuting was somewhat less pronounced than in other European cities of comparable size; this was particularly the case in the capital of Berlin, where the net inflow of commuters was 104 thousand.
Although not shown in Figure 12, cities with large net outflows of commuters can also be identified. This situation was particularly apparent on the Iberian Peninsula, for example, in L'Hospitalet de Llobregat (Spain) or Sintra (Portugal), with approximately 110 thousand daily commuters departing to principally work in Barcelona or Lisboa, which equated to a net outflow of 76 thousand and 78 thousand respectively.
Differences between day-time and night-time populations
With such large flows of commuters into some of Europe’s cities, it is interesting to analyse the changes that take place over a 24-hour period. Peak rush-hour periods usually occur in the early morning on the way to work and early evening for the journey back home, with the vast majority of commuters using the roads, rail or underground/metro networks.
The influx of commuters into a city each morning can considerably change the number of persons who are active within its territorial boundaries. Map 2 contrasts day-time and night-time population density for Ljubljana (the capital of Slovenia) during the period 1 May–31 October 2014; the day-time population having been measured at lunchtime (12:00h–13:00h), while the night-time population was measured after most people had gone to bed (00:00h–01:00h). The information presented is based on administrative data (for the day-time population) and a central population register (for the night-time population) and was calibrated using hourly patterns observed from mobile phone data.
The general pattern of considerably more people being in the city centre during the day-time is clearly evident when contrasting the two maps, whereas the night-time population was greater in some subcity districts away from the city centre, as well as in some of the surrounding areas. The highest level of population density during the day-time was recorded for a grid cell covering some business entities where the majority of employees were recorded as working in the Ljubljana headquarters, while the highest level of population density during the night-time was recorded for a grid cell containing an administrative building for a student campus (thereby also suffering from a similar measurement issue).
The number of commuters arriving each day in Milano was more than twice the figure for Roma
This final section presents results from an analysis of labour market areas in Italy, as conducted by the Italian national statistical institute (ISTAT). Input data was based on the 2011 population census and this was used to compute 611 individual labour market areas across the Italian territory.
Labour market areas
Labour market areas are defined by Eurostat as ‘economically integrated regions within which residents can find jobs in a reasonable commuting distance, or can change their employment without changing their place of residence’. They are designed to allow new analyses of socio-demographic characteristics and to overcome the traditional constraints of regional statistics, as administrative boundaries often result from historical circumstances rather than real world social and economic realities.
The method used by Eurostat and national statistical institutes (NSIs) is to combine administrative and functional approaches. Eurostat supports the ongoing development of a methodology through a system of grants, while the participating NSIs test the application of methods nationally. The goal is to arrive at a harmonised EU-wide definition for labour market areas so that these statistics can be used to bring light to the effects of commuting and to assist in the design of employment, labour mobility and urban planning policies.
An analysis of labour market areas allows the degree of economic integration between places to be measured by the extent to which workers are willing and able to commute between two places. This may be particularly relevant for analysing city centres to which a considerable number of people commute every day, or satellite cities and suburbs which provide additional employment capacity to nearby urban centres.
For more information: https://ec.europa.eu/eurostat/cros/content/labour-market-areas_en.
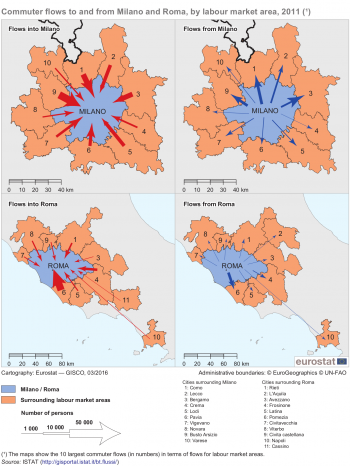
Map 3 shows the 10 largest labour market areas in terms of commuter numbers both to and from Milano and Roma. There were, on average, 213 thousand people who commuted into Milano each day in 2011, equivalent to 5.8 % of its total population, while the flow of commuters into Roma was less than half this level, at around 100 thousand or 2.9 % of its total population.
The largest flows of commuters into Milano were from Busto Arsizio, Como and Bergamo, although the origin of commuters was quite evenly distributed around the city in a radial pattern. On the other hand, almost half (44 %) of the commuters arriving in Roma each day were from Pomezia — a relatively new urban development to the south of the capital. It can also be noted that an average of 2 709 people commuted from Napoli to Roma (a journey of just over 200 km in distance), while only 349 commuted in the opposite direction.
See also
- Urban Europe — statistics on cities, towns and suburbs (online publication)
- Degree of urbanisation classification - 2011 revision
- Eurostat regional yearbook
- Labour market (all articles on the labour market)
- Living conditions (all articles on living conditions)
- Regional typologies overview
- Regions and cities (all articles on regions and cities)
- Territorial typologies
- Territorial typologies for European cities and metropolitan regions
- Transport (all articles on transport)
Further Eurostat information
Data visualisation
Main tables
Database
- Degree of urbanisation (degurb)
- Metropolitan_regions (met)
- Urban audit (urb)
- Regional statistics by NUTS classification (reg)
Dedicated section
Methodology / Metadata
- What is a city?
- Perception survey on quality of life in 79 European cities
- Regional labour market statistics (ESMS metadata file — reg_lmk_esms)
- Regional transport statistics (ESMS metadata file — reg_tran_esms)
- Urban audit (ESMS metadata file — urb_esms)
- Regional statistics by typology (ESMS metadata file — reg_typ_esms)
Source data for tables, figures and maps (MS Excel)
External links
- European Commission, Directorate-General for Regional and Urban Policy, Urban development
- European Commission, Directorate-General for Regional and Urban Policy, A harmonised definition of cities and rural areas: the new degree of urbanisation
- OECD, Redefining urban — a new way to measure metropolitan areas
