Recent developments in industry, construction, trade and services – short-term statistics data
Data extracted in September and October 2023.
Planned article update: November 2024.
Highlights
Production and trade only slightly higher than before Covid-crisis. Service production developing dynamically.
Production indices are business indicators, which measure the monthly changes of the price adjusted output of industry, construction and services. The trade volume measures the price-adjusted turnover in trade.
Full article
Main economic influences since 2020
In early 2020, the first cases of Covid-19 were diagnosed in Europe and around mid-March 2020 EU Member States began to introduce containment measures to fight the pandemic. The measures varied considerably from one country to the other and included the closing of bars, restaurants, hotels shops and many businesses. The majority of measures were maintained in April and abandoned or reduced in scope and severity in May 2020. With increasing Covid-19 cases, containment measures were tightened again after the summer of 2020 and further increased in autumn and winter. Since March 2021, many measures have gradually been lifted. In early 2022, many measures were further reduced or completely phased out. In general, the strictness, length and nature of the Covid-19 measures in the EU were quite heterogeneous.
The Covid-19 pandemic and the containment measures taken by European Member States were not the only factors that influenced economic development in recent months. The Russian military aggression against Ukraine and embargo measures since March 2022 have also affected production levels in the EU as well as trade volumes and are reflected in short-term statistics (STS) data. Moreover, as a result of worldwide containment measures, supply chains were disrupted and prices for many goods, especially energy, strongly increased.
Source: Eurostat (sts_inpr_m) (sts_copr_m) (sts_sepr_m) (sts_trtu_m)
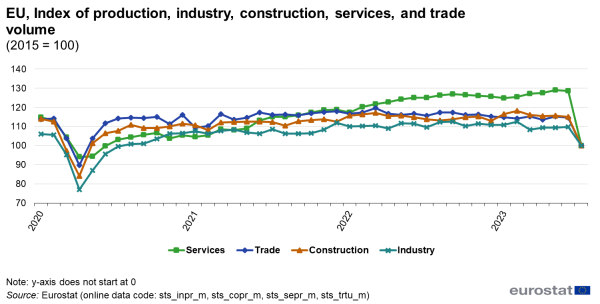
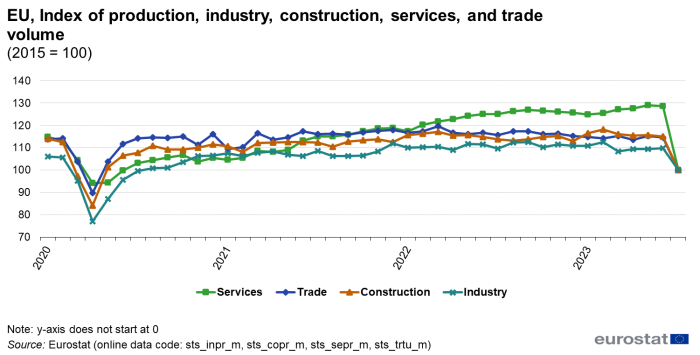
Figure 1 provides an overview of the development of EU production indices for industry, construction and services (excluding financial and public services) as well as for total trade volume (comprising the sale of motor vehicles, wholesale trade and retail trade).All four branches of the economy experienced unprecedented decreases in activity around March and April 2020. According to the latest available data in all four economic areas, the pre-crisis levels of February 2020 were surpassed in July 2023, albeit to different degrees. While the production in industry and in construction is about 2.5 % higher than before the Covid crisis, trade volume levels are almost the same. The production of services is however more than 15% higher than in February 2020 although several service industry (hotels, restaurants, air travel etc.) were strongly affected by the pandemic.
Compared with February 2022, the month of the Russian attack on Ukraine, recent production levels for industry and construction as well as the trade volume have decreased. The recovery of services production was hardly affected.
Industry
In most industrial sectors, the fall in production started in March 2020. There were only a few exceptions to this general trend, i.e. the mining of ores, the manufacture of paper, pharmaceutical products and computers. In these industries, the drop in production took place one month later in April 2020. The only industry that appears not to have been affected by the crisis was the manufacturing of tobacco products. This industry, however, had already been on a steadily declining trend for several years (for more details see the article on Long term developments in industrial production - results from short-term statistics).
Already in May 2020, industrial production began to recover on a broad level. Some industries reached their pre-crisis level again in August or September 2020 (e.g. manufacture of textiles and of furniture) but total industry and several sub-sectors only surpassed the pre-crisis level in November 2020. For a number of industries the recovery took even longer (e.g. food products) and some industries have still not regained the production level that they had before the Covid-19 pandemic (e.g. manufacture of motor vehicles).
Source: Eurostat (sts_inpr_m)
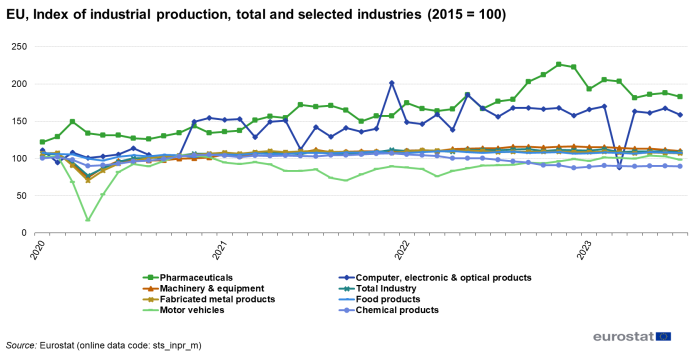
Figure 2 summarises the development of total industrial production and of the industrial sectors that have the highest weight in the European index. The production of motor vehicles (including trailers) experienced the strongest decline during the main phase of the pandemic (-84.0 %). The production index recovered somewhat in the following months. However, as a result of renewed declines in 2021 the production level of motor vehicles is at present still around 5 % below that of before the Covid-19 crisis.
The production of food and the manufacture of chemical products were only affected in a (relatively) minor way by the Covid-19 pandemic. The production indices for fabricated metal products (excluding machinery and equipment, e.g. structural metal products, weapons, tools) and for machinery and equipment are very similar to the trend of the total industrial index, which dropped by more than a quarter between February and April 2020.
Pharmaceutical products were not negatively affected by the Covid-19 crisis. Their production even increased in March 2020.
The production index for computers and electronic and optical goods (e.g. consumer electronics) is largely influenced by the production in one EU Member State and follows a rather unique path. The index remained almost stable in early 2020 and then increased dramatically in November 2020 only to drop again in March 2021. In general, this industry has experienced a positive trend over the last two years, only the production of pharmaceutical products displayed an even stronger upwards trend.
The effects of Russia's invasion of Ukraine on the production levels of the various industries are difficult to ascertain and are probably mixed with effects from other causes. Total industrial production decreased by 1.5 % since February 2022. Strong declines (10 % or more) between February 2022 and July 2023 were recorded for the manufacturing of textiles, wood and paper products, chemicals and furniture. Some mining activities even declined by 20% or more. On the other hand the manufacturing of motor vehicles and other transport equipment increased during the last months – albeit without regaining the levels before the Covid crisis (see above).
Construction
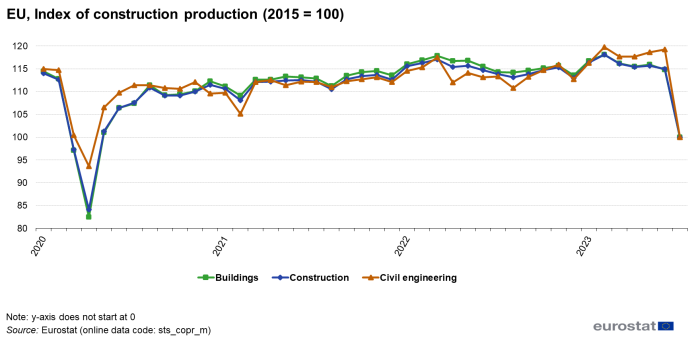
Total building production went down by more than 25 % between February and April 2020. The construction of buildings fell by 27 % whereas civil engineering work dropped by around 19 % (Figure 3).
In May 2020 a recovery set in, however the development began to stagnate in late summer. Only in late 2021 the pre-crisis level was surpassed.
Since April 2022, production levels in construction dropped again. For civil engineering a weak recovery set in in 2023 but in general construction levels stagnated and are now only slightly higher than in February 2022.
Services
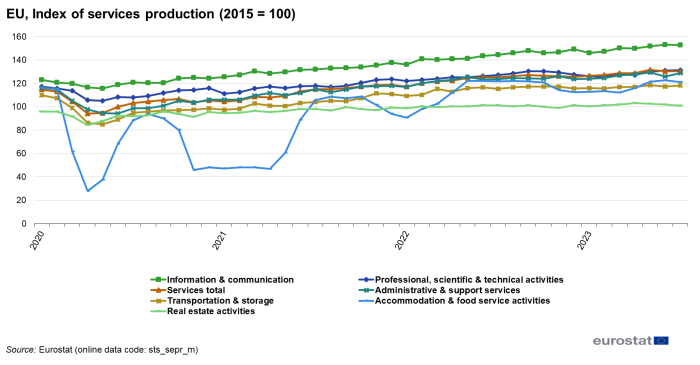
In the first months of 2020, the Covid-19 crisis and the resulting containment measures by governments had a strong effect on the production of services. Within just two months, from February 2020 to April 2020, the production of services (excluding financial and public services) in Europe fell by almost 17 %.
The development was quite heterogeneous (Figure 4). Most affected were accommodation and food services (mainly hotels and restaurants). As a result of the lockdowns, social distancing measures, restricted access and reduced demand, their production fell by more than three-quarters. Until the summer of 2020 a recovery set in but in the autumn and winter the production of accommodation and food services dropped again. Since spring, 2021 production increased again and in early 2022 surpassed the level before the pandemic. In recent months however, the production of food and accommodation services stagnated.
Transport services declined by around 19 %, in particular air transport was severely hit by the Covid-19 travel restrictions. The production of information services dropped by almost 4 %; in particular the production of motion pictures, TV shows etc. felt the effects of the pandemic. Professional and technical services decreased by almost 9 %, administrative and support services by 15 %, even real estate activities declined by 12 %.
A clear effect of Russia's invasion of Ukraine on service production levels is not visible. In 2022 and 2023 service production increased more dynamically than the production in industry and construction and the trade volume.
Trade
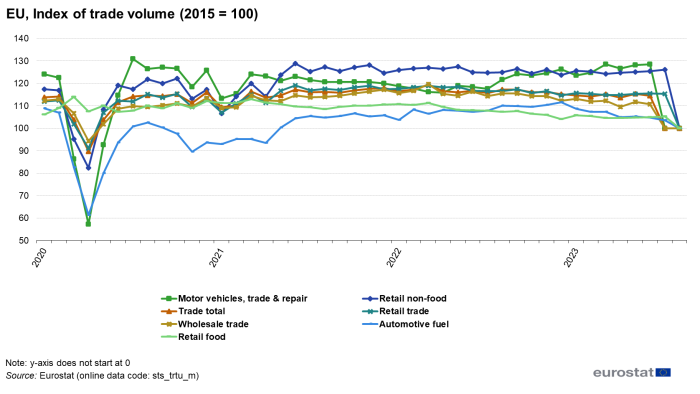
The total trade volume in the EU, comprising retail trade, wholesale trade and the trade (and repair) of motor vehicles, decreased by more than 21 % between February and April 2020. There were, however, large differences between the various trade categories. Retail trade was reduced by around 19 % but this reduction mainly concerned the sales of non-food articles, the retail sale of food products (including beverages and tobacco) fell only by about 1 % and was soon back to a level that was close to what it had been before the Covid-19 crisis (Figure 5).
The situation was especially dramatic for the trade volume of motor vehicles, which fell by more than half and the trade volume of fuel, which dropped by more than 42 %. Internet sales, on the other hand, saw an increase of 20 %. Wholesale trade dropped by around 17 %.
Note that internet sales are not depicted in Figure 5 because of their high index level, which would reduce the readability of the graph. Internet sales developed very dynamically in the early period of the pandemic, increasing by more than 20 % between February and April 2020. After May 2020, a certain consolidation set in and internet sales dropped again for two months. However, with the exception of some temporary reductions in the second half of 2020, internet sales generally grew quite fast for around one year between the summer of 2020 and the summer of 2021. Since then internet sales are slowly declining. Yet, the level of internet sales volume is still around 20 % higher than before the Covid-19 pandemic. Since early 2022 the retail trade volume and in particular, the trade volume of food products declined. Wholesale trade also declined. The trade and repair of motor vehicles on the other hand grew relatively steadily.
Average growth rates for production and trade volume
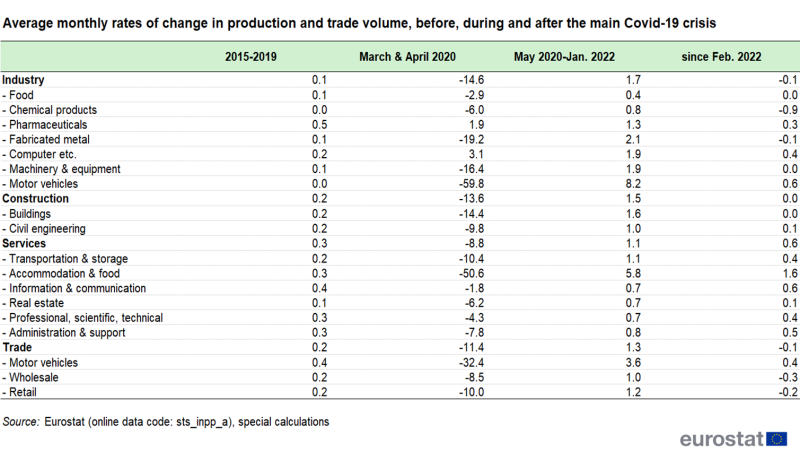
Table 1 presents the aforementioned developments in the form of average monthly rates of change for the period before the Covid-19 crisis, i.e. for the years 2015-2019, for the peak of the crisis, i.e. the months February to April 2020 and for the time between May 2020 and February 2022 (recovery period before the war in Ukraine) and the latest available data.
Source: Eurostat (special calculations) (sts_inpp_a)
In general, the average monthly growth in production and trade volume was relatively low between 2015 and 2019. The highest average increases were recorded for the production of pharmaceuticals (0.5 % per month) and for information and communication services as well as for the trade in motor vehicles (both 0.4 % per month). In March and April 2020, the general growth patterns were severely disrupted, in some areas with decreases of more than 50 % within just two months. The recovery after the peak of the pandemic until early 2022 is recorded in the third column of Table 1, which shows comparatively high average growth rates that are largely influenced by the recovery process in the summer of 2020. The development since February 2022, i.e. the start of the Russian war of aggression against Ukraine, is shown in the last column.
Industrial producer prices
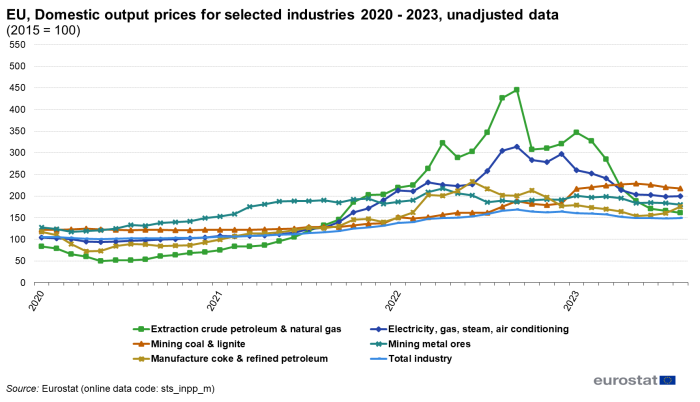
The development of (domestic) industrial producer prices does not display major effects of the Covid-19 pandemic (Figure 6), most prices remained quite stable during the peak of the pandemic and also in subsequent months. An exception to this is prices for several energy products, which recorded two-digit declines during the first half of 2020. The average monthly rate of change for the producer prices for total industry between January 2020 and June 2021 was 0.4 %.
Source: Eurostat (sts_inpp_m)
In the second half of 2021, a steep and rather steady rise in many producer prices began. Between June 2021 and September 2022, the domestic producer price for total industry increased by 50 %, which corresponds to an average monthly increase of 2.8 %. Prices for the extraction of crude petroleum and natural gas increased by more than 300 % (average monthly rate of 10 %). The prices of other energy industries also rose dramatically. Producer prices for electricity, gas, steam and air conditioning more than doubled (7 % per month on average), prices for coke and refined petroleum products saw a total increase of almost 70 % (3 % per month on average).
Since autumn 2022 industrial producer prices and in particular prices for energy products or energy related products and mining activities started to fall (e.g. -40 % for the extraction of crude petroleum). However price levels in July 2023 were still significantly higher than one year earlier.
Source data for tables and graphs
Data sources
Despite its name, the production indices are not intended to measure production but should – in theory – reflect the development of value added in the different branches of industry, construction and services. This means that the inputs obtained by one branch from another must be deducted from its gross output. In this way, double counting of production is prevented and the degree of vertical integration of branches should not influence the results for the indicator.
In practice, however, it is difficult to collect value-added data on a monthly basis. Most statistical institutes, therefore, derive monthly production data from other sources including deflated turnover, physical production data, labour input, intermediate consumption of raw materials and energy etc.
Eurostat publishes, on a monthly basis, production indices for industry, construction and services for the EU, for the euro area and the EU Member States; data are also collected for several non-EU countries. For trade, a genuine production index is not available; instead, an index of trade volume (price-adjusted turnover) is published. Data are presented in calendar adjusted and in calendar and seasonally adjusted form. Currently the short-term statistics indices are calculated with 2015 as the base year (=100).
Context
Production and trade volume indices are among the most important short-term statistics indicators. They are used to identify turning points in the economic development at an early stage and to assess the future development of GDP. In order to serve this purpose they are now available on a monthly basis in a detailed activity breakdown. STS production indices also figure prominently among the so-called 'Principal European economic indicators (PEEI)' which are used to monitor and steer economic and monetary policies in the EU and in the euro area.
Direct access to
- Industry (NACE Rev.2) (t_sts_ind)
- Production in industry (t_sts_ind_prod)
- Construction, building and civil engineering (NACE F) (t_sts_cons)
- Production in construction (teiis500)
- Trade and services (t_sts_ts)
- Wholesale and retail trade (NACE G) (t_sts_wrt)
- Services (t_sts_ser)
- Industry (sts_ind)
- Production in industry (sts_ind_prod)
- Construction, building and civil engineering (sts_cons)
- Production in construction (sts_cons_pro)
- Trade and services (sts_ts)
- Wholesale and retail trade (NACE G) (sts_wrt)
- Services (sts_os)
- European business statistics methodological manual for short-term business statistics – 2021 edition
- Short-term business statistics - Metadata in SDMX format (ESMS metadata file — sts_esms)
The legal basis for the collection of data on industrial production is Regulation (EU) No 2019/2152 of 27 November 2019 (EBS-Regulation in combination with the Commission Implementing Regulation (EU) No 2020/1197 of 30 July 2020. Both legal acts apply as of 1 January 2021.
For more on the legal base see the background article.
