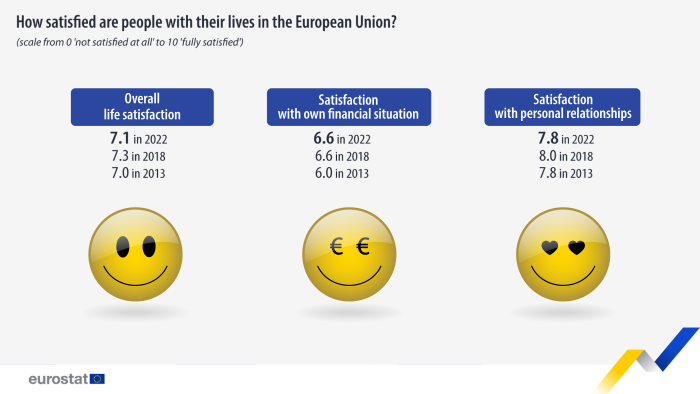
Living conditions in Europe - life satisfaction and quality of life
Data extracted in April 2024.
No planned article update.
Highlights
In 2022, the overall life satisfaction in the EU averaged at 7.1 (on a scale from 0 “not satisfied at all” to 10 “fully satisfied”), slightly lower than the 2018 rating of 7.3.
In EU countries, a higher educational attainment was generally associated with higher satisfaction levels with life in general and with own financial situation.
Across the EU, 65.2 % of men and 62.8 % of women reported being always or most of the time happy in 2022, with notable variations among countries.
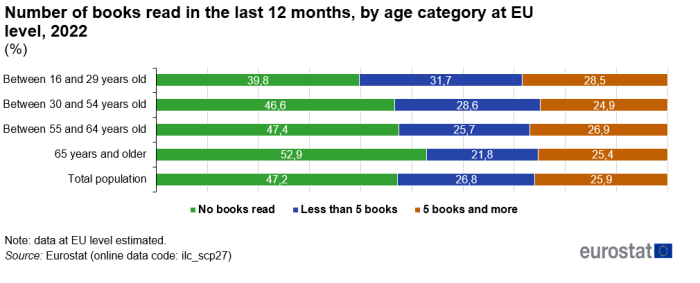
In 2022, the share of individuals who did not read books ranged from 39.8 % in the 16-29 age group to 52.9 % among those aged 65 and older.
The aim of this article is to explore aspects of well-being among European citizens, using data from the 2022 annual and six-yearly rolling Quality of Life module of the European Union’s (EU’s) statistics on income and living conditions (EU-SILC) survey.
Full article
Key findings
- One of the most important aspects of subjective well-being is an individual’s satisfaction with life in general. In 2022, the rate of overall satisfaction with life in the EU, based on a scale from 0 (not at all satisfied) to 10 (completely satisfied), was at 7.1 on average. This rating was 7.3 in 2018. In general, higher educational attainment was associated with higher perceived satisfaction levels with life in general and with own financial situation.
- In 2022, 65.2 % of men and 62.8 % of women in the EU declared being happy always or most of the time (in the four weeks prior to the survey). The highest percentages were noted in Belgium and Luxembourg, the lowest in Latvia and Bulgaria.
- Individuals with a higher education had more ‘trust in others’ than those with a lower educational attainment across EU countries. The differences were particularly noticeable in Denmark, Slovenia, France and Sweden. Regardless of education, ‘trust in others’ remained low in Cyprus but was high in Romania and Finland.
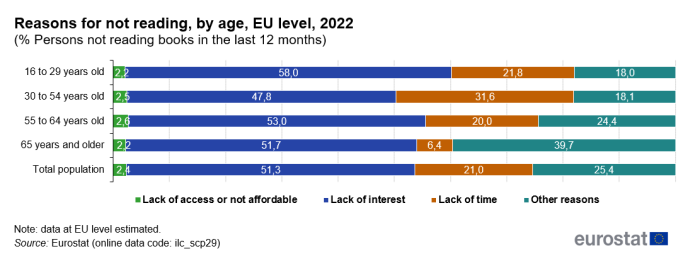
- A large share of the EU population did not read books in 2022, particularly those that are 65 years and older, where 52.9 % reported not to have read books in the last 12 months. The highest share of book readers were 16 to 29 year olds. The main reason for not reading books across all age groups was a lack of interest.
Perceived satisfaction generally increases with educational attainment level
Three distinct aspects of perceived satisfaction are illustrated in Table 1. At EU level in 2022, satisfaction with one’s own financial situation and personal relationships increased with educational attainment. The rating among those with tertiary education was only lower for one's own time use.
An acceptable financial situation is crucial for a decent standard of living and plays a crucial role in the overall satisfaction of life. For satisfaction with one’s own financial situation, Finland and the Netherlands reported the highest ratings, Bulgaria and Greece the lowest. The largest rating differences between individuals with ‘upper secondary and post-secondary non-tertiary’ and ‘tertiary’ education were particularly visible for Lithuania, Latvia and Finland.
A well-functioning social environment is important for a balance between work and personal life. Good personal relationships help to feel part of a society and promote their overall well-being. The individuals in Austria, Malta and Slovenia generally rated satisfaction with personal relationships the highest. At the other end of the spectrum was Bulgaria, and, to a lesser extent, Croatia and Greece. Here too, large rating differences can be observed: between the ‘lower secondary’ and ‘upper secondary, non-tertiary’ categories, the ratings differed noticeably (between 0.6 and 0.8 points) in Bulgaria, Croatia and Slovakia. Between the ‘upper secondary, non-tertiary’ and ‘tertiary’ categories, the gap was smaller, with Bulgaria, Romania, Croatia and Lithuania showing the largest differences (between 0.6 and 0.4 points). In Member States such as Denmark, Spain, France and Netherlands, the ratings hardly differed across educational attainment categories.
The highest ratings of satisfaction with one’s own time use were generally noted for Finland, Denmark and Slovenia, the lowest for Greece and Bulgaria. While satisfaction usually increases with education level for the most aspects, it significantly declined in this case, especially in Poland, Czechia, Slovenia.
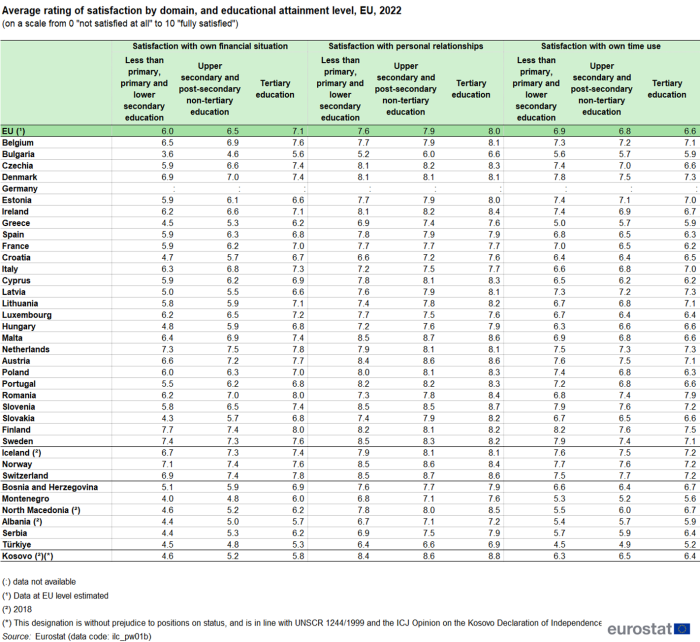
(on a scale from 0 - not satisfied at all to 10 - fully satisfied)
Source: Eurostat (ilc_pw01b)
Over 60 % of Europeans are happy most of the time
In 2022, 65.2 % of men and 62.8 % of women in the EU reported having felt happy ‘always or most of the time’ in the prior four weeks. At country level, the picture was mixed: the highest percentages were registered in the Benelux countries (over 75 %, for both sexes) followed by Ireland, Austria, Poland and Finland. The lowest shares were noted for Romania (47.1 % of men, 43.3 % of women) and particularly for Latvia and Bulgaria (between 36.0 % and 37.5 %). In most cases, the gender gap was relatively small (difference of 2.5 percentage points -pp at EU level). Men declared themselves generally “happier” than women in 16 Member States; in the remaining 11 countries women took the lead. The largest differences were noted in Portugal (11.5 pp, higher for men), Estonia (5.6 pp, higher for women), Ireland (4.1 pp, higher for men) and Cyprus (4.0 pp, higher for men).
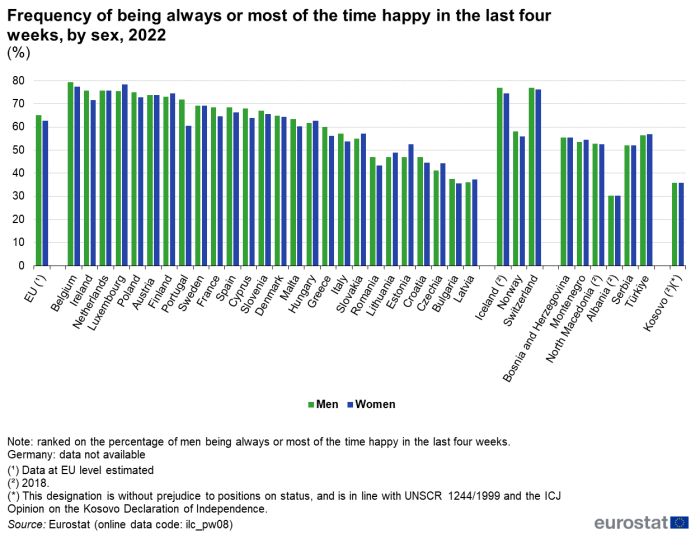
(%)
Source: Eurostat (ilc_pw08)
Across EU countries, individuals with higher education trust others more, especially in Denmark, France, and Sweden
A higher rating of trust in others among individuals with tertiary education was observed in all EU countries, without exception. The difference between education levels was most noticeable in Denmark, Slovenia, France and Sweden. Moreover, the ratings between the countries differed substantially. Among the individuals with a primary and lower secondary education, the rating for ‘trust in others’ ranged between lows in Cyprus (3.4) and France (3.5) to highs in Poland (6.9), Romania (6.8) and Finland (6.7). For tertiary educated individuals, the ratings varied between a low of 3.8 in Cyprus to a high of 7.6 in Romania, followed by Finland (7.3) and the Netherlands (7.1).
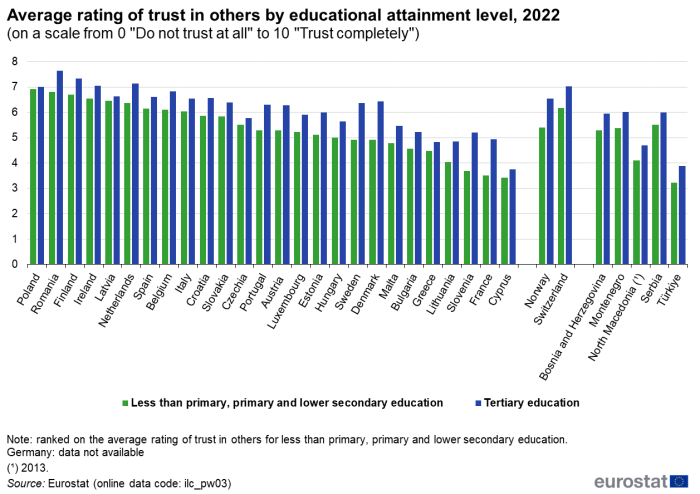
(on a scale from 0 - Do not trust at all to 10 - Trust completely)
Source: Eurostat (ilc_pw03)
Over half of the over-65s did not read a book during the last year
In 2022, 47.2% of EU individuals reported not reading any books [1] over the last 12 months, with the highest rate (52.9 %) among those aged 65 and over.
The highest share of people who read at least one book during the last 12 months was among the youngest respondents aged 16-29 (60.2 %). For individuals reporting 'less than 5 books read in the last 12 months,' a gradual decline is observed with increasing age. Similarly, for those indicating they have read '5 or more books in the last 12 months’, the pattern is consistent, with a notable exception: 26.9 % of individuals aged 55 to 65 surpassed the 24.9 % among those aged 30 to 54.
At the other end of the spectrum, 28.5 % of individuals aged between 16 and 29 years old reported having read 5 books and more.
(%)
Source: Eurostat (ilc_scp27)
Main reason for not reading books is the lack of interest
Among those who declared not reading books in the last 12 months, only 2.4 % declared that it was caused by a lack of access to books or the ability to afford them. The main reason for not reading was a “lack of interest”, reported by 51.3 %. Across age categories, the percentages ranged between 47.8 % and 58.0 %, with the highest percentage relating to 16-29-year-olds. “Lack of time” was the second-most cited reason for the 16-29 (21.8 %) and 30-54 (31.6 %) age groups. A lack of time was mentioned far less often by persons over 65 years (6.4 %).
Around 18.0 % of the youngest respondents and 39.7 % of the oldest stated that they were not reading books due to other reasons. The latter figure suggests that deteriorating vision or eyesight may be responsible.
(% persons not reading books in the last 12 months)
Source: Eurostat (ilc_scp29)
Source data for tables and graphs
Data sources
The data used in this article are derived from the European Statistics on income and living conditions (EU-SILC). EU-SILC data are compiled annually and are the main source of statistics that measure income and living conditions in Europe; it is also the main source of information used to link different aspects relating to the quality of life of households and individuals. The reference population for the information presented in this article is all private households and their current members residing in the territory of an EU Member State (or non-member country) at the time of data collection; persons living in collective households were excluded from the target population. The data for the EU are population-weighted averages of national data. The reference period for individuals’ characteristics are referenced to 2022. The data is available for the 27 EU Member States as well as Norway, Switzerland and some candidate countries.
The variable 'life satisfaction' is collected annually in EU-SILC starting from 2021, while 'being happy' is collected every 6 years starting from 2022 within the module on quality of life. This module covers some topics previously addressed in the 2013 ad hoc module on subjective well-being and the 2018 ad hoc module on material deprivation, well-being, and housing difficulties.
Context
Measuring well-being has an inherent appeal: promoting the well-being of people in Europe is one of the principal aims of the European Union, as set out by the Treaty on European Union. Measuring subjective well-being also provides valuable insight into the role played by objective capabilities as determinants of well-being. In a comparative European context, we need to take into account the fact that these widely differing priorities and values are also shaped by societal structures, norms and cultural backgrounds, which may vary between countries. The importance assigned to each of the objective dimensions of quality of life may also, therefore, differ at the aggregate country level. Measuring subjective well-being also provides valuable insight into the role played by objective capabilities as determinants of well-being.
Life satisfaction involves a cognitive and evaluative reflection on past and present experiences. It provides a more stable perspective, as specified in the OECD Guidelines on Measuring Subjective Well-being. However, this lifetime encompassing perspective also presents difficulties for the statistical measurement of life satisfaction: making an unbiased overall evaluation of one's life requires a survey respondent to make a conscious effort and the results may depend on the timing and circumstances of the survey. For example, the assessment could be influenced by fleeting experiences such as the time of day, day of the week, or even weather conditions, but these influences should cancel out in a large sample. An additional methodological difficulty stems from the entirely subjective nature of this metric. In other aspects of quality of life, which focus on functional capabilities, assessments based on perceptions can often be compared with and cross-checked against objective measures. There is, however, no such objectively measurable counterpart for life satisfaction. Nonetheless, this is a measure easy to comprehend and communicate.
Direct access to
See also
Online publication
Other articles
Main tables
Dedicated section
Methodology
Legislation
External links
- OECD Guidelines on measuring subjective well-being
- Capability approach
- European Commission — Directorate General for Employment, Social Affairs & Inclusion: Indicators’ Sub-Group of the Social Protection Committee
- European Commission — Directorate General for Employment, Social Affairs & Inclusion: Employment and social analysis
Notes
- ↑ all types of books, including audiobooks and e-books, are included, except for school textbooks and work manuals
