ICT sector - value added, employment and R&D
Data extracted in April 2024.
Planned article update: April 2025
Highlights
In 2021, value added by the EU’s ICT sector was equivalent to 5.5 % of GDP.
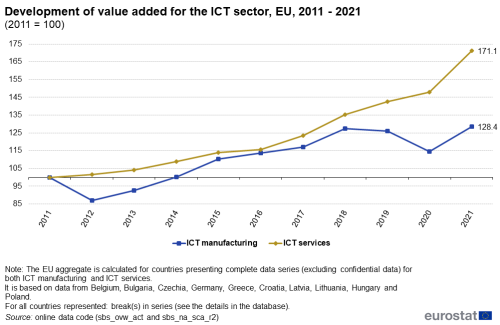
Between 2011 and 2021, value added by ICT services in the EU grew each year and increased by 71.1 %, while valued added by ICT manufacturing increased by 28.4 %.
In 2021, the largest ICT services subsector in the EU, Computer programming, consultancy and related activities', employed almost 13 times more persons than the largest ICT manufacturing subsector, 'Electronic components and boards'.

Source: Eurostat (sbs_ovw_act)
Developments in the information and communication technology (ICT) sector have led to significant changes in the methods of production and patterns of employment across the European Union (EU). This article provides an overview of economic developments within the EU’s ICT sector; the primary sources of information that are used for this article are structural business statistics (SBS), national accounts and research and development (R & D) statistics.
Full article
The size of the ICT sector in terms of value added
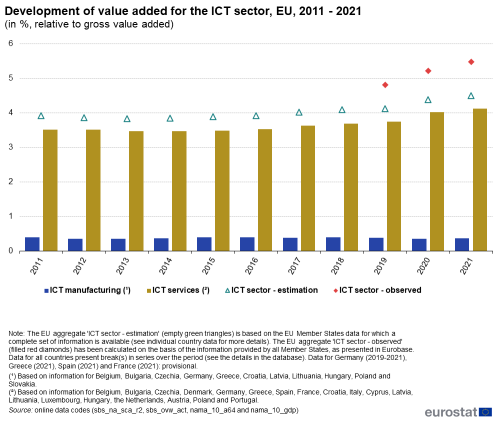
The value added of the ICT sector in the EU was over €718 billion in 2021, 5.5 % of the EU’s Gross value added. Figure 1 shows the development of the ICT sector for the aggregates 'ICT sector', 'ICT manufacturing' and 'ICT services'. For the period 2011-2018, all those three indicators are calculated on the basis of the data from EU Member States for which a complete time series for at least one of the aggregates 'ICT manufacturing' or 'ICT services' was available. The aggregate 'ICT sector', the sum of 'ICT manufacturing' and 'ICT services', is shown in the graph as a green non-filled triangle. For the last three reference years, from 2019 to 2021, the observed aggregate 'ICT sector' is available at EU level and shown as filled red diamond. For the whole period 2011-2021, data for the aggregates 'ICT manufacturing' and 'ICT services' are estimates, as the underlying country data was partly unavailable, unreliable or confidential. Therefore, the sum of 'ICT manufacturing' and 'ICT services' is lower than the 'ICT sector' from 2019 to 2021.
ICT services accounted for the vast majority of ICT activity, as they were about 6 times as large as ICT manufacturing when measured as value added. The ratio of the value added in ICT manufacturing relative to gross value added remained stable between 2011 and 2021. By contrast, the ratio of value added from ICT services to gross value added steadily grew up throughout the period, with a slightly faster pace at the end of the decade.
(in %, relative to gross value added)
Source: Eurostat (sbs_ovw_act), (sbs_na_sca_r2), (nama_10_gdp) and (nama_10_a64)
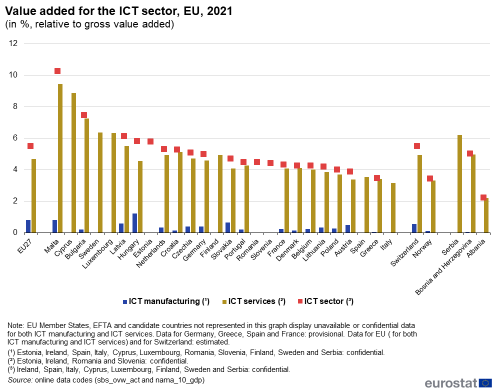
Among the EU Member States for which data are available (see Figure 2), the relative weight of the ICT sector — as measured by the ratio of its value added relative to gross value added — was highest in Malta with 10.3 % followed by Cyprus with 8.9 % (information available for ICT services only) and Bulgaria, with ICT services and ICT manufacturing generating a value added equivalent to 7.3 % of gross value added. Sweden with 6.4 % and Luxembourg with 6.3 % completed the top five. Three countries came next presenting value added ratios close to 6.0 %: Latvia, Hungary and Estonia (the latter with data for ICT services only). All other Member states are below the European average. By contrast, value added by the ICT sector was equivalent to 3.5 % of gross value added in both Spain (again for ICT services data only) and Greece, while Italy (for ICT services data only) recorded the lowest ratio with 3.1 %.
(in %, relative to gross value added)
Source: Eurostat (sbs_ovw_act), (sbs_na_sca_r2), (nama_10_gdp) and (nama_10_a64)
Figure 3 shows the development of value added for the EU’s ICT manufacturing and ICT services sectors during the period 2011-2021; this index is based on information expressed in current prices and for which coverage is limited to 10 of the EU Member States. For this group of Member States, the value added for ICT services increased every year during the decade, rising overall by 71.1 %. During the same period, the value added for ICT manufacturing showed more diversity in its growth pace leading to amount an overall increase of 28.4 %.
(2011 = 100)
Source: Eurostat (sbs_ovw_act) and (sbs_na_sca_r2)
An analysis of ICT manufacturing in the EU in 2021 (see Figure 4) reveals that it was dominated by the manufacture of electronic components and boards, which provided almost two thirds (64.0 %) of the value added by ICT manufacturing. The second largest share was recorded for the manufacture of communication equipment, which accounted for less than one fifth (19.4 %) of the value added by ICT manufacturing. The manufacture of computers and peripheral equipment (9.5 %) and the manufacture of consumer electronics (6.9 %) followed, while the smallest share was presented by the manufacture of magnetic and optical media with 0.2 %.
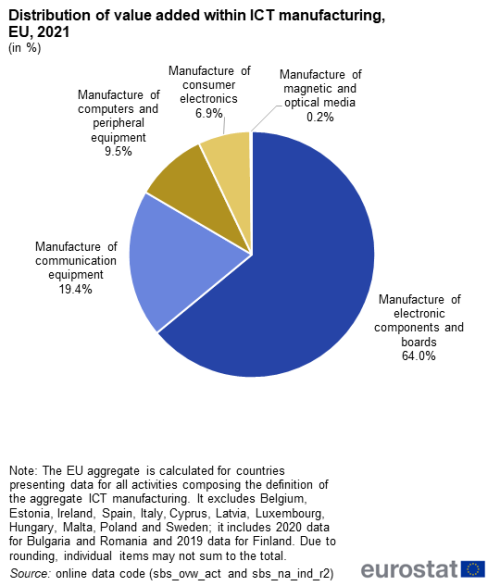
(in %)
Source: Eurostat (sbs_ovw_act) and (sbs_na_ind_r2)
As noted above, in 2021 ICT services were almost 13 times larger as large as ICT manufacturing for the selected countries in Figure 3. Across the EU (the information presented excludes Ireland and Luxembourg that did not present available data for all activities composing the ICT services aggregate), 'Computer programming, consultancy and related activities' accounted for half (5.2 %) of the value added that was generated within ICT services in 2021. ICT services were less concentrated than ICT manufacturing, with 'Telecommunications' accounting for slightly more than one fourth (25.6 %) of the value added by ICT services. As such, the two largest activities together accounted for more than three quarters of the value added by ICT services, while aside ‘Wholesale of information and communication equipment’ that reported slightly more than one tenth (10.4 %), each of the remaining activities had single-digit shares (see Figure 5).
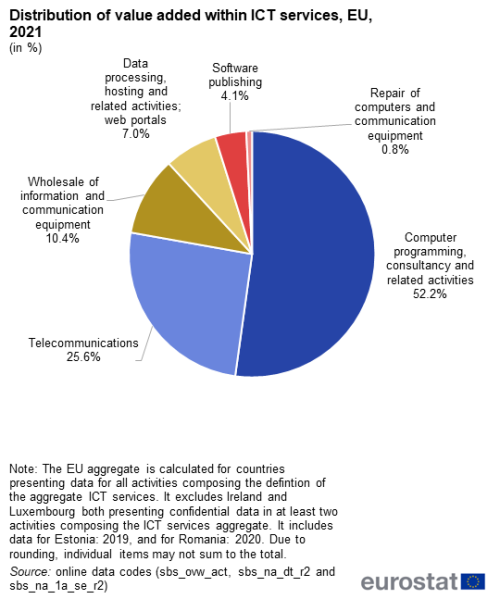
(in %)
Source: Eurostat (sbs_ovw_act), (sbs_na_dt_r2) and (sbs_na_1a_se_r2)
The two largest EU economies as measured by their share in EU gross value added — Germany and France — were the two biggest contributors, in absolute terms, to value added in the EU’s ICT sector. An analysis based on the relative contribution of the ICT sector to the Business economy of each EU Member State (see Figure 6) provides a different picture. The ICT sector accounted for more than one tenth of the value added generated within the business economy in Bulgaria (12.3 %). Shares above 10 % were also recorded for Sweden (with 11.4 %) and Romania (with 10.5 %), all three countries with 2020 data. Finland (with 2019 data) and Hungary with respectively 9.7 % and 8.3 % of value added generated by the business economy in 2021, completed the top five. At the other end of the range, the ICT sector contributed with a 5.5 % share to the value added generated within the Austrian business economy in 2021, preceded by Belgium with 5.9 %, Germany and Slovenia (both with 6.0 %). EFTA countries displayed in Figure 6 showed two different patterns with respect to the EU average: while Switzerland reported a higher share with 8.0 %, the share for Norway was 4.9 %.
Figure 6 confirms that 'Computer programming, consultancy and related activities' together with 'Telecommunications' were the two largest ICT activities in each of the EU Member States for which data are available. In 2021, 'Computer programming, consultancy and related activities' accounted for more than 5.0 % of the value added generated within the business economies of Bulgaria, Sweden and Romania (all three with latest available information for 2020). The relative significance of 'Telecommunications' was highest in Greece followed by Bulgaria and Croatia, where it contributed to respectively 4.0 %, 2.8 % and 2.6% of the value added generated within the business economy. It is interesting to note that the highest share of ICT manufacturing generated within a national business economy value added (as shown in Figure 6) occurred in Hungary where manufacturing of electronic components and boards, computers and peripheral equipment, and communication equipment accounted for 1.3 % of the value added of the Hungarian business economy, a specialisation that despite a slight decrease pertained over time.
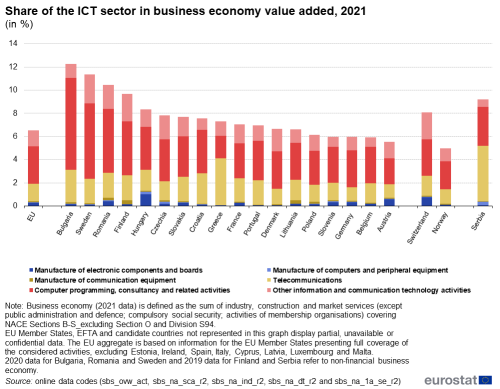
(in %)
Source: Eurostat (sbs_ovw_act), (sbs_na_sca_r2), (sbs_na_ind_r2) , (sbs_na_dt_r2) and (sbs_na_1a_se_r2)
Employment
The EU’s ICT sector employed almost 6.7 million people in 2021.
There was a continuous increase in the number of persons employed within ICT services across the EU during the period 2011-2021 (see Figure 7 for more information on the coverage at country level); by 2021, this employment had grown by 52.8 % overall when compared with 2011. By contrast, the number of persons employed in ICT manufacturing decreased in the first three years of the decade, after which it stabilised until 2017. In 2020, there was an increase of a two-digit annual growth rate. In 2020, progression returning to a lower pace, the number of persons employed in ICT manufacturing in the EU dropped severely by 14.1 % in two years, leading however to a decrease over the decade 2011-2021 of 10.7 %.
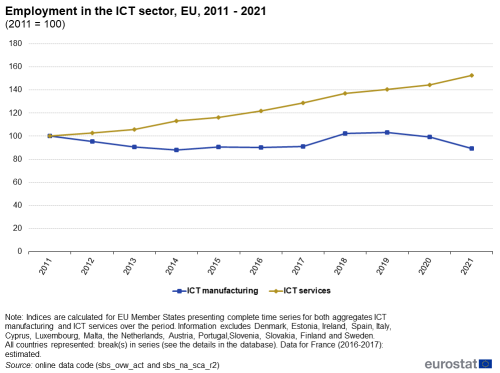
(2011 = 100)
Source: Eurostat (sbs_ovw_act) and (sbs_na_sca_r2)
Aggregating the data for the EU Member States for which a complete set of data is available (see Figure 8 for more information on the coverage at country level), the ICT sector provided work to 4.4 % of the business economy employment in 2021. In 2021, the ICT sector accounted for 6.6 % of the business economy employment in Finland (with 2019 data), followed by Sweden with 6.5 % while while shares within the range of 5.0 % to 6.0 % were recorded in Latvia, Hungary, Bulgaria, Romania and Denmark. By contrast, the Greek ICT sector made the smallest contribution to its business economy employment, with 2.5 %.
Figure 8 shows that most persons employed within the EU's ICT sector in 2021 were active in 'Computer programming, consultancy and related activities'. This sector accounted for more than half of the employment of the ICT sector. The activity had the largest share of the ICT employment in all of the EU Member States for which data are available in 2021. The relative share of 'Computer programming, consultancy and related activities' in the ICT total employment reached more than six out of every ten in Belgium and the Netherlands (both with 68.1 %), Bulgaria (67.1 %), followed by other five EU Member states (Sweden, Portugal, Germany, Croatia and Poland) and Norway (with 60.9 %). This activity also accounted for half and more of the ICT employment in further nine Member States: Slovenia, Slovakia, Romania, Denmark, Lithuania, Hungary, Czechia, France and Austria; Switzerland followed the same pattern. In Hungary, ICT manufacturing had a relatively high share of business economy employment. In 2021, some 0.8 % of the business economy employment in Hungary was employed in the manufacturing of electronic components and boards and a share (0.2 %) was recorded for the manufacturing of computers and peripheral equipment, while 0.1 % of the Hungarian business economy employment was employed in the manufacturing of communication equipment. With the exception of the manufacture of communication equipment in Finland (0.6 % with 2020 data), these were among the highest shares of ICT manufacturing recorded in any of the EU Member States for which data are available.
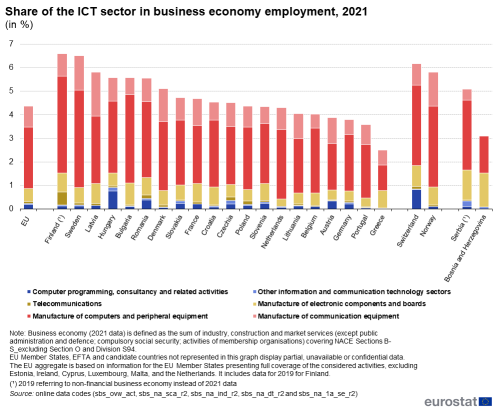
(in %)
Source: Eurostat (sbs_ovw_act) and (sbs_na_sca_r2), (sbs_na_ind_r2), (sbs_na_dt_r2) and (sbs_na_1a_se_r2)
Apparent labour productivity
Apparent labour productivity in the EU’s ICT sector was estimated to be almost €107 400 per person employed in 2021 (see Figure 9). Among the EU Member States, this ratio ranged from a high of €126 300 per person employed in Belgium and more than €100 000 in eight EU Member states: Malta, Denmark, the Netherlands, Finland (with 2020 data), Germany, Sweden (with 2020 data), France and Austria, down to less than €40 000 in Bulgaria and Romania. Nevertheless, the highest scores are recorded in Switzerland with €212 300 per person and Norway with €137 400. Available information for the candidate countries showed similar levels than Romania for Bosnia and Herzegovina and for Serbia (with 2019 data).

(in EUR thousand per person employed)
Source: Eurostat (sbs_ovw_act) and (sbs_na_sca_r2)alt=a vertical bar chart on apparent labour productivity in the ICT sector in 2021 in euro thousand per person employed in the EU, two of the EFTA countries and some of the candidate countries.
There are large differences in productivity levels between the individual EU Member States. Many of these may be of a structural nature and therefore relevant to any if not all activities, rather than being specific to the ICT sector. It can therefore be more revealing to analyse apparent labour productivity based on a ratio comparing this indicator for the ICT sector with an average value for the business economy. In 2021, the apparent labour productivity of the EU’s ICT sector (see Figure 10 for available information at country level) was 78.5 p.p. higher than that recorded for the business economy as a whole.
This pattern was repeated in each of the EU Member States for which data are available, with apparent labour productivity consistently at a higher level in the ICT sector than for the business economy. In 2021, apparent labour productivity for the ICT sector in Greece was slightly less than three times as high as the average recorded for the business economy and in Malta and Bulgaria it was more than twice as high. At the other end of the range, the ICT sector recorded a level of apparent labour productivity that was less than 20 % higher than the business economy average in Estonia and in the Netherlands. High differences in productivity levels were also recorded in the candidate countries for which information was available (Serbia and North Macedonia both with 2019 data, and Bosnia and Herzegovina), showing that labour productivity sector was around twice as high in the ICT than in the business economy as a whole.
A comparison between 2011 and 2021 reveals that the gap between apparent labour productivity ratios for the ICT sector and for the business economy was generally narrowing. There were four exceptions to this rule among the 19 EU Member States for which data is available, namely, Malta (with above 50 percentage points increase), Greece (with above 40 percentage points increase), Finland (with above 20 percentage points increase and 2020 data), and France (with 3.5 percentage points increase). This narrowing pattern was also revealed in Norway, whereas in Switzerland, the other EFTA country for which data are available over the period of reference, the gap slightly expanded (with 3.6 percentage points). Breaks in series in all countries occurred over the period, notably in 2021 with the adoption of the Framework Regulation on the collection of European business statistics.
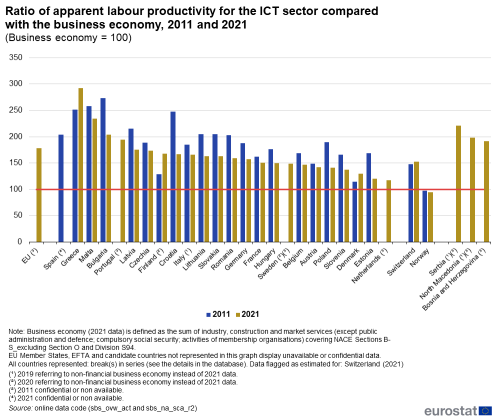
(Business economy = 100)
Source: Eurostat (sbs_ovw_act) and (sbs_na_sca_r2)
Figure 11 provides a different perspective by detailing average personnel costs in the ICT sector compared with those for the whole of the business economy. In the EU in 2021, the average costs of a person working in the ICT sector was 58.4 % higher than the average for someone working in the business economy.
This pattern was repeated in all EU Member States (see Figure 11 for more information on the country coverage). In 2021, average personnel costs in the ICT sectors of Bulgaria, Greece and Romania were at least twice as high as in their respective business economies. By contrast, the difference was much lower in Slovenia, Sweden (with 2020 data) and Italy (with 2019 data) where average personnel costs per employee for people working in the ICT sector were no more or shortly higher than 40 % than for the whole of the business economy.
A comparison between 2011 and 2021 reveals that the gap between average personnel costs for the EU’s ICT sector and the whole of the EU’s business economy was closing somewhat. The countries to report a closing of this gap at the fastest pace were Hungary (11.3 %), Slovenia (10.8 %) and Austria (8.7 %). By contrast, the gap in average personnel costs between the ICT sector and the business economy average widened in ten of the 20 EU Member States for which data are available; the gap widened most rapidly in Greece, Denmark and Estonia.
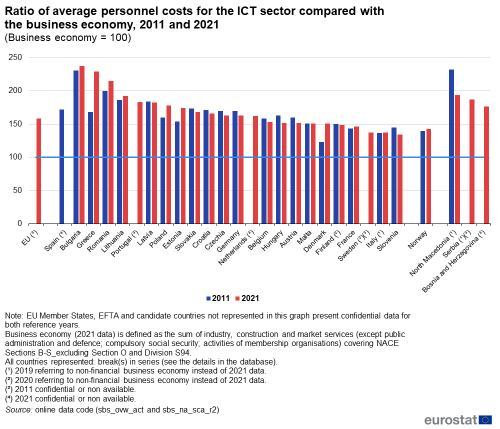
(Business economy = 100)
Source: Eurostat (sbs_ovw_act) and (sbs_na_sca_r2)
Research and development (R & D)
The main contributors to the value of business enterprise R & D expenditure (BERD) in the EU’s ICT sector were the three largest contributors to EU GDP — namely, Germany, France and Italy. A relatively large contribution per inhabitant was also made by Sweden, Finland and Ireland although only partial information in those countries on the ICT sector is available.
Figure 12 provides an alternative analysis, which takes account of the differences in country sizes; it presents the ICT sector’s share of business enterprise R & D expenditure. In 2021, this ratio peaked in Cyprus where the ICT sector accounted respectively for more than half (with 66.7 %) of all business enterprise expenditure on R & D. Estonia followed presenting shares of slightly less than 50 %. The third highest proportion was recorded in Ireland (43.0 % with data for ICT sector only), followed by Bulgaria (38.4 %; ICT services only) and Malta (38.2 %). In all EU countries, most of ICT sector business enterprise R & D expenditure were obtained in the ICT services sector. This is also valid for EFTA and candidate countries for which information is available.
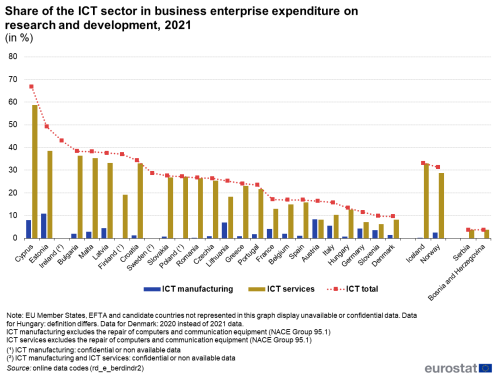
(in %)
Source: Eurostat (rd_e_berdindrR2)
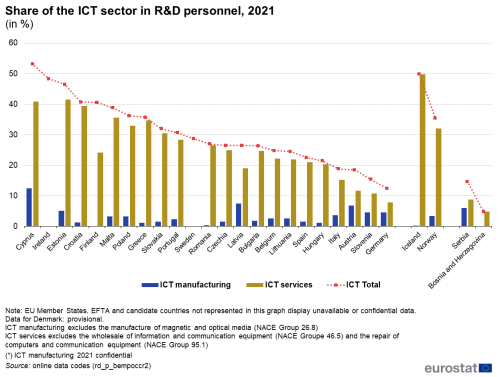
A similar pattern is presented in Figure 13, which shows the share of the ICT sector in total R & D personnel. In 2021, this proportion peaked at 53.1 % in Cyprus followed by Ireland (48.3 % with data for ICT sector only), while high shares were also recorded in Estonia (46.4 %) and Croatia (40.6 %). The share of the ICT sector in R & D personnel was within the range of 40 % to 20 % in in fourteen countries: Malta, Poland, Greece, Slovakia, Portugal, Sweden with data for ICT sector only, Romania, Czechia, Latvia, Bulgaria, Belgium, Lithuania, Spain and Hungary. Among the remaining EU Member States, for which data are available, only four presented shares below 20 %. In EFTA and candidate countries, Iceland took the lead with a share of the ICT sector in total R & D personnel of 49.9 % followed by Norway (35.4 %).
Source data for tables and graphs
Data sources
The ICT sector is delineated according to a definition first published by the OECD in 2006; see the OECD Guide to Measuring the Information Society (2011) for more details. It provides, among others, a classification of those activities that produce ICT goods and services, following the statistical classification of economic activities, NACE Rev. 2. At an aggregated level, information on the ICT sector may be analysed for the total ICT sector, ICT manufacturing and ICT services; definitions for these sectors are provided below.
The primary data sources that are used in this article include structural business statistics (SBS), national accounts and research and development (R & D) statistics. As ICT sector data are derived from these sources, the statistical concepts and definitions employed for the ICT sector are based on these primary sources of information. This approach has the virtue of ensuring cost-efficient and high-quality data collection. However, it also results in some limitations, such as restrictions when considering the introduction/design of new indicators or a lack of control over the timing of new data releases. For the most detailed methodological information and metadata, users should refer to the information available for the three primary sources of data.
Structural business statistics (SBS)
Structural business statistics (SBS) describe the structure and performance of businesses in the EU. These statistics can be broken down into a detailed sectoral level of several hundred economic activities; the information available from SBS is more detailed than data from national accounts. The data concerning structural business statistics are provided up to reference year 2020 in accordance with Commission Regulation (EU) No 446/2014 amending Regulation (EC) No 295/2008. From reference year 2021 onwards, data are collected under the legal framework for European Business Statistics (EBS) by Commission Regulation (EU) 2019/2152 and Commission Implementing Regulation (EU) 2020/1197 (EBS General Implementing Act).
From 2021 onwards, SBS cover the 'business economy', which includes mining and quarrying, industry, supply and sewerage, construction, trade and most of the service activities. SBS do not cover agriculture, forestry and fishing, nor public administration and (largely) non-market services such as education or health. To date, this is the only primary source that provides information pertaining to the economic activity of the aggregated ICT sector, ICT manufacturing and ICT services.
National accounts
National accounts provide statistics on the structure and development of economies. The European System of national and regional Accounts (ESA 2010) is the latest internationally compatible accounting framework used within the EU. It provides a systematic and detailed description of the economy; its legal basis is Regulation (EU) No 549/2013 on the European system of national and regional accounts in the European Union.
National accounts describe and analyse the economic interactions (transactions) within an economy; they may be used to observe economic activity within the domestic territory. The most well-known indicator from national accounts is gross domestic product (GDP), which provides a measure of the overall size of a country’s economy, measured by the sum of the gross value added of all resident institutional units engaged in production, plus any taxes on products and minus any subsidies on products.
Research and development (R & D)
The main concepts and definitions used in research and development (R & D) statistics are presented in the Frascati Manual; it provides guidelines for collecting and reporting data on R & D. The manual also provides a definition of R & D which comprises creative and systematic work undertaken in order to increase the stock of knowledge — including knowledge of humankind, culture and society — and to devise new applications of available knowledge (§2.5, Frascati Manual 2015).
From 2012 until the end of 2020, the legal basis for the collection of R & D statistics is provided for by Commission Implementing Regulation (EU) No 995/2012 laying down detailed rules for the implementation of Decision No 1608/2003/EC concerning the production and development of Community statistics on science and technology. From 2021 onwards, the collection of R&D statistics is based on the Commission Implementing Regulation (EU) 2020/1197 of 30 July 2020. The Regulation sets the framework for the collection of R&D statistics and specifies the main variables of interest and their breakdowns at predefined level of detail.
The business enterprise sector includes: all firms, organisations and institutions whose primary activity is the market production of goods or services (other than higher education) for sale to the general public at an economically significant price, and the private non-profit institutes mainly serving them. The core of the sector is made up of private enterprises (corporations or quasi-corporations) whether or not they distribute profit. Among these enterprises may be found some firms for which R & D is the main activity (commercial R & D institutes and laboratories). Any private enterprises producing higher education services should be included in the higher education sector. In addition, this sector includes public enterprises (public corporations and quasi-corporations owned by government units) mainly engaged in market production and sale of the kind of goods and services which are often produced by private enterprises, although, as a matter of policy, the price set for these may be less than the full cost of production. This sector also includes non-profit institutions (NPIs) who are market producers of goods and services other than higher education.
Definitions employed to monitor indicators for the ICT sector
Total ICT sector, ICT manufacturing and ICT services are based on an OECD definition (2006). Using the statistical classification of economic activities, NACE Rev. 2, Eurostat has applied this definition to data from reference year 2008 onwards; prior to this date, an alternative definition was used (based on NACE Rev 1.1). As a result of this break in series, users are advised not to combine the two different data collections.
The ICT sector is defined in terms of the following NACE Rev. 2 activities:
- Total ICT sector: NACE (Groups and Divisions) [26.1 - 26.4] + 26.8 + 46.5 + 58.2 + 61 + 62 + 63.1 + 95.1
- ICT manufacturing: NACE Groups [26.1 - 26.4] + 26.8
- Manufacture of electronic components and boards: NACE Group 26.1
- Manufacture of computers and peripheral equipment: NACE Group 26.2
- Manufacture of communication equipment: NACE Group 26.3
- Manufacture of consumer electronics: NACE Group 26.4
- Manufacture of magnetic and optical media: NACE Group 26.8
- ICT services: NACE (Groups and Divisions) 46.5 + 58.2 + 61 + 62 + 63.1 + 95.1
- Wholesale of information and communication equipment: NACE Group 46.5
- Software publishing: NACE Group 58.2
- Telecommunications: NACE Division 61
- Computer programming, consultancy and related activities: NACE Division 62
- Data processing, hosting and related activities; web portals: NACE Group 63.1
- Repair of computers and communication equipment: NACE Group 95.1
- ICT manufacturing: NACE Groups [26.1 - 26.4] + 26.8
Indicator definitions
Gross value added (GVA) - NA: is defined as output (at basic prices) minus intermediate consumption (at purchaser prices); it is the balancing item of the national accounts' production account. GVA can be broken down by industry and institutional sector. The sum of GVA over all industries or sectors plus taxes on products minus subsidies on products gives gross domestic product.
Value added – SBS: Value added is a composite indicator of net operating income, adjusted for depreciation, amortisation and employee benefits, all components being recognised as such by the statistical unit during the reference period. Its value is given by the formula: + Net turnover + Income from product- or turnover-related subsidies + Capitalised output ± Change in stock of goods - Total purchases of goods and services. From 2021 onwards, EBS framework introduced measuring value added at basic prices for businesses, when prior it was collected at factor cost. Consequently, data on value added in businesses collected for reference year 2021 onwards are flagged with a break in series and are not directly comparable with 2020 data.
Persons employed - SBS: is defined as the total number of persons who work in the observation unit (inclusive of working proprietors, partners working regularly in the unit and unpaid family workers), as well as persons who work outside the unit who belong to it and are paid by it (e.g. sales representatives, delivery personnel, repair and maintenance teams). It excludes manpower supplied to the unit by other enterprises, persons carrying out repair and maintenance work in the enquiry unit on behalf of other enterprises, as well as those on compulsory military service.
Apparent labour productivity: is defined as the value added divided by the number of persons employed. This ratio measures how efficiently labour input is combined with other factors of production and how it is used in the production process. This ratio is generally presented in thousands of euros per person employed.
Average personnel costs: are defined as total personnel costs divided by the number of employees (persons who work for an employer on the basis of a contract of employment and receives compensation in the form of wages, salaries, fees, gratuities, piecework pay or remuneration in kind). In turn, total personnel costs are defined as the total remuneration, in cash or in kind, payable by an employer to an employee (regular and temporary employees, as well as home-workers) in return for work done by the latter during the reference period. Personnel costs are made up of wages, salaries and employers' social security costs. They include taxes and employees' social security contributions retained by the employer, as well as the employer's compulsory and voluntary social contributions.
Expenditures on Research and Development (R & D) for a statistical unit can be measured in three complementary ways: as intramural expenditures, as extramural expenditures, or by sources of funds. Nevertheless, the basic measure for R & D expenditure is the 'intramural expenditures', which are all current expenditures plus gross fixed capital expenditures for R & D performed within a statistical unit during a specific reference period, whatever the source of funds.
R & D personnel in a statistical unit include all persons employed directly in the field of R & D, including persons providing direct services, such as managers, administrators, and clerical staff. A R & D researcher can be employed in the public or the private sector - including academia - to create new knowledge, products, processes and methods, as well as to manage the projects concerned.
Context
Digitalisation and automation can generate new business opportunities through the development of new production processes, new products and new markets. Indeed, the impact of ICT has generally resulted in increased productivity and efficiency, as well as in a range of possibilities for more flexible working practices.
ICT plays a strategic role in promoting growth and competitiveness across European economies. A developed ICT sector is essential for capitalising on digitalisation, keeping up with competitors in globalised markets, and establishing Europe’s technological leadership. Awareness of the importance of the ICT sector is reflected in the political guidelines of the European Commission A Europe fit for the digital age, stressing the need for Europe to lead the transition to a healthy planet together with a new digital world.
This new EU digital strategy, empowering people with a new generation of technologies, aims to make this transformation work for people and businesses. While helping to achieve its target of a climate-neutral Europe by 2050, the digital strategy is centred around two objectives:
- Shaping Europe's digital future, ensuring that the digital transition solutions will benefit everyone;
- Europe’s Digital Decade, exposing the vision and avenues for Europe’s digital transformation by 2030 symbolised by a digital compass that will translate the EU’s digital ambitions in more concrete terms.
Direct access to
- ICT sector (isoc_se)
- Percentage of the ICT sector in gross value added (isoc_bde15ag)
- Business expenditure on R&D (BERD) in ICT sector as % of total R&D expenditure by NACE Rev. 2 activity (isoc_bde15ar2)
- R&D personnel in ICT sector as % of total R&D personnel by NACE Rev. 2 activity (isoc_ic_biper2)
- SBS - main indicators (sbs_na)
- Annual enterprise statistics for special aggregates of activities (NACE Rev. 2) (sbs_na_sca_r2)
- SBS - industry and construction (sbs_ind_co)
- Annual detailed enterprise statistics - industry and construction (sbs_na_ind)
- SBS - trade
- Annual detailed enterprise statistics - trade (sbs_na_dt)
- SBS - services
- Annual detailed enterprise statistics - services (sbs_na_serv)
- National accounts, see:
- Annual national accounts (nama10)
- Main GDP aggregates (nama_10_ma)
- GDP and main components (output, expenditure and income) (nama_10_gdp)
- Main GDP aggregates (nama_10_ma)
Eurostat
- ICT sector (isoc_se) (ESMS metadata file — isoc_se_esms)
- Annual national accounts (nama10) (ESMS metadata file — nama10_esms)
- Structural business statistics (sbs) (ESMS metadata file — sbs_esms)
- Structural business statistics - historical data (sbs) (ESMS metadata file — sbs_h_esms)
- Statistics on research and development (rd) (ESMS metadata file — rd_esms)
OECD
