Businesses in education sector
Data extracted in March 2024
Planned article update: March 2025
Highlights
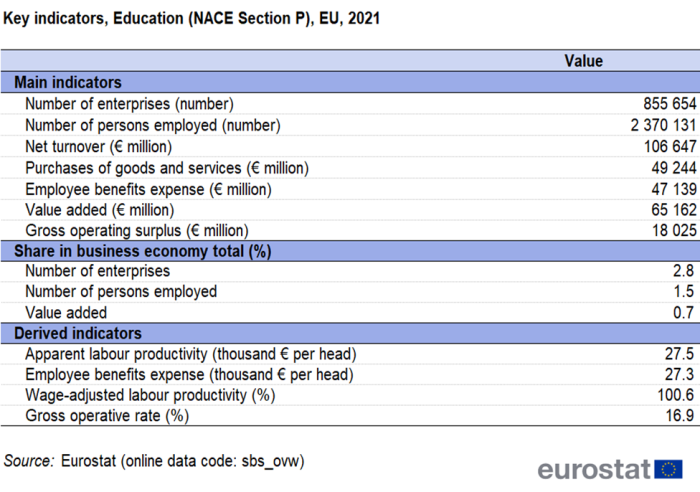
In 2021, businesses in the education sector generated €65.2 billion of value added and €106.6 billion of net turnover.
There were 2.4 million persons employed in businesses in the education sector in 2021.
This article presents an overview of statistics for the European Union's (EU) education sector, as covered by NACE Rev. 2 Section P. It belongs to a set of statistical articles on 'Business economy by sector'. Following the entry into force of the European Business Statistics (EBS) Regulation, Eurostat has extended the service coverage for structural business statistics (SBS) data and is publishing, for the first time, SBS data on the education sector. Additional information on education is also available from other data collections such as education and training statistics.
Full article
Structural profile
In 2021, the EU's education sector (Section P) comprised a total of 855 700 enterprises, which represented 2.8 % of all enterprises active in the business economy (Sections B to N and P to R, as well as Divisions S95 and S96). These enterprises employed 2.4 million persons, generating €65.2 billion in value added and accumulating a net turnover of €106.6 billion.
The EU's education sector contributed to 1.5 % of the persons employed in the business economy in 2021, and accounted for only 0.7 % of the value added.
SBS only cover the activities of market producers. Contrary to most activities covered by SBS, non-market producers represent a significant part of the education sector (and also for example the health sector). It should be noted that the data in this article only cover the market producers, meaning those acting under market conditions, active in this sector.
In 2021, the EU's education sector recorded apparent labour productivity and average employee benefits expense below the business economy averages. The apparent labour productivity in the education sector stood at €27 500 per person employed, representing a noteworthy difference of €32 700 compared with the business economy average of €60 200 per person employed. Similarly, the average employee benefits expense within the education sector amounted to €27 300 per employee, indicating a difference of €11 700 from the business economy average of €39 000 per employee. These values positioned the education sector among the lower ends of the NACE sections within the business economy, just in front of Accommodation and food service activities (NACE Section I) and Other personal service activities (Divisions S96).
Combining these two ratios into the wage-adjusted labour productivity ratio shows the extent to which value added per person employed covers average personnel costs per employee. In 2021, the education sector demonstrated a wage-adjusted labor productivity ratio of 100.6 %, the second lowest across NACE sections within the business economy, marginally higher than Repair of computers and personal and household goods (Divisions S95). This ratio reflects the sector's low productivity. By contrast, the gross operating rate, indicating the share of turnover remaining after paying for purchased goods and services as well as employee benefits expense (in other words, the gross operating surplus) stood at 16.9 % for the EU's education sector in 2021. This figure surpassed the 13.2 % average of gross operating rate for the business economy. This indicates that the share of total purchases of goods and services is relatively low in the education sector compared with other economic activities.
Sectoral analysis
The education sector is organized into six NACE divisions: pre-primary education (Division 851), primary education (Division 852), secondary education (Division 853), higher education (Division 854), other education (Division 855) and educational support activities (Division 856). The first four divisions encompass the formal education, which is defined according to ISCED, as programmes that represent at least the equivalent of one semester (or half of a school/academic year) of full-time study. As mentioned in the introduction, SBS cover only the market producers in the educational sector, i.e. those acting under market conditions.
In 2021, more than half of the EU's employment and value added in the education sector were allocated to the subsector of other education (Division 855), which encompasses a wide range of educational activities beyond the scope of traditional formal education, like sports and recreational education, cultural education, driving school activities and other education n.e.c. — see Figure 1.

(% share of sectoral total)
Source: Eurostat (sbs_ovw_act)
In 2021, this subsector comprised 759 500 enterprises and a workforce of 1.4 million persons, contributing to the EU's business economy with a value added of €35.1 billion. This was followed by the subsector of secondary education (Division 853), which includes general, technical and vocational secondary education and which employed 288 200 persons and generated €10.0 billion in value added. The subsector of primary education (Division 852) recorded the least number of enterprises at 7 700 enterprises. Despite the low number of enterprises, it employed 175 500 persons, as seen in Table 2a.

Source: Eurostat (sbs_ovw_act)
Source: Eurostat (sbs_ovw_act)
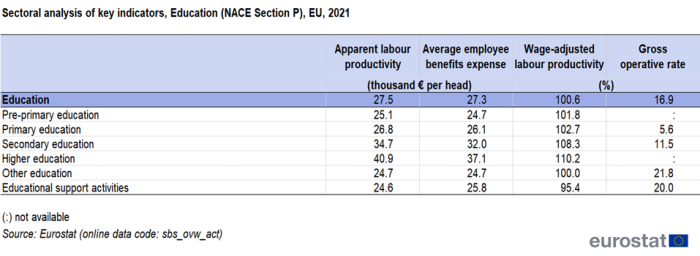
In 2021, apparent labour productivity within the EU's education subsectors ranged from €24 600 per person employed for educational support activities to €40 900 for higher education (Division 854). Whitin the subsector of higher education, comprising post-secondary non-tertiary education and tertiary education, the recorded average employee benefits expense was the highest in the EU's education sector in 2021, at €37 100 per employee. Following closely was secondary education, reporting an average of €32 000 in employee benefits. The subsectors of pre-primary education (Division 851) and other education accounted for the lowest average employee benefits expense within the education sector, both standing at €24 700 per employee — see Table 2b.
Country overview
Figure 2 illustrates the diverse landscape of the market activities in the education sector's contribution to the business economy's employment in 2021. This has varied from 0.5 % in Luxembourg and 0.7 % in Romania and Slovakia to 3.4 % in Spain and Cyprus and has reached the highest share at 4.2 % in Greece. The share in value added terms was much lower, varying from 0.1 % in Luxembourg to 2.3 % in Cyprus, while the EU average was at 0.7 %.
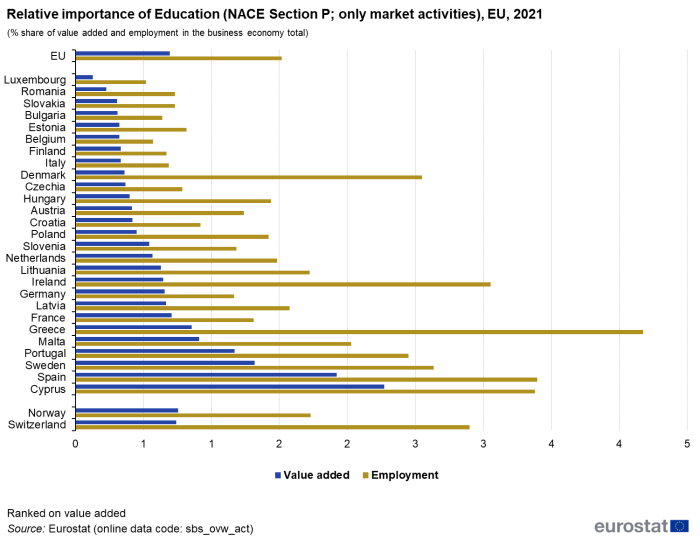
(% share of value added and employment in the business economy total)
Source: Eurostat (sbs_ovw_act)
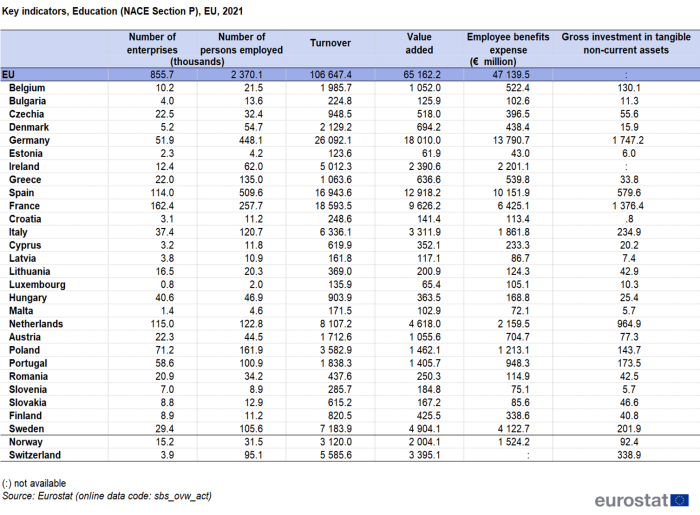
Among the five largest EU Member States, Germany accounted for 27.6 % of the EU valued added of market activities in the education sector in 2021, marginally below its 29.3 % share of value added in the EU's business economy as a whole. Spain recorded the second-highest share, accounting for 19.8 % of the value added in the EU's education sector, surpassing its 7.2 % share in the business economy. France followed closely, having similar shares of value added in both the education sector (14.8 %) and the business economy (14.5 %). The contribution of the top 5 countries in the education sector accounted for 76.8 % of the value added and 63.8 % of employment. In terms of employment, the education sector (only market activities) in Spain had the highest share in the whole business economy (21.5 %), being followed by Germany, France, Poland, and Greece — see Figure 3.
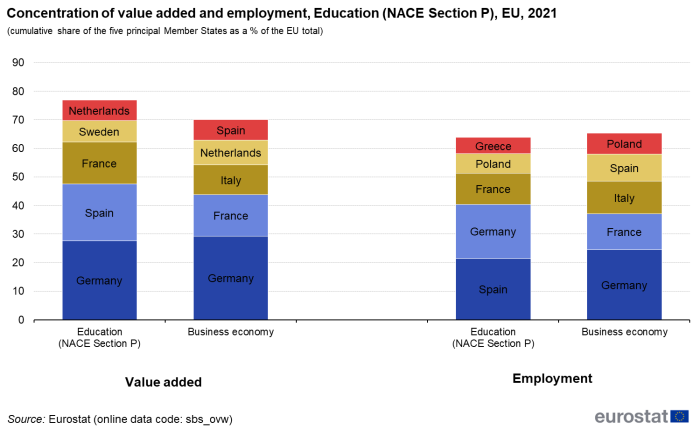
(cumulative share of the five principal Member States as a % of the EU total)
Source: Eurostat (sbs_ovw_act)

Source: Eurostat (sbs_ovw_act)
In value added terms, Germany was the largest EU Member States in three of the six education subsectors in 2021 (see Table 3): pre-primary education, secondary education, and other education. Spain was the largest in two (primary education and higher education). Spain was the largest in two (primary education and higher education), while the Netherlands in educational support activities. As seen in Table 4, in absolute terms, Germany recorded the highest level of value added (€18.0 billion) and of turnover (€26.1 billion) within the education sector in 2021.The second and third highest values in net turnover for the education sector were recorded in France (€18.6 billion) and Spain (€16.9 billion), while in terms of value added the order was reversed. The same three countries also dominated the employment, Spain recording the highest number of persons employed within the education sector in 2021, 0.5 million persons.
Source data for tables and graphs
Data sources and availability
Coverage
The education sector includes the activity of education at any level or for any profession. The instructions may be oral or written and may be provided by radio, television, Internet or via correspondence.
Data on education are collected from administrative sources – mostly derived from the Ministries of education. This is called the UOE (UNESCO-OECD-Eurostat) data collection. It only covers domestic formal educational activity, in other words formal education provided within a country's own territory regardless of ownership or sponsorship of the institutions concerned (whether public or private, national or foreign) or of the education delivery mechanism (whether face-to-face or at a distance). Also included are military schools and academies, prison schools etc. at their respective levels. The breakdown of the categories in the education sector is based on the level of education offered as defined by the levels of ISCED:
- pre-primary education (Division 851) - ISCED level 0
- primary education (Division 852) - ISCED level 1
- secondary education (Division 853) - ISCED levels 2-3
- general secondary education
- technical and vocational secondary education
- higher education (Division 854) - ISCED level 4-8
- post-secondary non-tertiary education
- tertiary education
- other education (Division 855)
- sports and recreational education (including different sports, martial arts, yoga)
- cultural education (including music instruction, dancing, drama, fine arts)
- driving school activities
- other education n.e.c (including academic tutoring, language instruction, public speaking training)
- educational support activities (Division 856).
Formal education is defined according ISCED, as programmes that represent at least the equivalent of one semester (or half of a school/academic year) of full-time study. These programmes are classified according to the ISCED classification, which is also followed in the NACE and reflected in the SBS categories apart from 'other education' and 'educational support activities'.
Data sources
Structural business statistics cover the 'business economy', which includes industry, construction and many services (NACE Rev. 2 sections B to N, P to R as well as division S95 and S96). Structural business statistics do not cover agriculture, forestry and fishing, nor public administration.
Structural business statistics describe the business economy through the observation of units engaged in an economic activity; the unit in structural business statistics is generally the enterprise. An enterprise carries out one or more activities, at one or more locations, and it may comprise one or more legal units. Enterprises that are active in more than one economic activity (plus the value added and turnover they generate, the people they employ, and so on) are classified under the NACE heading corresponding to their principal activity; this is normally the one which generates the largest amount of value added.
The analysis presented in this article is based on the main dataset for structural business statistics (SBS), size class data and regional data, all of which are published annually. SBS only cover the activities of market producers, meaning those acting under market conditions. Contrary to most activities covered by SBS, non-market producers represent a significant part of the education sector.
The main series provides information for each EU Member State as well as a number of non-EU member countries at a detailed level according to the activity classification NACE. Data are available for a wide range of variables.
In structural business statistics, size classes are generally defined by the number of persons employed. A limited set of the standard structural business statistics variables (for example, the number of enterprises, turnover, persons employed and value added) are analysed by size class, mostly down to the three-digit (group) level of NACE. The main size classes used in this article for presenting the results are:
- small and medium-sized enterprises (SMEs): with 1 to 249 persons employed, further divided into
- micro enterprises: with less than 10 persons employed;
- small enterprises: with 10 to 49 persons employed;
- medium-sized enterprises: with 50 to 249 persons employed;
- large enterprises: with 250 or more persons employed.
Structural business statistics also include regional data. Regional SBS data are available at NUTS levels 1 and 2 for most of the EU Member States, Iceland and Norway, mostly down to the two-digit (division) level of NACE. The main variable analysed in this article is the number of persons employed. The type of statistical unit used for regional SBS data is normally the local unit, which is an enterprise or part of an enterprise situated in a geographically identified place. Local units are classified into sectors (by NACE) normally according to their own main activity, but in some EU Member States the activity code is assigned on the basis of the principal activity of the enterprise to which the local unit belongs. The main SBS data series are presented at national level only, and for this national data the statistical unit is the enterprise. It is possible for the principal activity of a local unit to differ from that of the enterprise to which it belongs. Hence, national SBS data from the main series are not necessarily directly comparable with national aggregates compiled from regional SBS.
Direct access to
- Recent Eurostat publications on SBS
- Key figures on Europe – 2023 edition – see subchapter on Business
- Eurostat's Regional Yearbook – see chapter 8. Business
- News Release SBS – 2021 final data
Glossary
ESMS metadata files
- Structural business statistics – SBS metadata file
- European Commission – Directorate-General for Education, Youth, Sport and Culture
- European Education Area – Strategic framework for European cooperation in education and training towards the European Education Area and beyond (2021–2030)
- European Centre for the Development of Vocational Training (CEDEFOP)
- Eurydice – Information network on education in Europe – National education systems
- OECD – Education
- UNESCO – Education transforms lives
